
benthecoder/linkedin-visualizer
benthecoder/linkedin-visualizer has 54 GitHub stars and 11 forks. GitHot measured 0 in 7 days. Last checked 2026-11-10 19:59 UTC. Last push 2022-10-06.
The missing feature in LinkedIn
What you can do
- Total connections on LinkedIn
- Where most of your connections work at
- Who most of your connections are (what job title they hold)
- Who you last connected with
Measured star growth
- in 24h
- Update delayed
- in 7 days
- 0
- in 15 days
- Update delayed
- in 1 month
- Update delayed
Net star changes over overlapping periods, not daily totals. Missing measurements are left blank. Stars measure attention, not software quality.
README.md
OriginalLinkedin Connections Insights 🪄

Get helpful statistics on your LinkedIn connection now!
Learn more about the project (Link)
Check out a walkthrough of the app of my LinkedIn connections (Link)
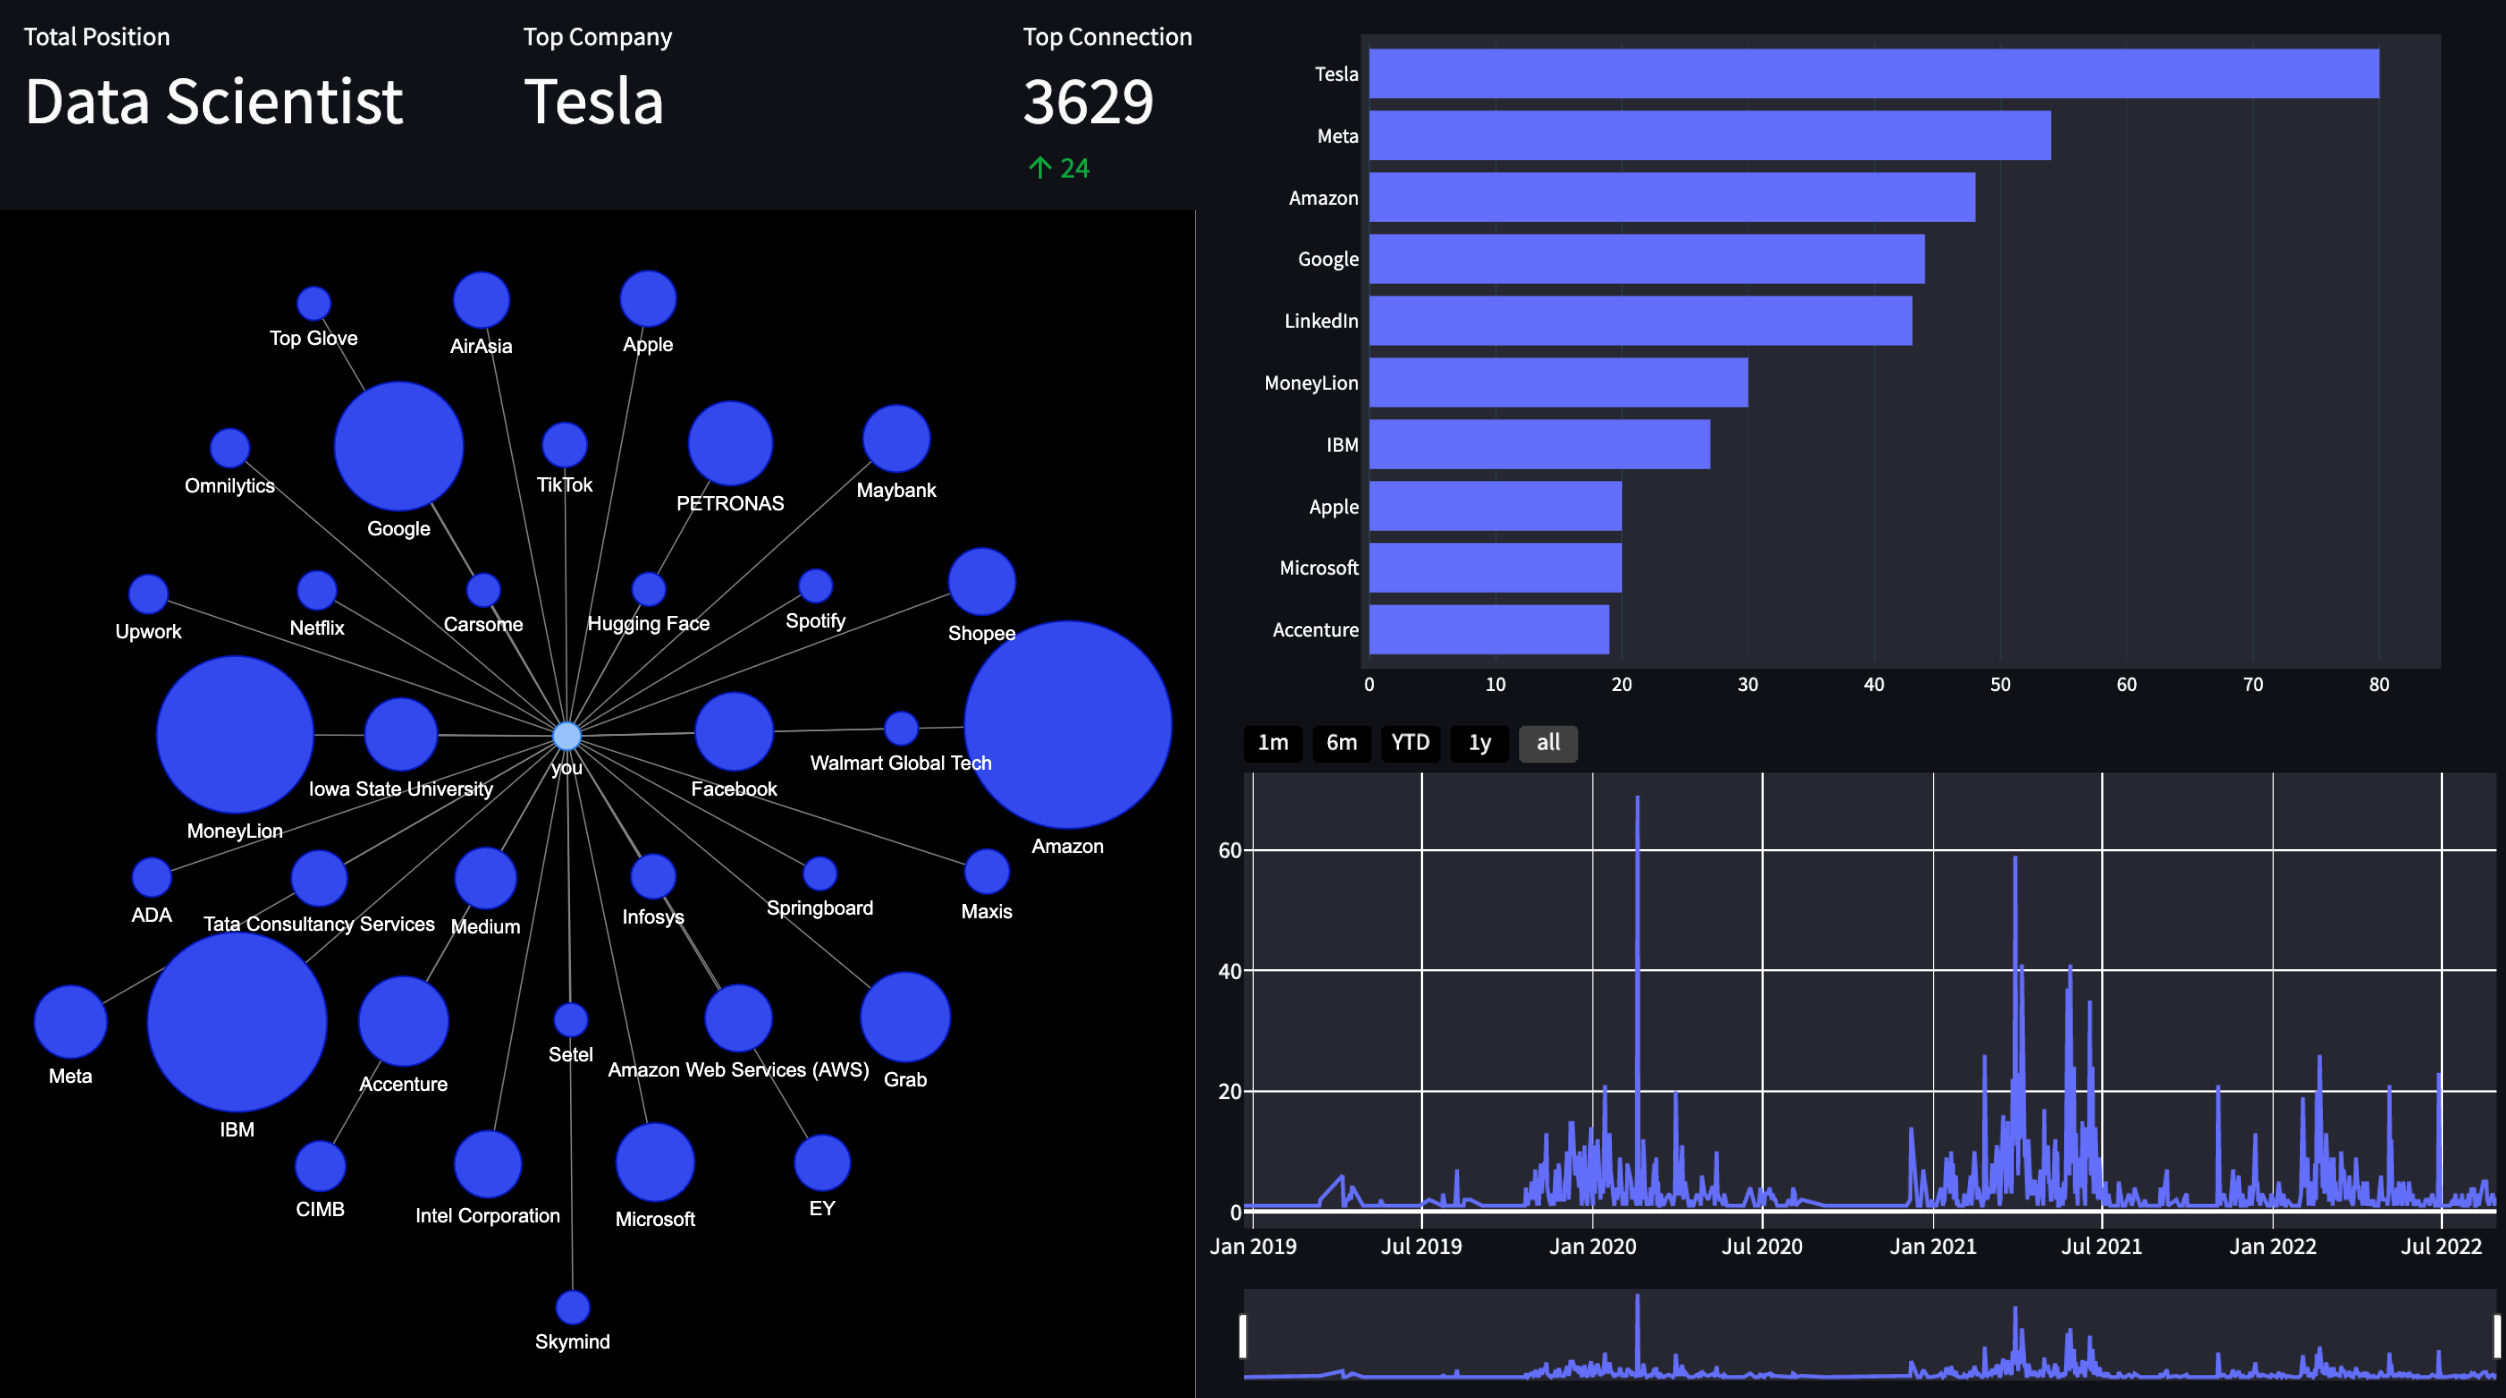
Features
This app tells you the information below
- Total connections on LinkedIn
- Where most of your connections work at
- Who most of your connections are (what job title they hold)
- Who you last connected with
- Who you first connected with (send them a message!)
- Bar chart of top companies and positions
- Time series plot of your connections over time (find out when you had the most connections)
- A graph/network of your connections (see your connections in a graph)
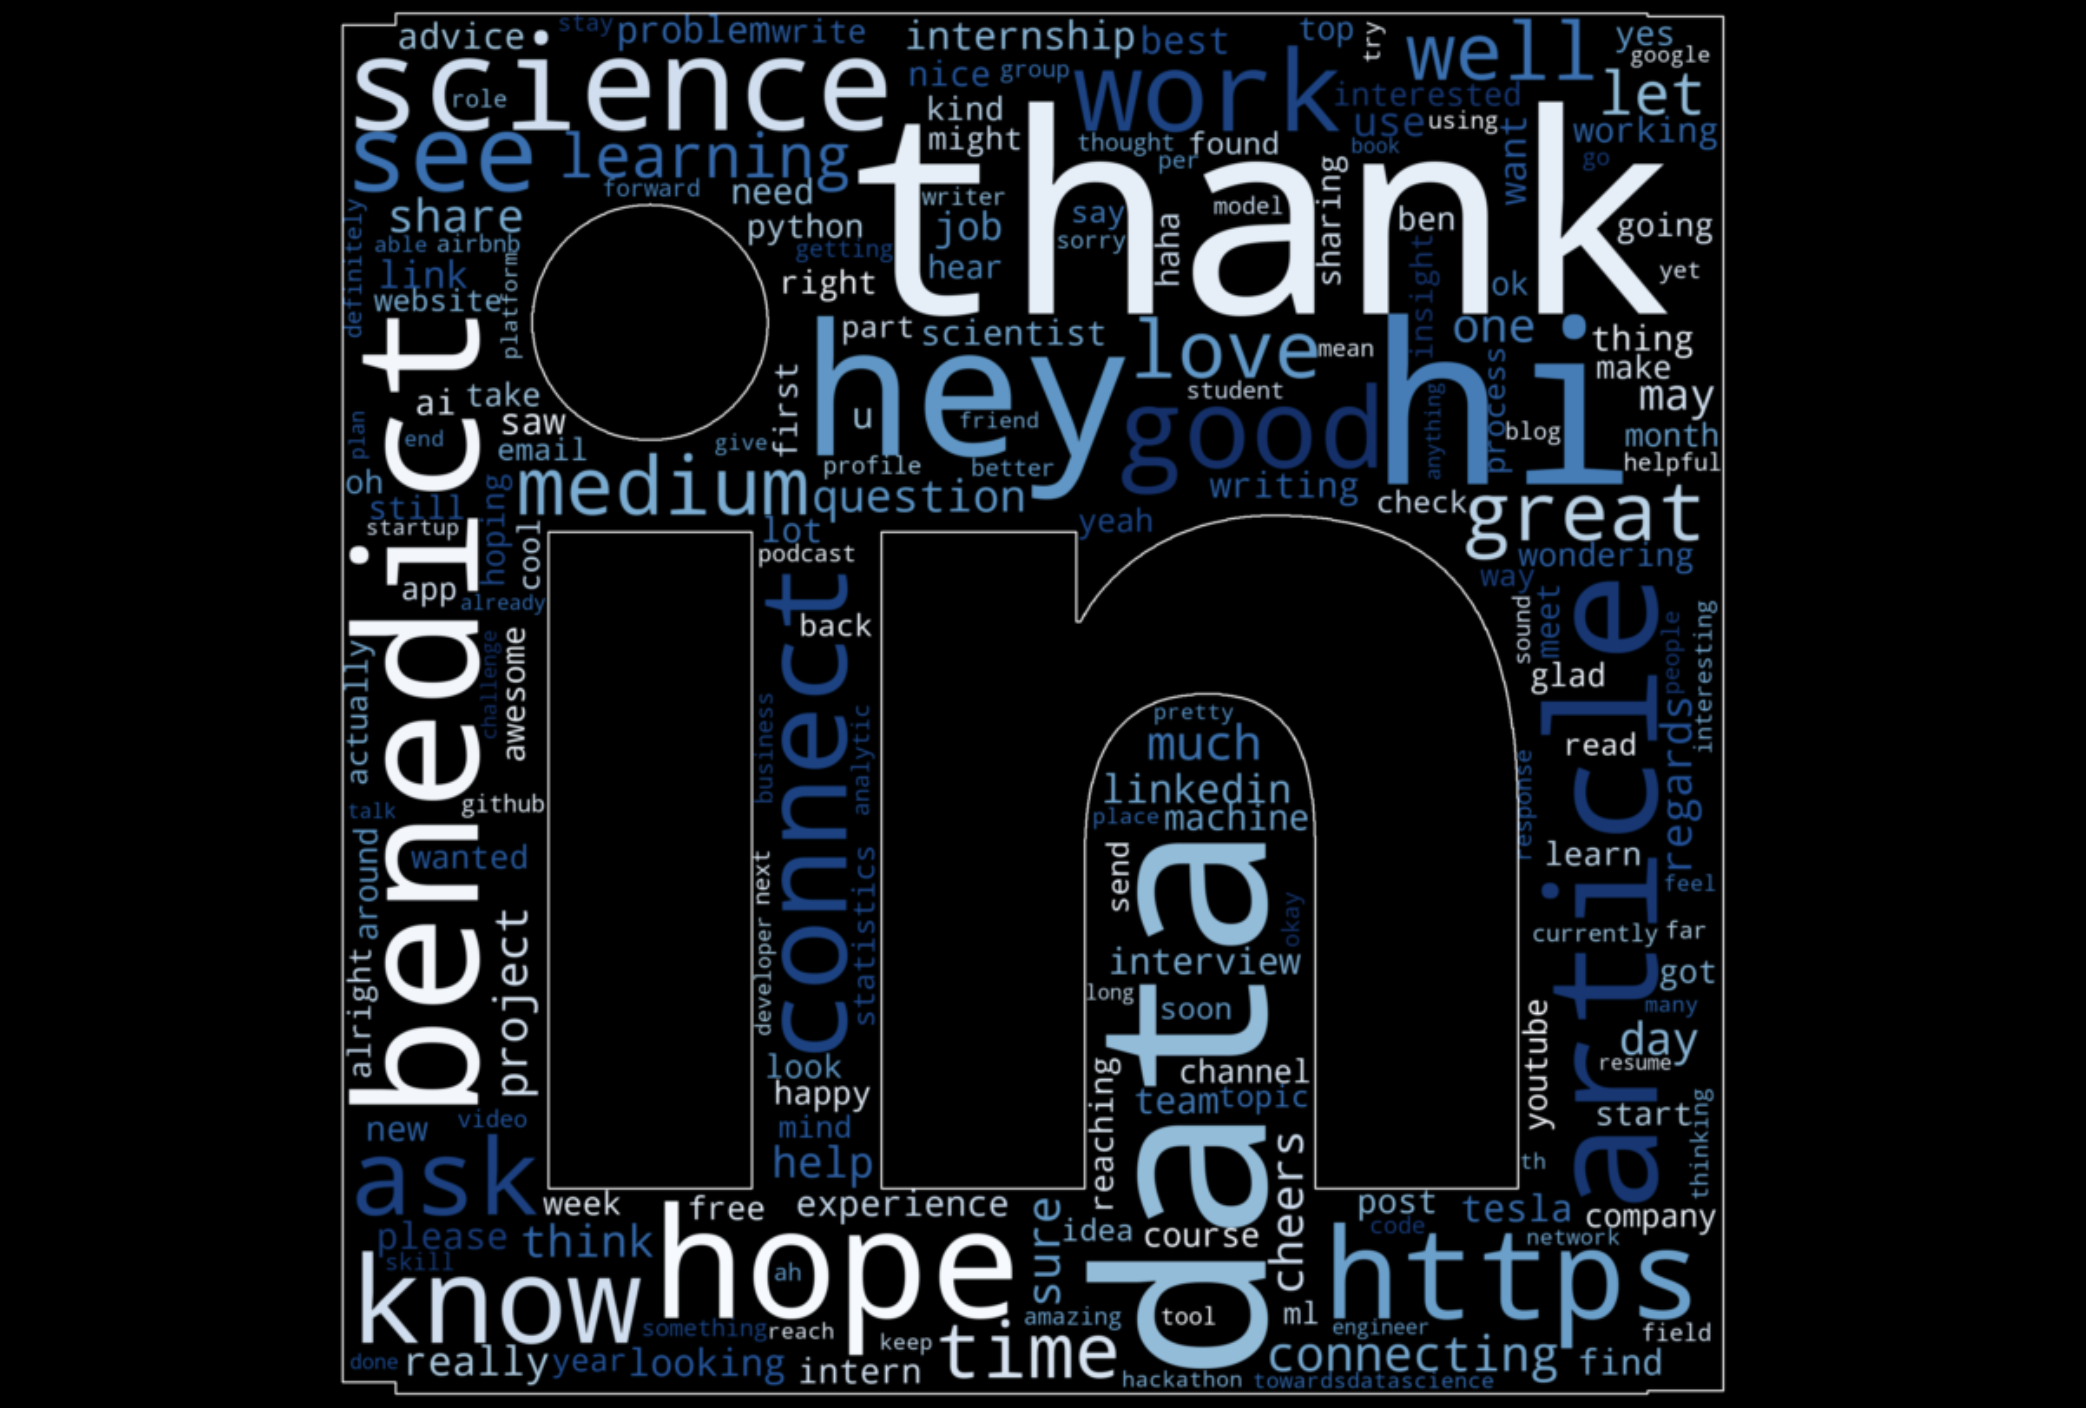
- A wordcloud of your chat messages with your connections (new!)
- Last but not least, a "who you can cold email" section that provides a list of emails of your connections (perks of LinkedIn connections!)
Word Cloud (New Feature!)
Run Locally
Clone the project
git clone https://github.com/benthecoder/linkedin-visualizer.git
Go to the project directory
cd linkedin-visualizer
Using Docker
Build an Image
docker build -t linkedin-visualizer:1.0 .
Run the Image
docker run -p 8501:8501 linkedin-visualizer:1.0
The app is now live on http://localhost:8501/
Using Conda
Create Conda environment
conda create --name env_name python=3.8
Activate the environment
conda activate env_name
Install requirements
pip install -r requirements.txt
Run streamlit
streamlit run app.py
Using Poetry
first make sure you have python 3.8
poetry install
poetry run streamlit run app.py
Contributing
Contributions are always welcome!
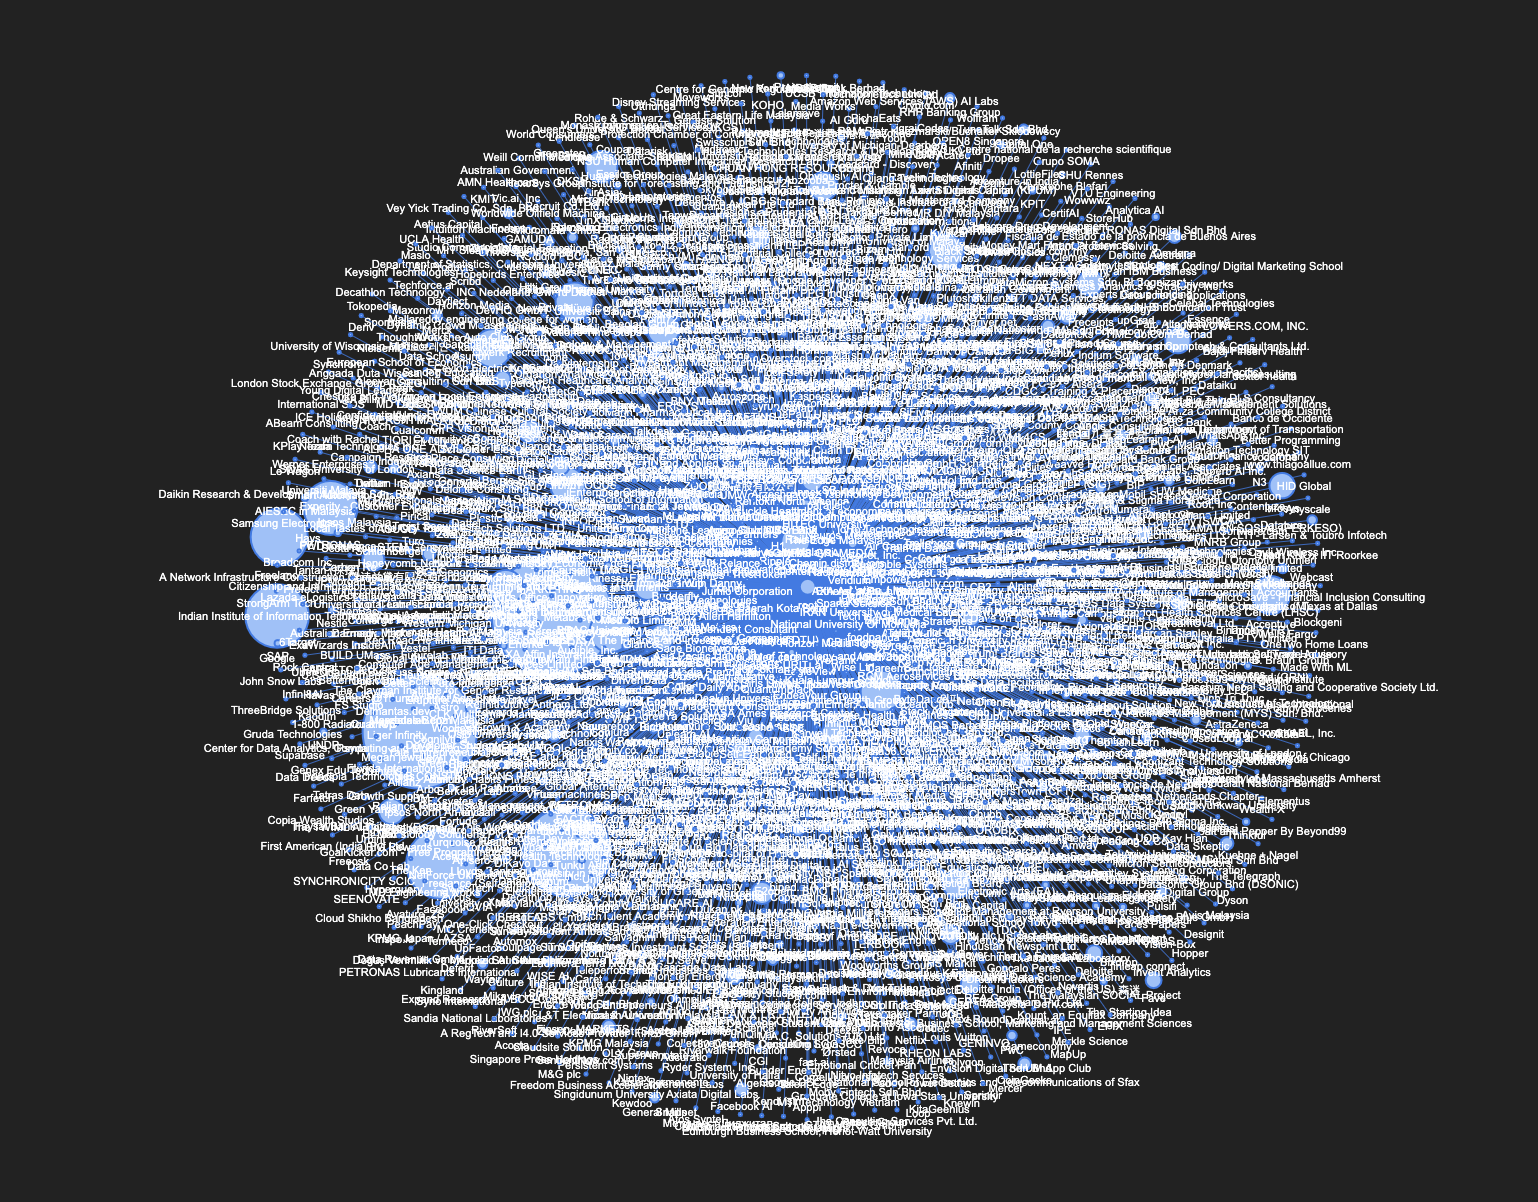
All connections
Here's what happens when I display all of the companies where my connections work at
Explore related projects
Asabeneh/30-Days-Of-Python
The 30 Days of Python programming challenge is a step-by-step guide to learn the Python programming language in 30 days. This challenge may take more than 100 days. Follow your own pace. These videos may help too: https://www.youtube.com/channel/UC7PNRuno1rzYPb1xLa4yktw
78,560 starsgrafana/grafana
The open and composable observability and data visualization platform. Visualize metrics, logs, and traces from multiple sources like Prometheus, Loki, Elasticsearch, InfluxDB, Postgres and many more.
77,830 starsredis/redis
For developers, who are building real-time data-driven applications, Redis is the preferred, fastest, and most feature-rich cache, data structure server, and document and vector query engine.
77,395 starsapache/superset
Apache Superset is a Data Visualization and Data Exploration Platform
75,473 stars