Projects View on GitHub
Yang-Tang/shinyjqui
Yang-Tang/shinyjqui has 279 GitHub stars and 33 forks. GitHot measured 0 stars in 24 hours. Last checked 2026-11-17 22:12 UTC. Last push 2023-12-30.
Measured star growth
- in 24h
- 0
- in 7 days
- Collecting history
- in 15 days
- Collecting history
- in 1 month
- Collecting history
Net star changes over overlapping periods, not daily totals. Missing measurements are left blank. Stars measure attention, not software quality.
About
jQuery UI Interactions and Effects for Shiny
Developer ToolsREADME.md
Originalshinyjqui


shinyjqui package is an R wrapper of jQuery UI javascript library. It can be used to easily add interactions and animation effects to a shiny app.
Installation
You can install the stable version from CRAN, or the development version from github with:
# install from CRAN
install.packages('shinyjqui')

# for the development version
devtools::install_github("yang-tang/shinyjqui")
Usage
# load packages
library(shiny)
library(shinyjqui)
library(ggplot2)
library(highcharter)
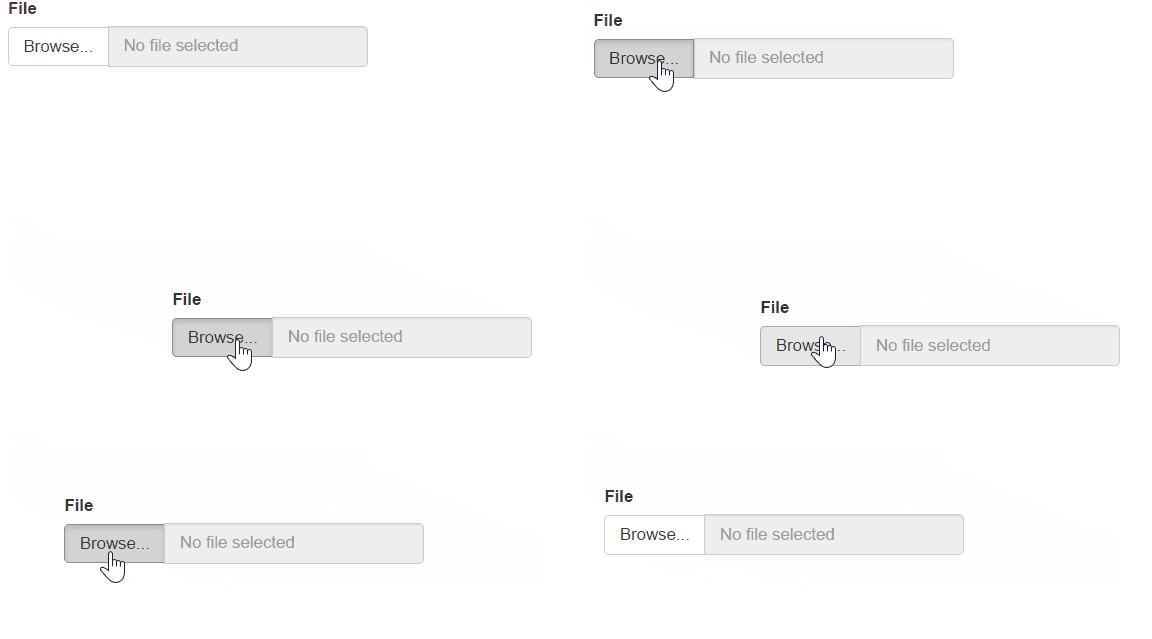
- Draggable: Allow elements to be moved using the mouse
server <- function(input, output) {}

ui <- fluidPage(
  jqui_draggable(fileInput('file', 'File'))
)

shinyApp(ui, server)
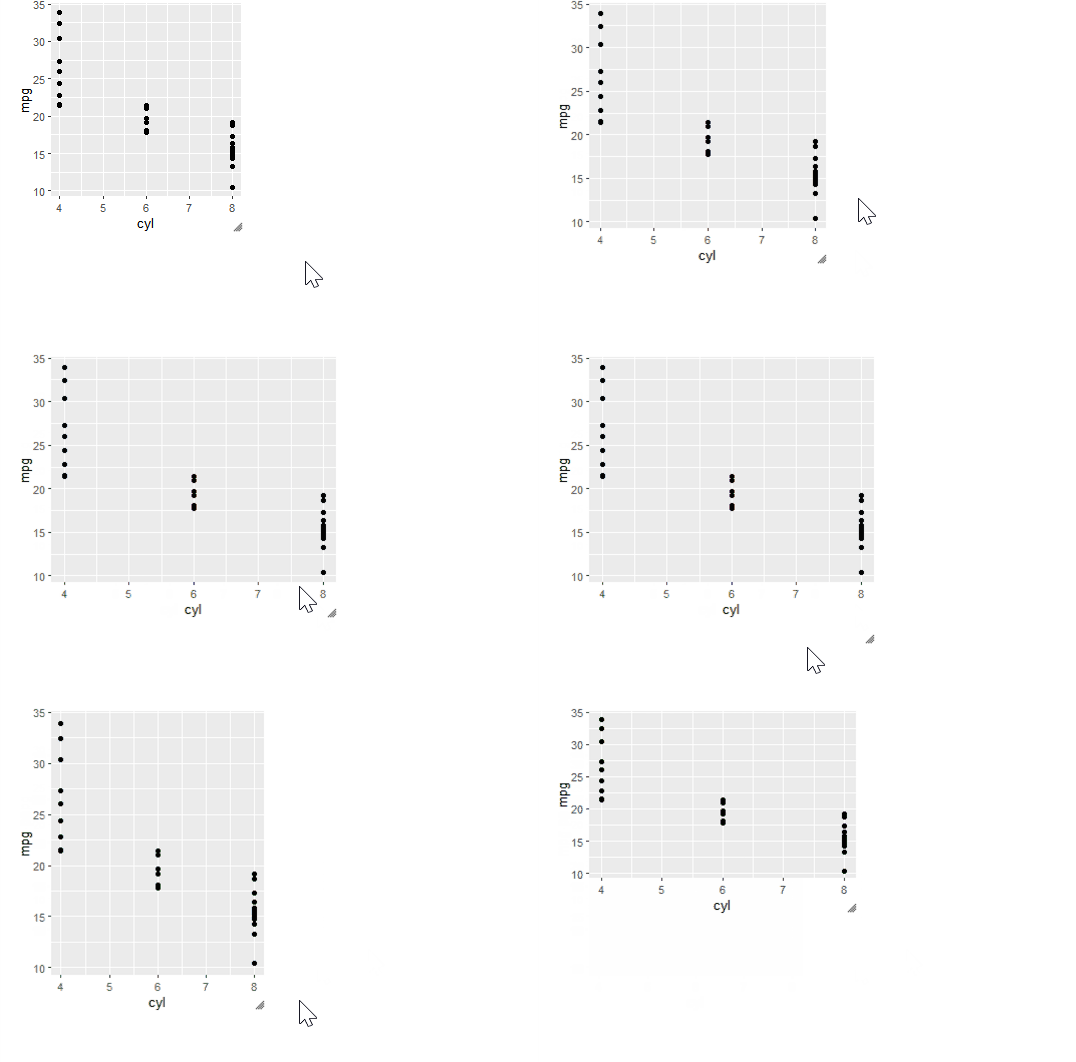
- Resizable: Change the size of an element using the mouse.
server <- function(input, output) {
  output$gg <- renderPlot({
    ggplot(mtcars, aes(x = cyl, y = mpg)) + geom_point()
  })
}

ui <- fluidPage(
  jqui_resizable(plotOutput('gg', width = '200px', height = '200px'))
)

shinyApp(ui, server)
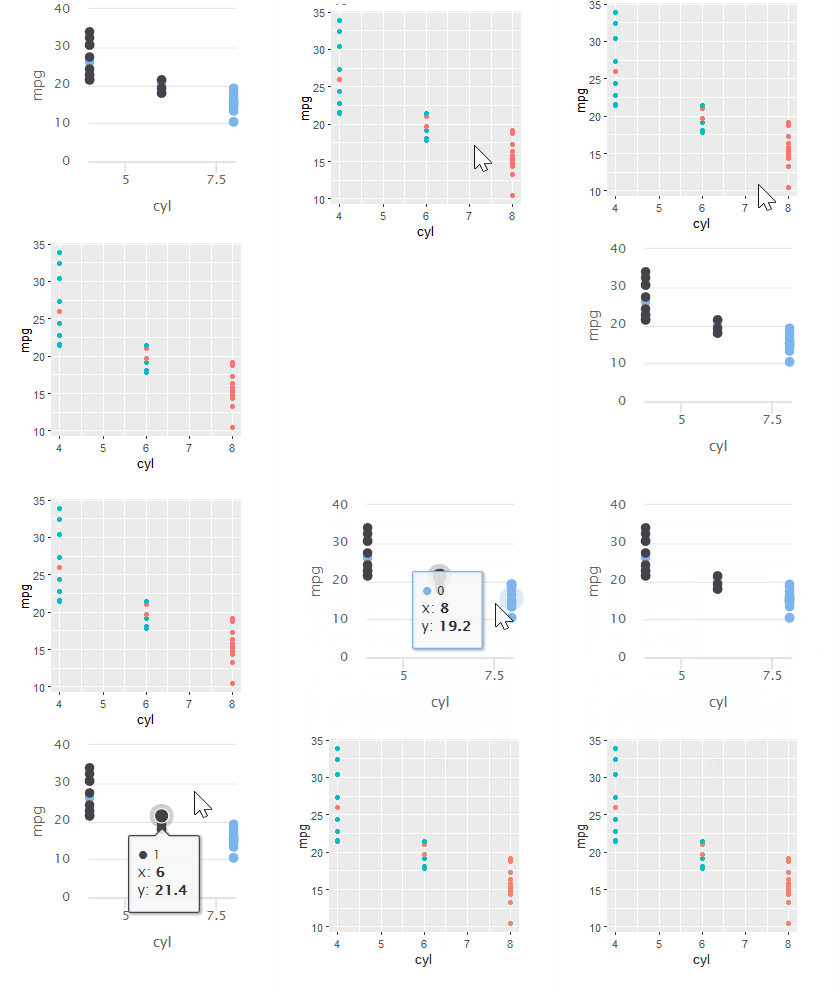
- Sortable: Reorder elements in a list or grid using the mouse.
server <- function(input, output) {
  output$hc <- renderHighchart({
    hchart(mtcars, "scatter", hcaes(x = cyl, y = mpg, group = factor(vs))) %>%
      hc_legend(enabled = FALSE)
  })
  output$gg <- renderPlot({
    ggplot(mtcars, aes(x = cyl, y = mpg, color = factor(vs))) +
      geom_point() +
      theme(legend.position= "none")
  })
}

ui <- fluidPage(
  jqui_sortable(div(id = 'plots',
                     highchartOutput('hc', width = '200px', height = '200px'),
                     plotOutput('gg', width = '200px', height = '200px')))
)

shinyApp(ui, server)
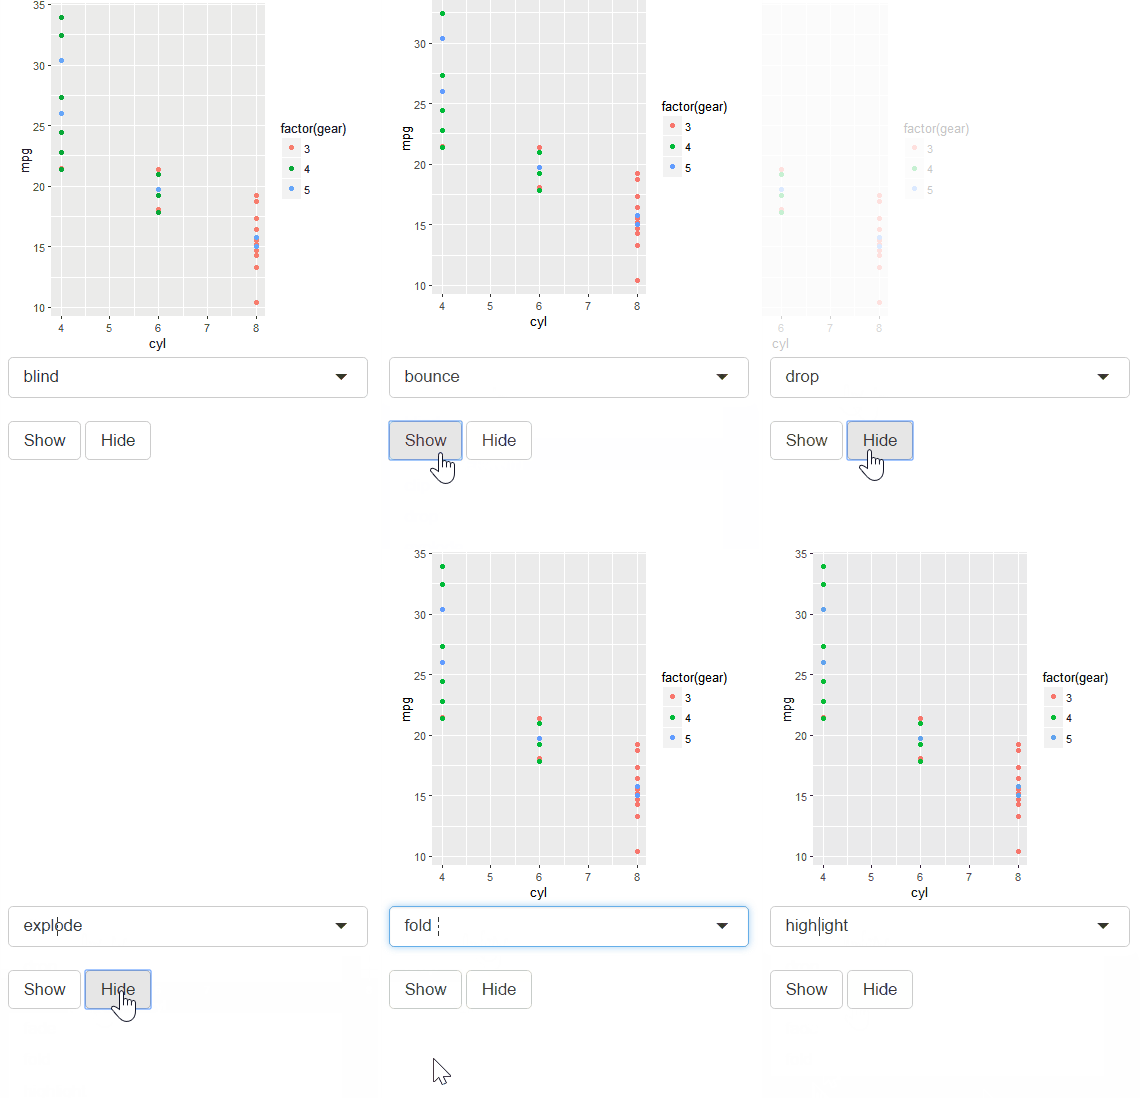
- Animation Effects: Apply an animation effect to an element. Effects can also be used in hide or show.
server <- function(input, output) {
  observeEvent(input$show, {
    jqui_show('#gg', effect = input$effect)
  })

  observeEvent(input$hide, {
    jqui_hide('#gg', effect = input$effect)
  })

  output$gg <- renderPlot({
    ggplot(mtcars, aes(x = cyl, y = mpg, color = factor(gear))) +
      geom_point() +
      theme(plot.background = element_rect(fill = "transparent",colour = NA))
  }, bg = "transparent")
}

ui <- fluidPage(
  div(style = 'width: 400px; height: 400px',
      plotOutput('gg', width = '100%', height = '100%')),
  selectInput('effect', NULL, choices = get_jqui_effects()),
  actionButton('show', 'Show'),
  actionButton('hide', 'Hide')
)

shinyApp(ui, server)
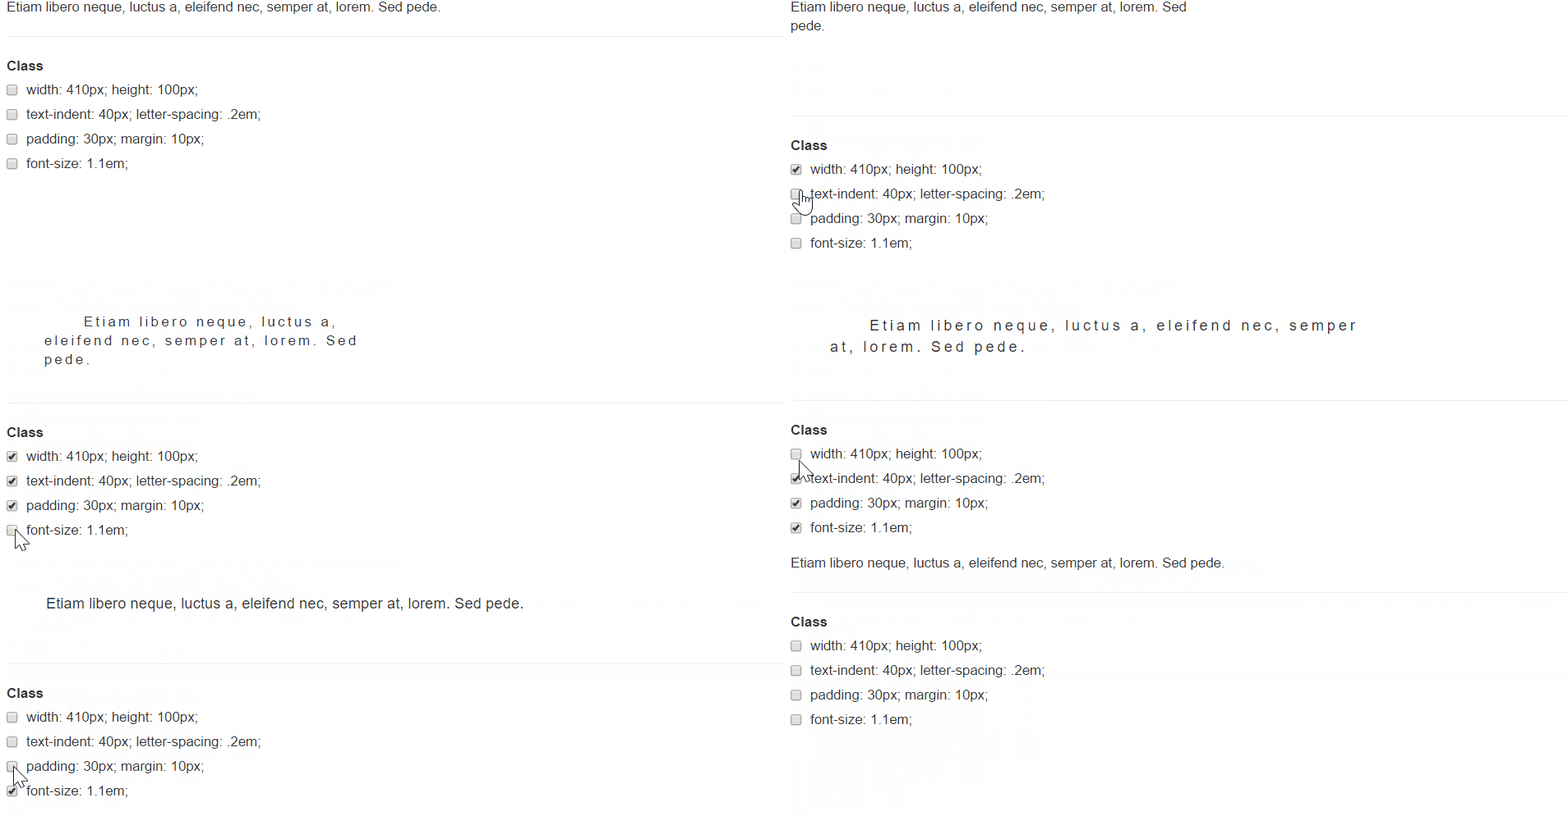
- Classes transformation: Add and remove class(es) to elements while animating all style changes.
server <- function(input, output) {

  current_class <- c()

  observe({
    input$class
    class_to_remove <- setdiff(current_class, input$class)
    class_to_add <- setdiff(input$class, current_class)
    current_class <<- input$class
    if(length(class_to_remove) > 0) {
      jqui_remove_class('#foo', paste(class_to_remove, collapse = ' '), duration = 1000)}
    if(length(class_to_add) > 0) {
      jqui_add_class('#foo', paste(class_to_add, collapse = ' '), duration = 1000)}
  })

}

ui <- fluidPage(

  tags$head(
    tags$style(
      HTML('.class1 { width: 410px; height: 100px; }
            .class2 { text-indent: 40px; letter-spacing: .2em; }
            .class3 { padding: 30px; margin: 10px; }
            .class4 { font-size: 1.1em; }')
    )
  ),

  div(id = 'foo', 'Etiam libero neque, luctus a, eleifend nec, semper at, lorem. Sed pede.'),
  hr(),
  checkboxGroupInput('class', 'Class',
                     choices = list(`width: 410px; height: 100px;` = 'class1',
                                    `text-indent: 40px; letter-spacing: .2em;` = 'class2',
                                    `padding: 30px; margin: 10px;` = 'class3',
                                    `font-size: 1.1em;` = 'class4'))


)

shinyApp(ui, server)
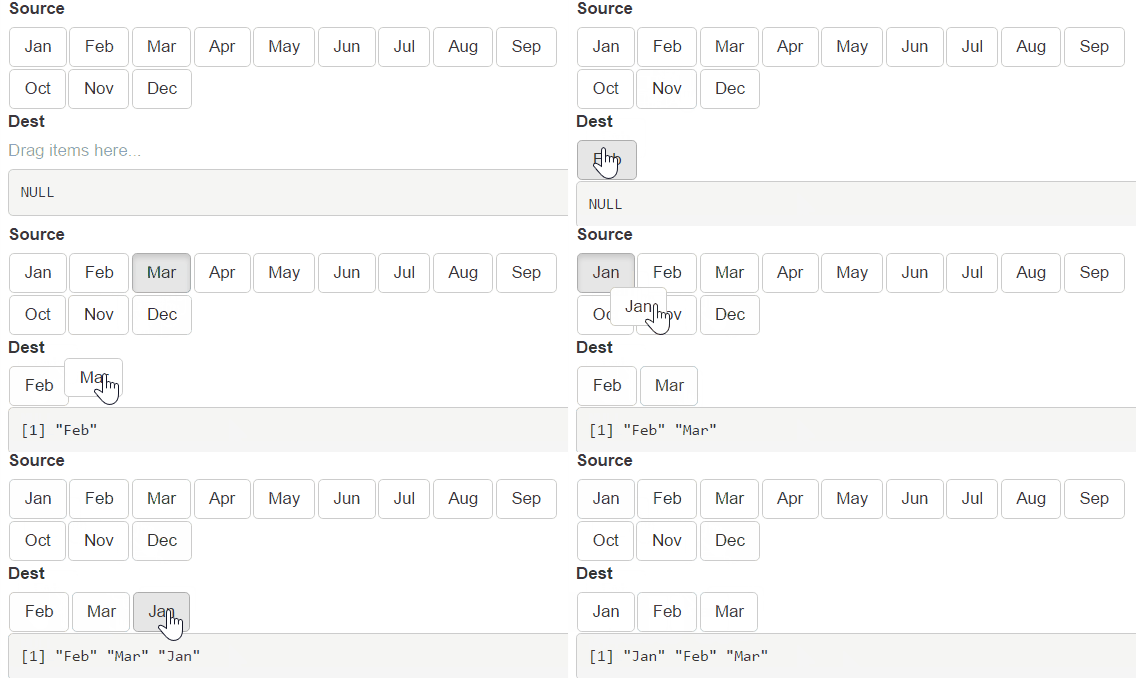
- orderInput(): Display a list of items. Their order can be changed by drag and drop.
server <- function(input, output) {
  output$order <- renderPrint({ print(input$dest) })
}

ui <- fluidPage(
  orderInput('source', 'Source', items = month.abb,
             as_source = TRUE, connect = 'dest'),
  orderInput('dest', 'Dest', items = NULL, placeholder = 'Drag items here...'),
  verbatimTextOutput('order')
)

shinyApp(ui, server)
- sortableTableOutput(): Render a HTML table with sortable rows.
ui <- fluidPage(
  verbatimTextOutput("index"),
  sortableTableOutput("tbl")
)

server <- function(input, output) {
  output$index <- renderPrint({
    cat("Row index:\n")
    input$tbl_row_index
  })
  output$tbl <- renderTable(head(mtcars), rownames = TRUE)
}

shinyApp(ui, server)

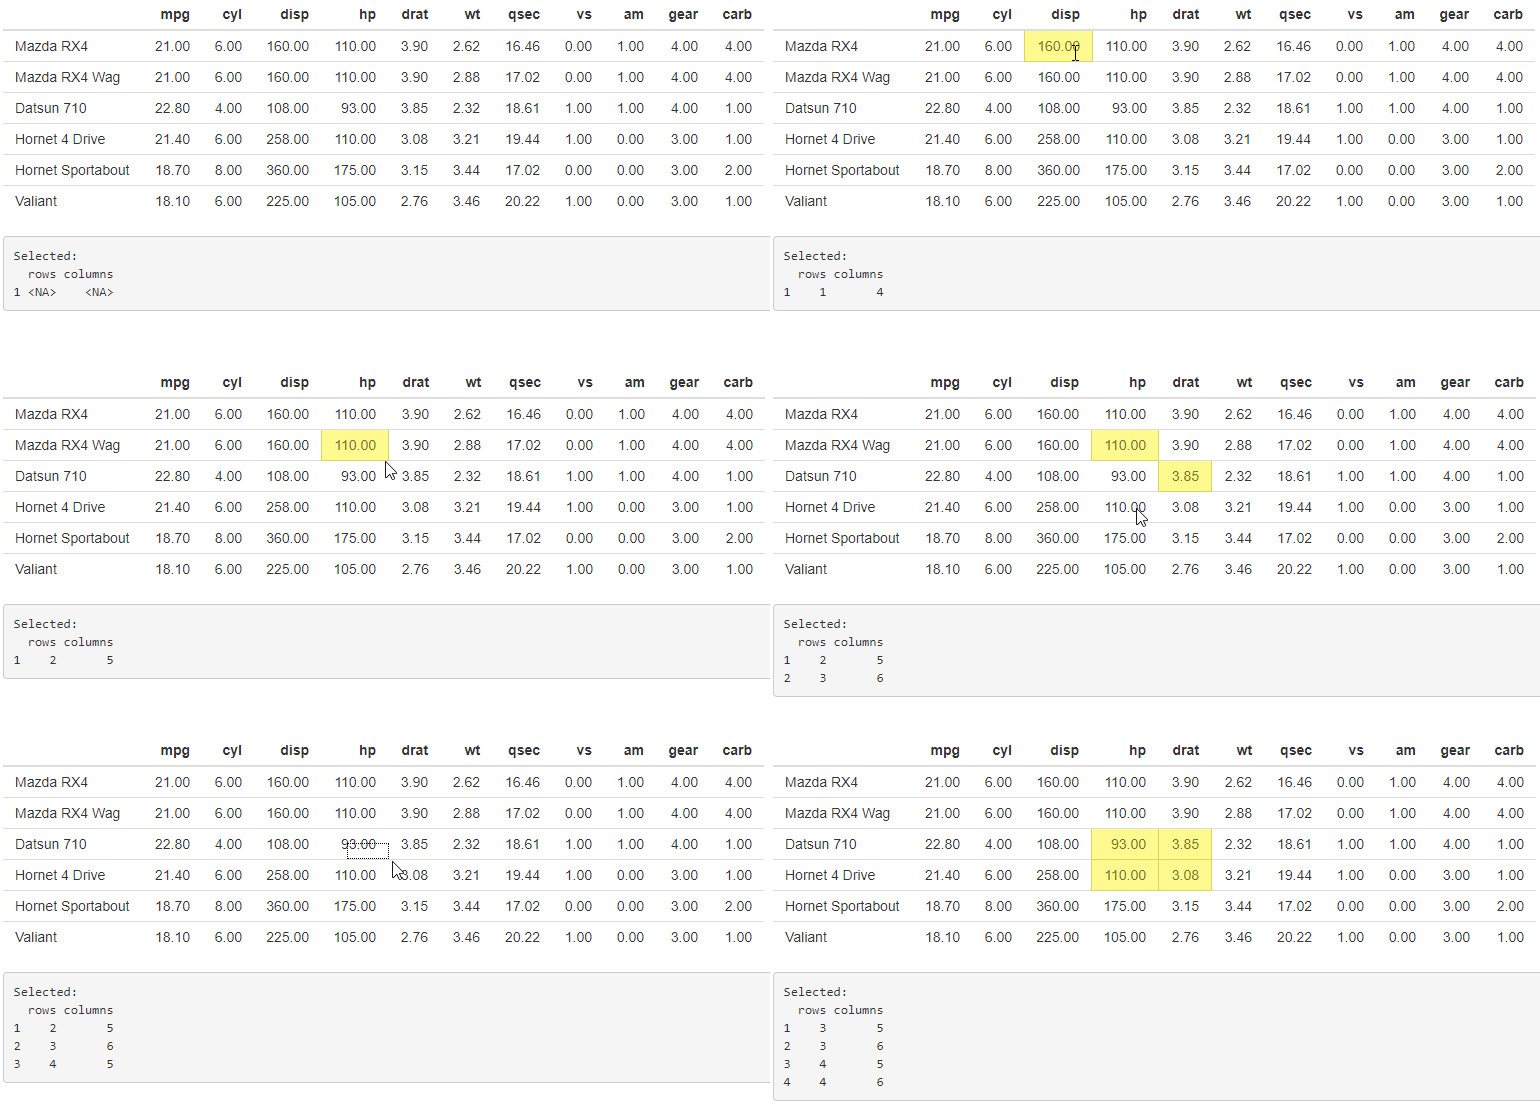
- selectableTableOutput(): Render a HTML table with selectable rows or cells.
ui <- fluidPage(
  selectableTableOutput("tbl", selection_mode = "cell"),
  verbatimTextOutput("selected")
)

server <- function(input, output) {
  output$selected <- renderPrint({
    cat("Selected:\n")
    input$tbl_selected
  })
  output$tbl <- renderTable(head(mtcars), rownames = TRUE)
}

shinyApp(ui, server)
For more information, please visit the package website.