
ResidentMario/geoplot
ResidentMario/geoplot has 1,216 GitHub stars and 98 forks. GitHot measured 0 stars in 24 hours. Last checked 2026-11-09 07:43 UTC. Last push 2024-06-08.
High-level geospatial data visualization library for Python.
Measured star growth
- in 24h
- 0
- in 7 days
- Update delayed
- in 15 days
- Update delayed
- in 1 month
- Update delayed
Net star changes over overlapping periods, not daily totals. Missing measurements are left blank. Stars measure attention, not software quality.
README.md
Originalgeoplot: geospatial data visualization


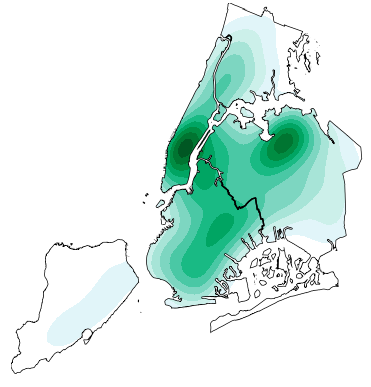
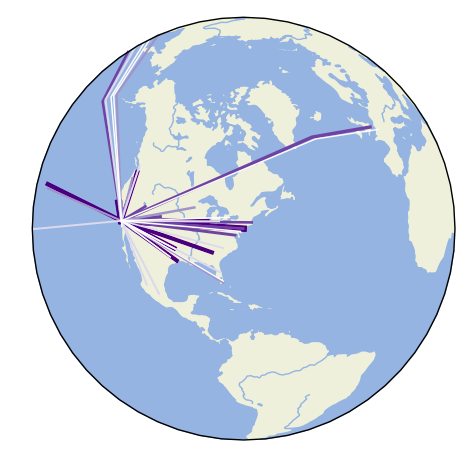
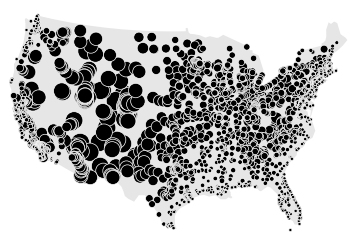
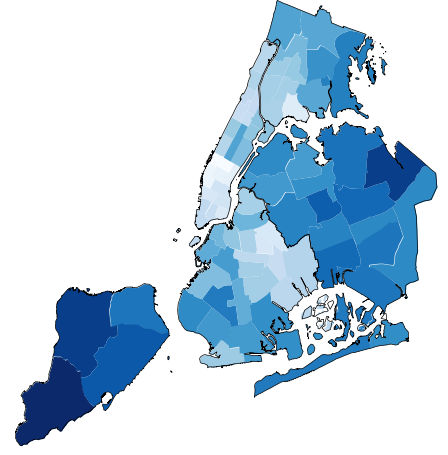
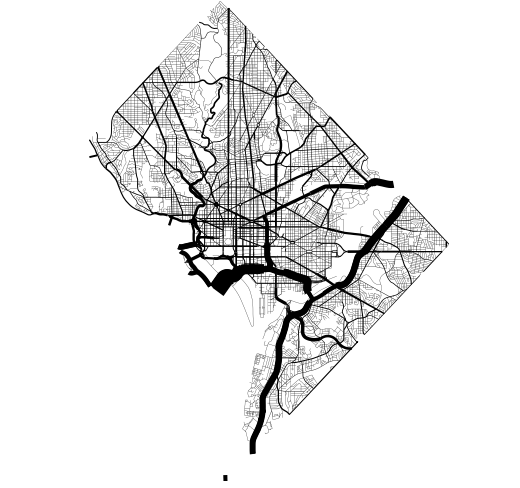
geoplot is a high-level Python geospatial plotting library. It's an extension to cartopy and matplotlib which makes mapping easy: like seaborn for geospatial. It comes with the following features:
- High-level plotting API: geoplot is cartographic plotting for the 90% of use cases. All of the standard-bearermaps that you’ve probably seen in your geography textbook are easily accessible.
- Native projection support: The most fundamental peculiarity of geospatial plotting is projection: how do you unroll a sphere onto a flat surface (a map) in an accurate way? The answer depends on what you’re trying to depict.
geoplotprovides these options. - Compatibility with
matplotlib: Whilematplotlibis not a good fit for working with geospatial data directly, it’s a format that’s well-incorporated by other tools.
Installation is simple with conda install geoplot -c conda-forge. See the documentation for help getting started.
Author note: geoplot is currently in a maintenence state. I will continue to provide bugfixes and investigate user-reported issues on a best-effort basis, but do not expect to see any new library features anytime soon.
Explore related projects
codecrafters-io/build-your-own-x
Master programming by recreating your favorite technologies from scratch.
561,375 starspublic-apis/public-apis
A collective list of free APIs
497,650 starsmorluto/rea
Reverse engineer anything with agents, from app behavior down to native binaries.
447,211 starsopenclaw/openclaw
The AI that really does things. Any OS. Any Platform. The lobster way. 🦞
394,260 stars