
PriyankaJhaTheDeveloper/DataAnalystPortfolioProjects
PriyankaJhaTheDeveloper/DataAnalystPortfolioProjects has 907 GitHub stars and 131 forks. GitHot measured 0 stars in 24 hours, +5 in 7 days, and +14 in 15 days. Last checked 2026-11-09 19:12 UTC. Last push 2022-02-25.
This repository contains my Data Analytics portfolio projects ranging from SQL, Python, Tableau, Excel, and Hadoop (HiveQL).
Measured star growth
- in 24h
- 0
- in 7 days
- +5
- in 15 days
- +14
- in 1 month
- Collecting history
Net star changes over overlapping periods, not daily totals. Missing measurements are left blank. Stars measure attention, not software quality.
README.md
OriginalPortfolio Projects
Following are my projects in SQL, Python, Tableau & Excel:
You can take a look at my personal website : www.priyankajha24.wixsite.com
You can also take a look at my Linkedin : PriyankaJhaTheAnalyst
- SQL & Tableau -
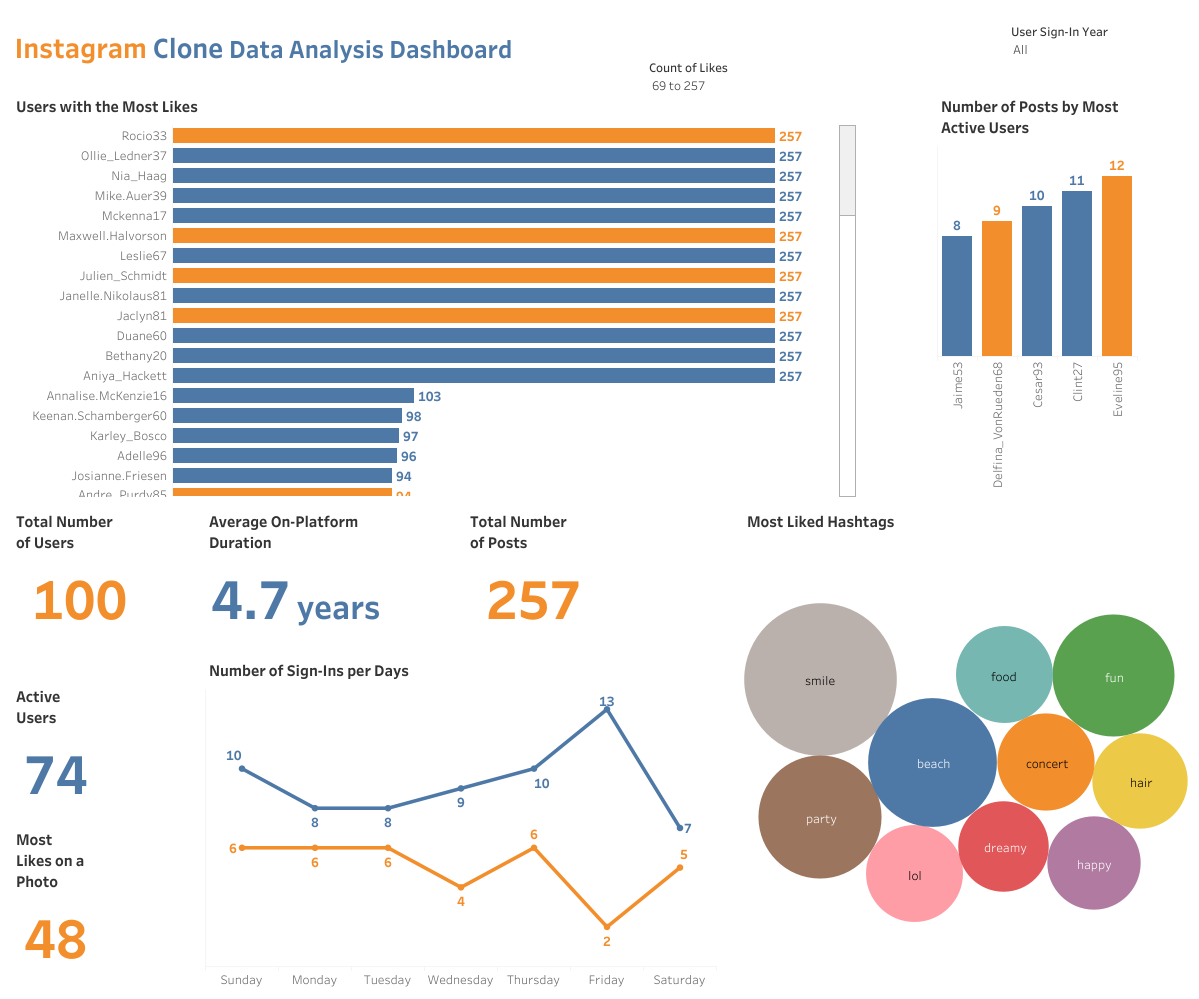
Hadoop (Hive) -
- NYC Yellow Taxi Records: Data Analysis
Review the HiveQL Script: HERE
- NYC Yellow Taxi Records: Data Analysis
SQL -
PostgreSQL -
Python -
- Movies Industry Dataset: Exploratory Data Analysis Project
Read the complete Project Analysis in Markdown: HERE
- Movies Industry Dataset: Exploratory Data Analysis Project
Tableau -
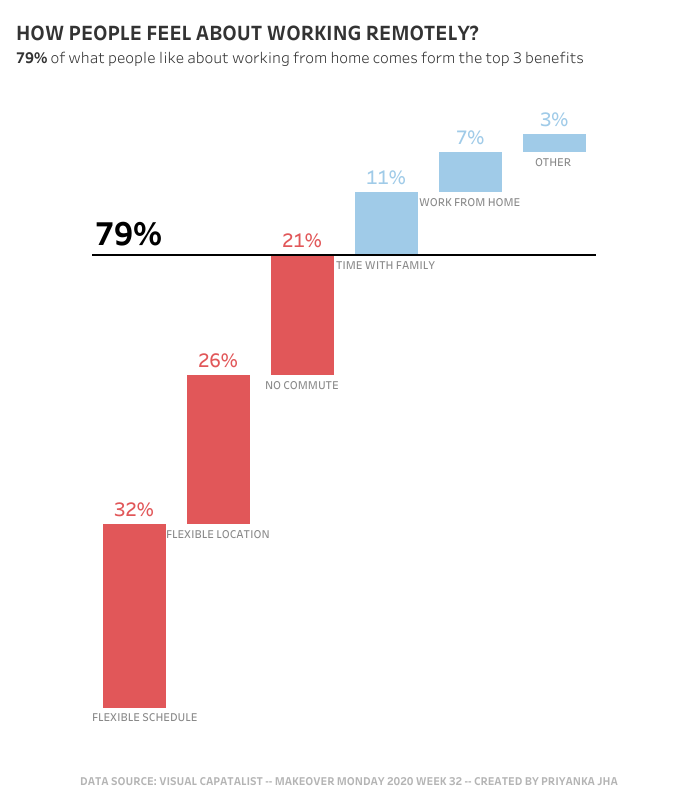
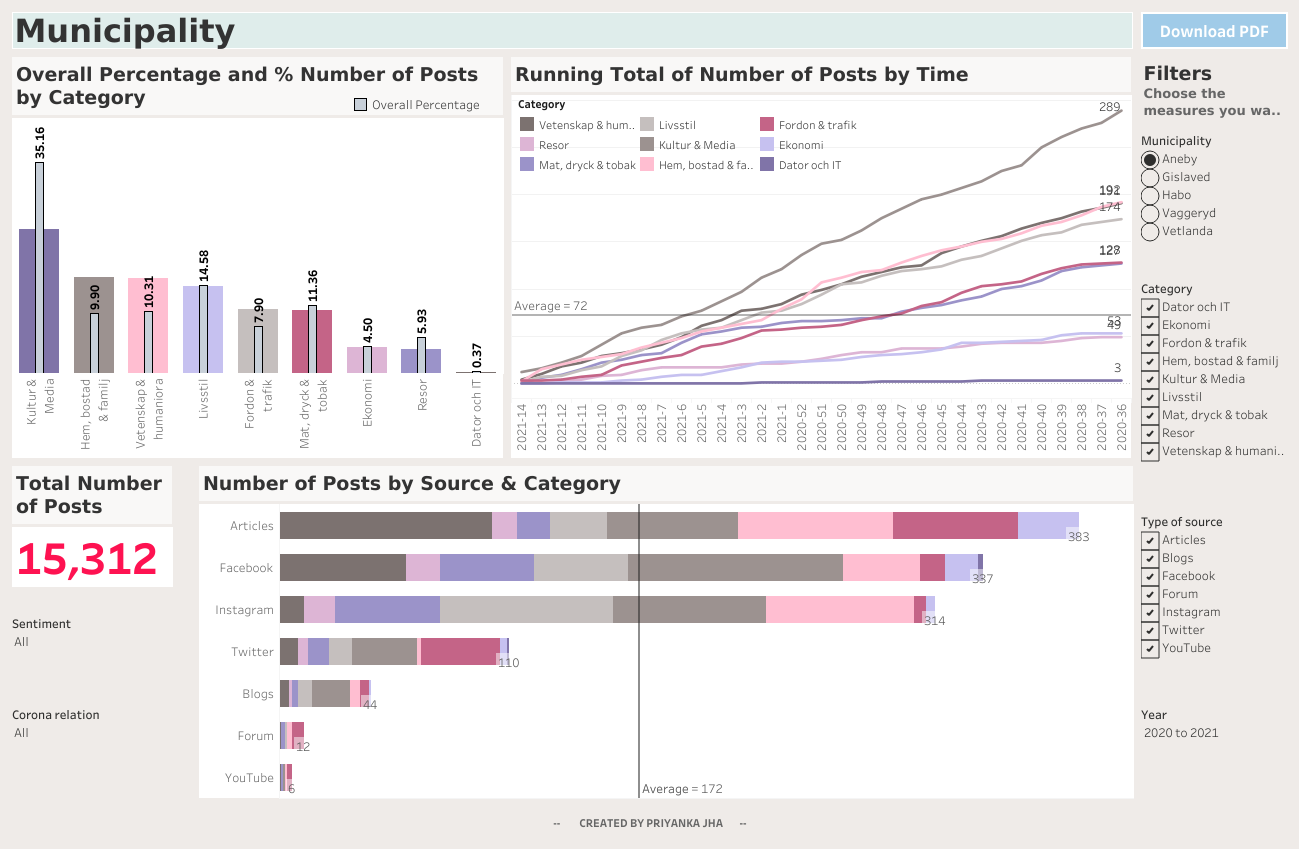
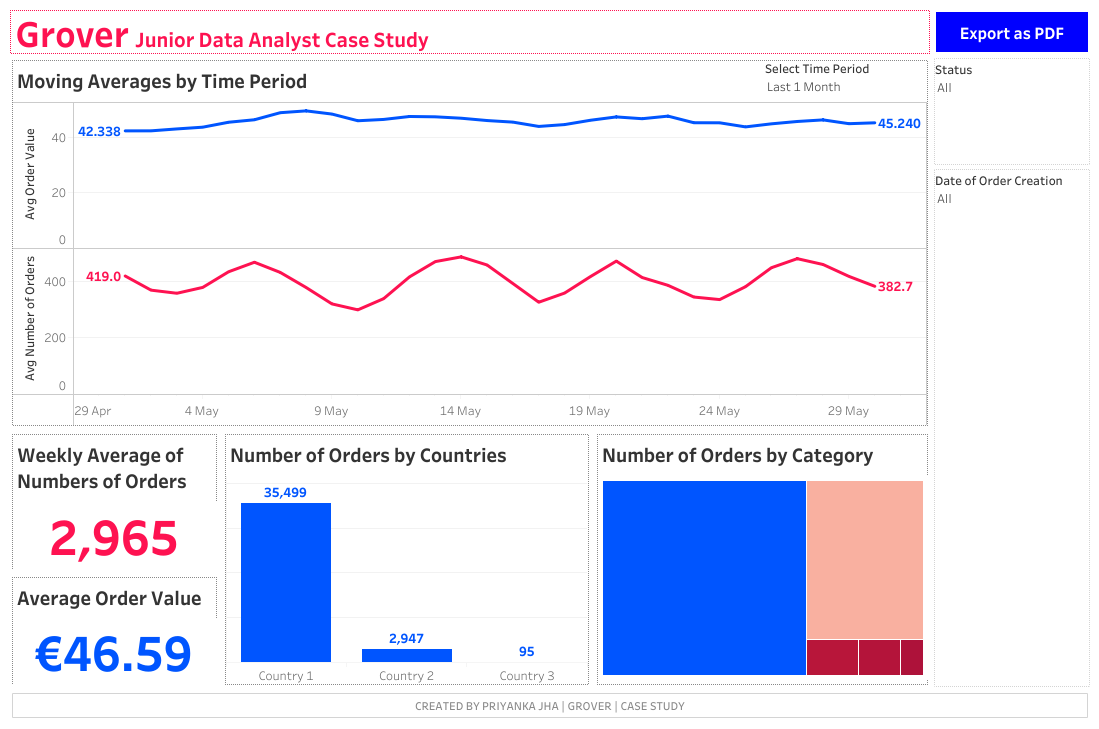
To view these Tableau Dashboards in Tableau Public, click on the hypertext link.
- #MakeoverMonday 2020 Week 32 | Benefits of Working from Home: https://public.tableau.com/views/MakeoverMonday2020Week32BenefitsofWorkingfromHome/WORKFROMHOME?:language=en-GB&:display_count=n&:origin=viz_share_link
- Municipality Data Analysis Dashboard: https://public.tableau.com/views/MunicipalityDashboard/Municipality?:language=en-GB&:display_count=n&:origin=viz_share_link
- GROVER Junior Data Analyst Case Study Dashboard: https://public.tableau.com/views/GROVERJuniorDataAnalystCaseStudy/GroverDataAnalystDashboard?:language=en-GB&:display_count=n&:origin=viz_share_link
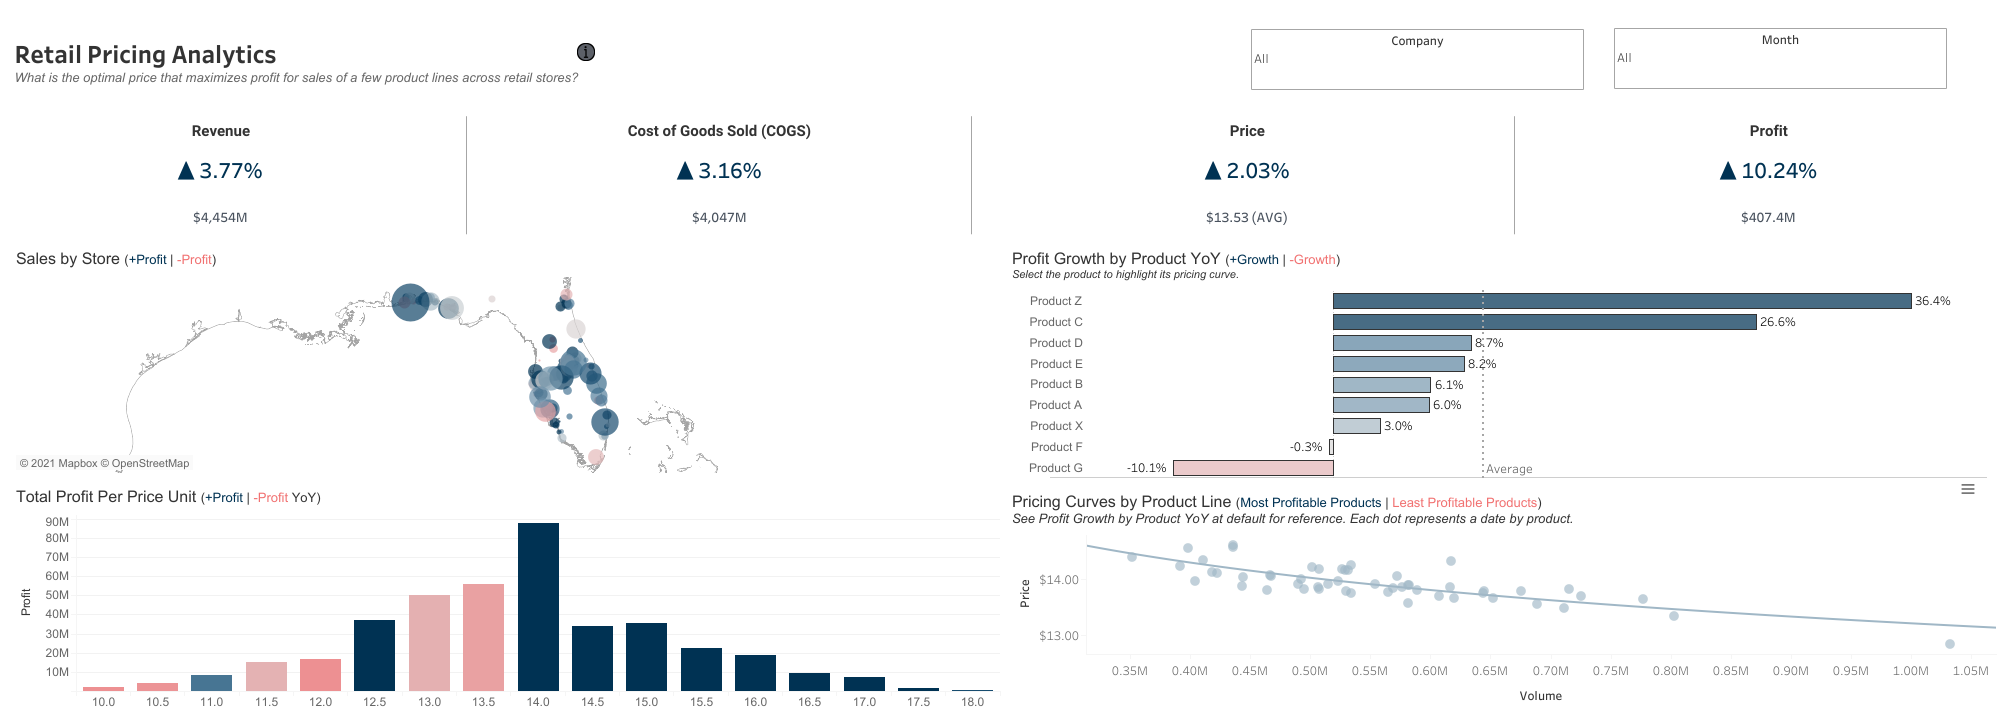
- Retail Pricing Analytics Dashboard: https://public.tableau.com/app/profile/priyankajhatheanalyst/viz/RetailPriceAnalyticsDashboard/RetailPricingAnalytics#2
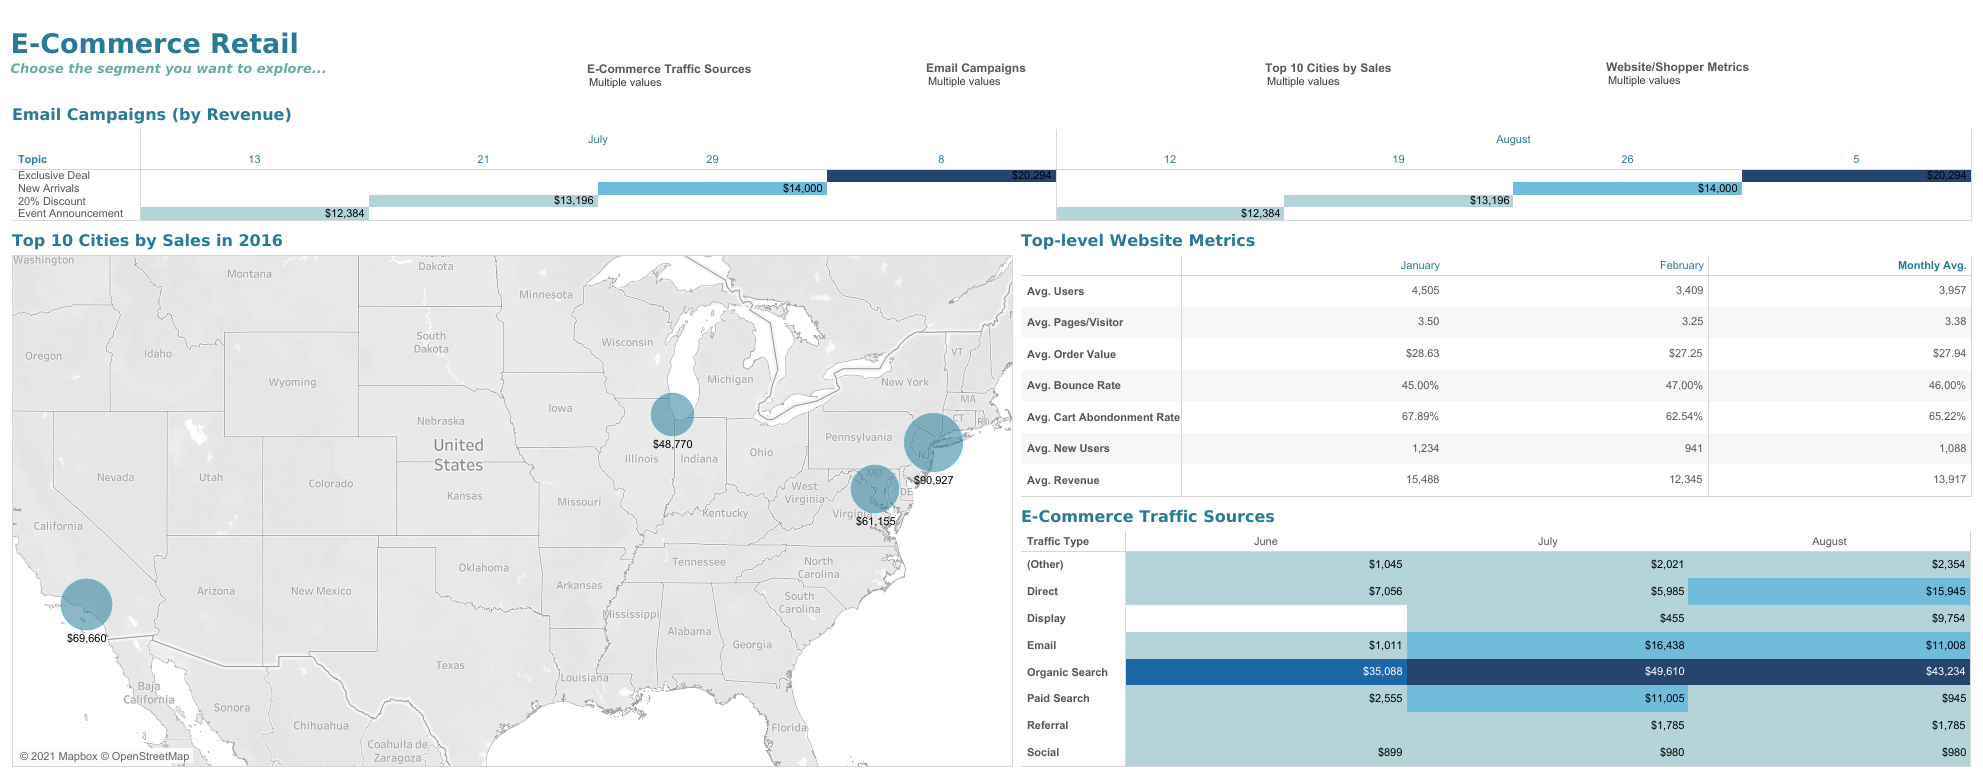
- E-commerce Sales Dashboard: https://public.tableau.com/app/profile/priyankajhatheanalyst/viz/eCommerceSales_16310934566250/ExploratoryVisualAnalysis
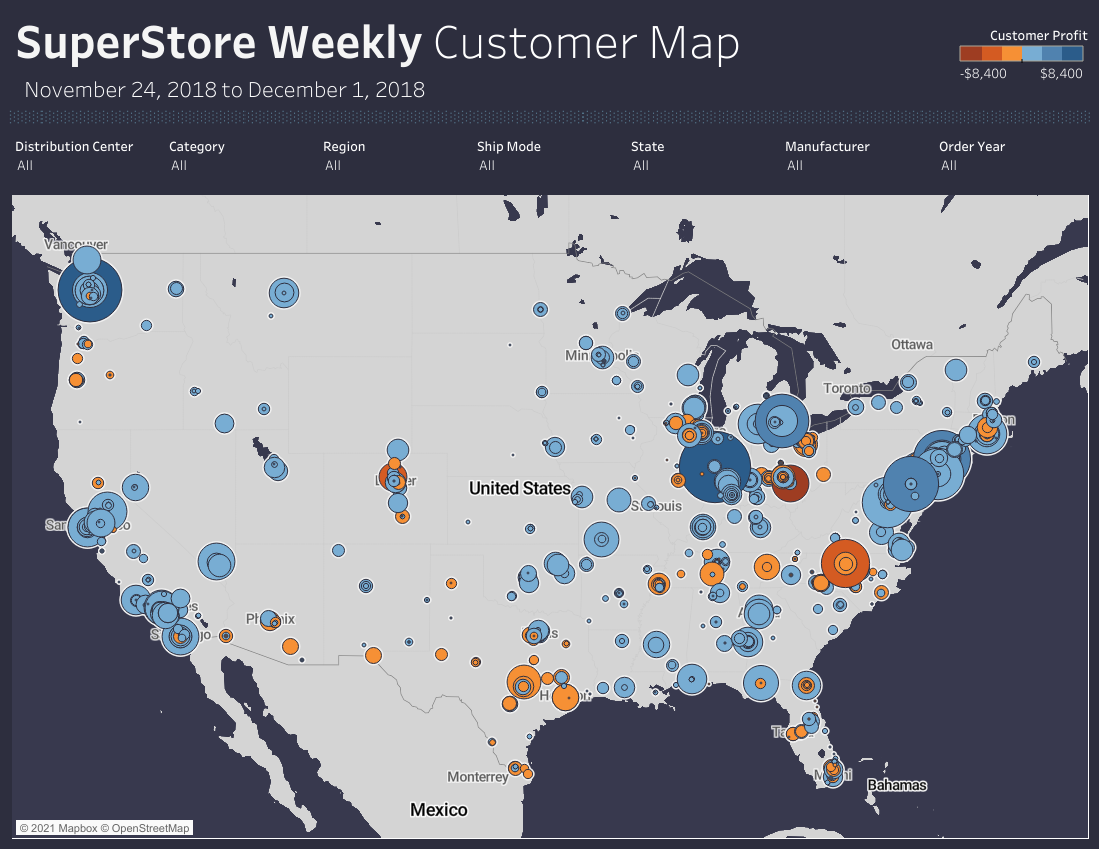
Sales SuperStore Deep Data Analysis (5 Dashboards): https://public.tableau.com/app/profile/priyankajhatheanalyst/viz/SuperStoreDataset5Dashboards/1KPIDashboard
1 KPI Dashboard
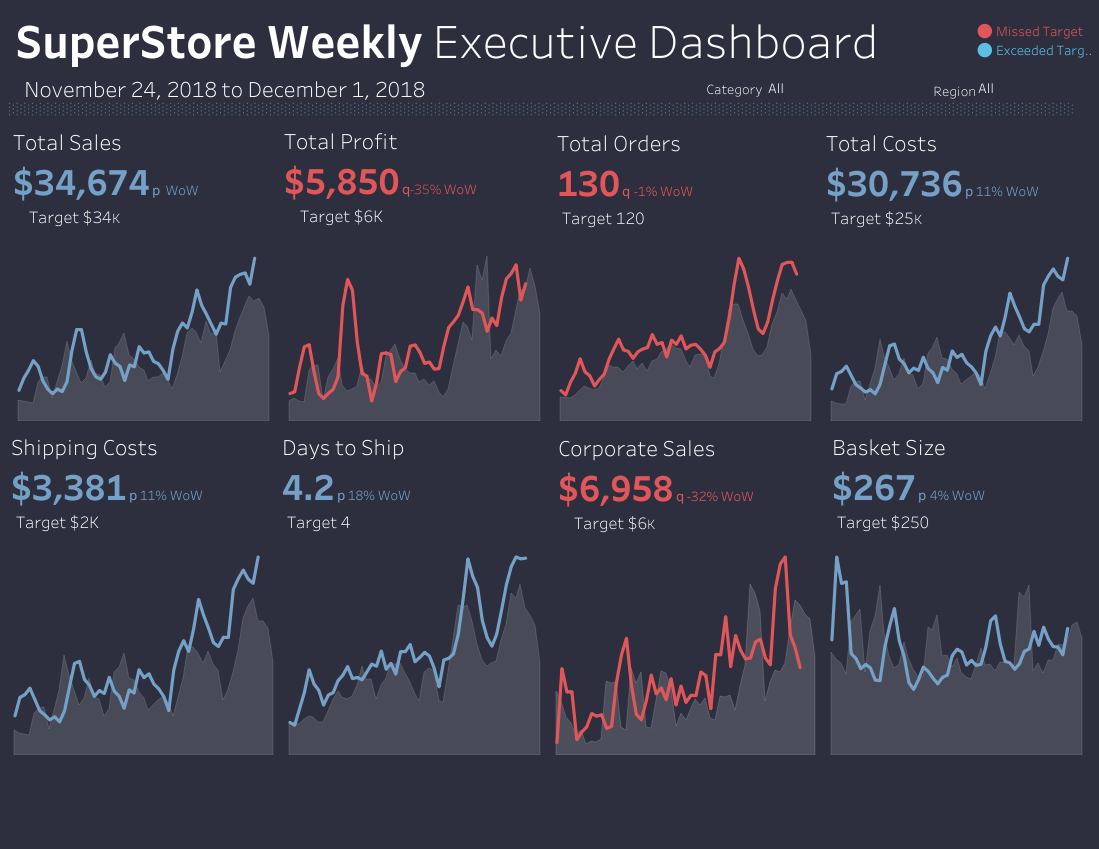
2 Top-Down Dashboard
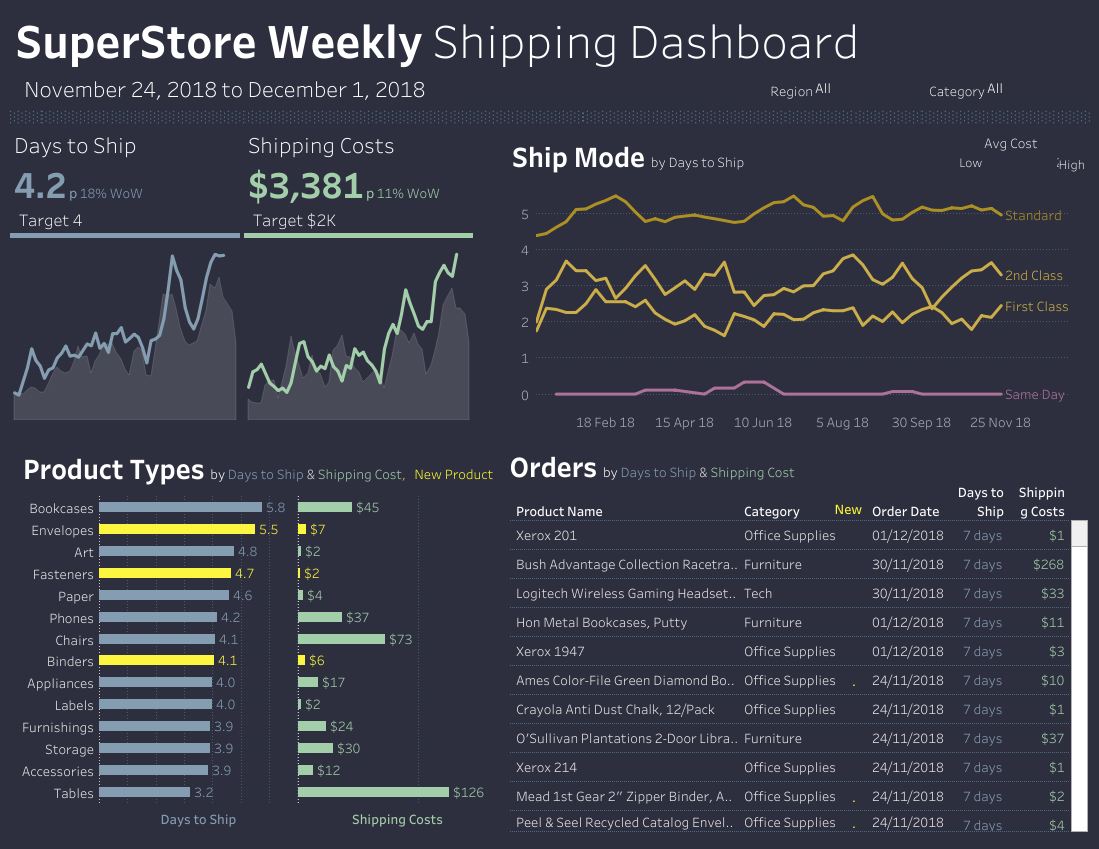
3 Q&A Dashboard
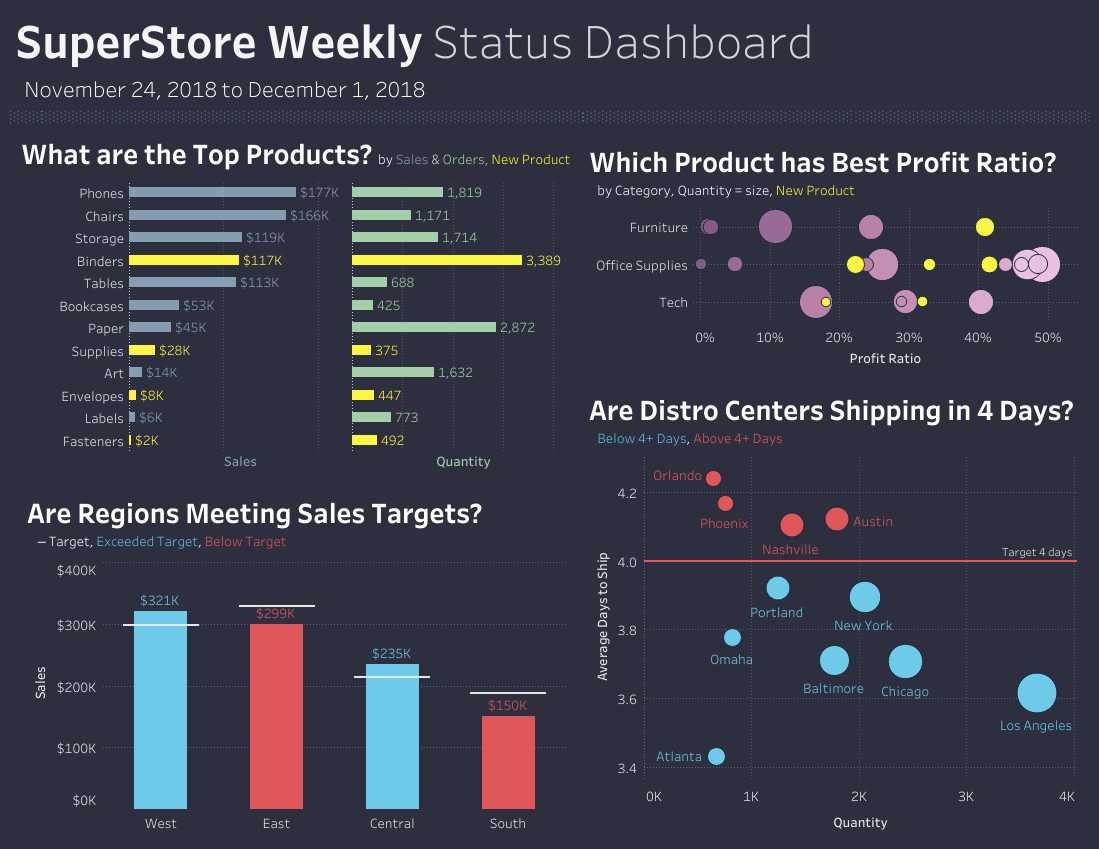
4 Bottom-Up Dashboard
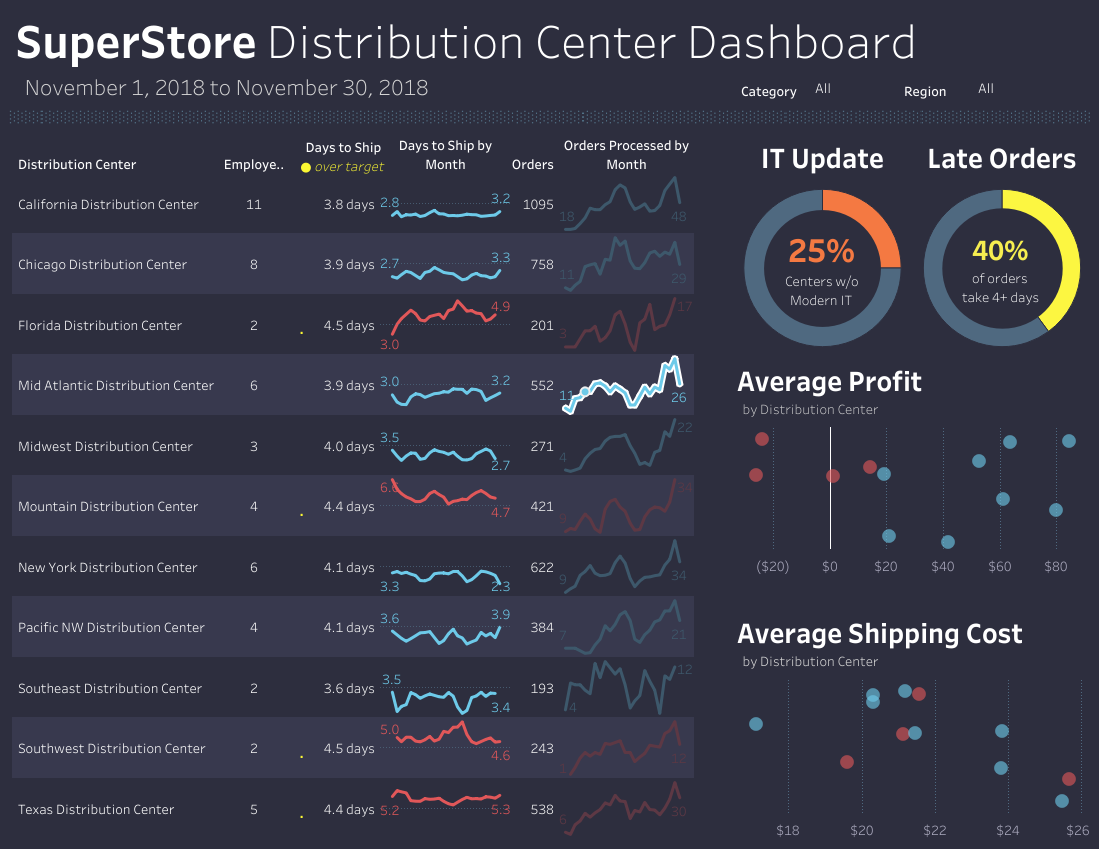
5 Geo Chart
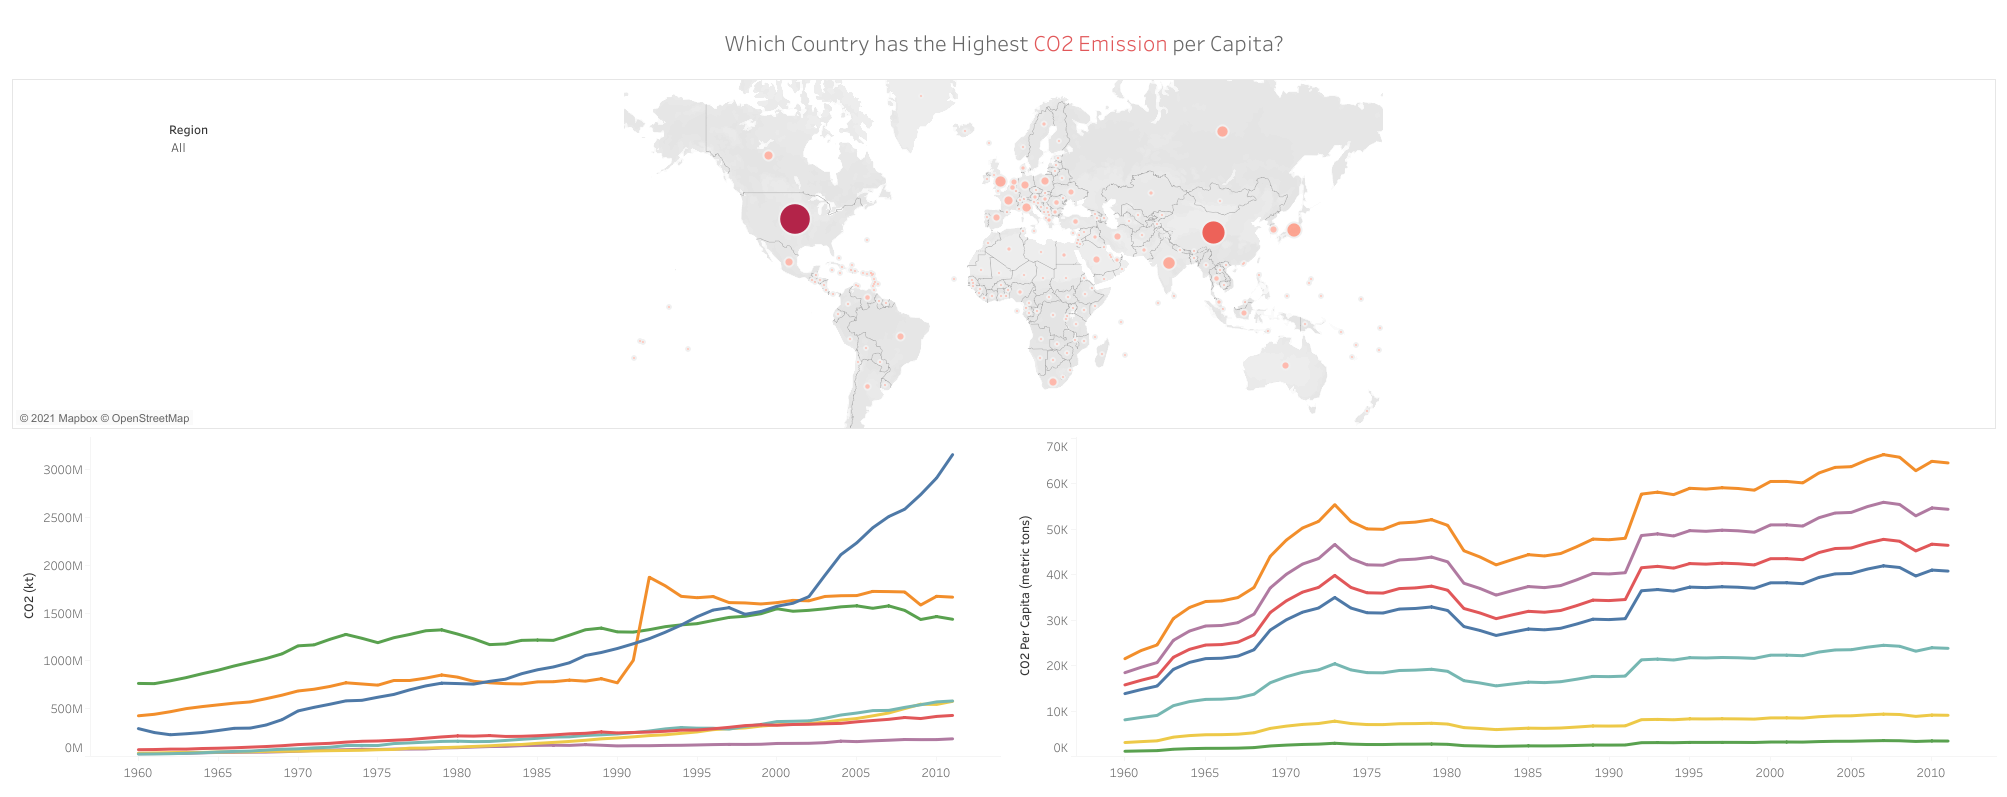
- World Bank CO2 Emissions Dashboard: https://public.tableau.com/views/WorldBankCo2Emissions_16149182681650/Dashboard1?:language=en-GB&:display_count=n&:origin=viz_share_link
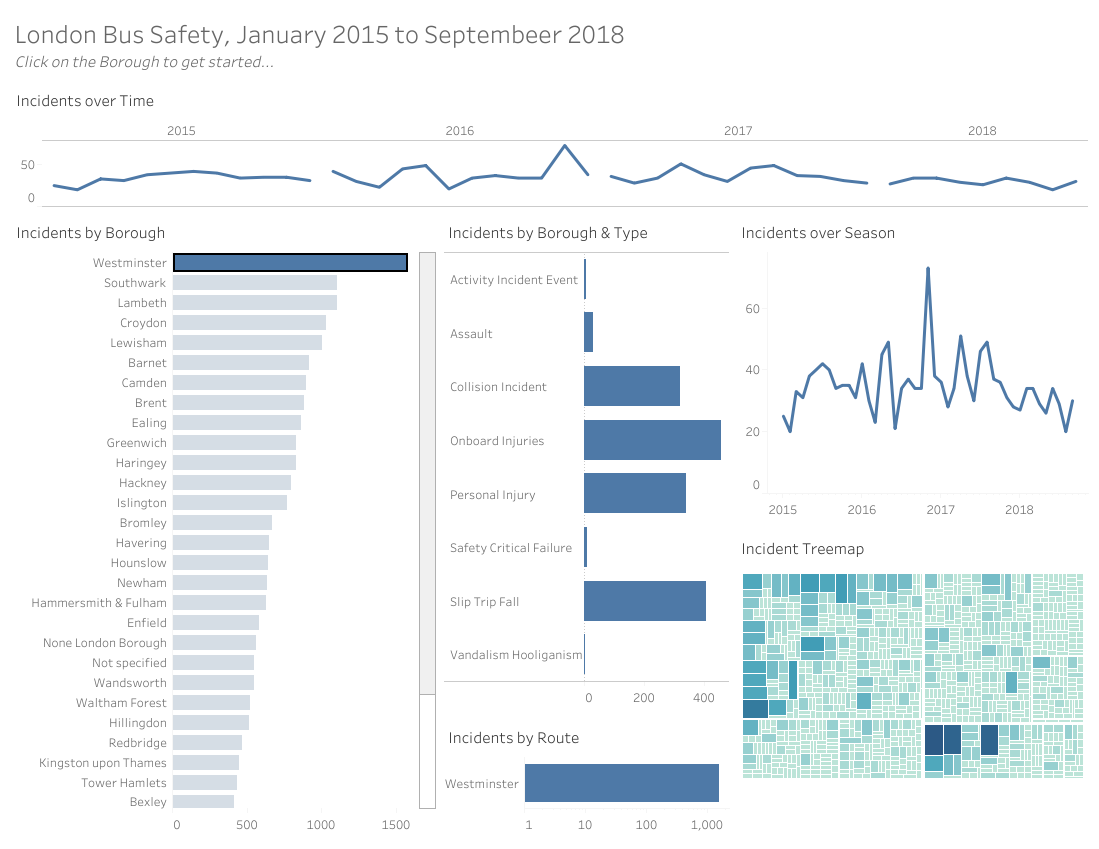
- London Bus Safety Dashboard: https://public.tableau.com/views/TableauCertificationCourse2/ChartsDashboard?:language=en-GB&:display_count=n&:origin=viz_share_link
- Excel -
Kindly download these Excel files from this repository and view them in Microsoft Excel.
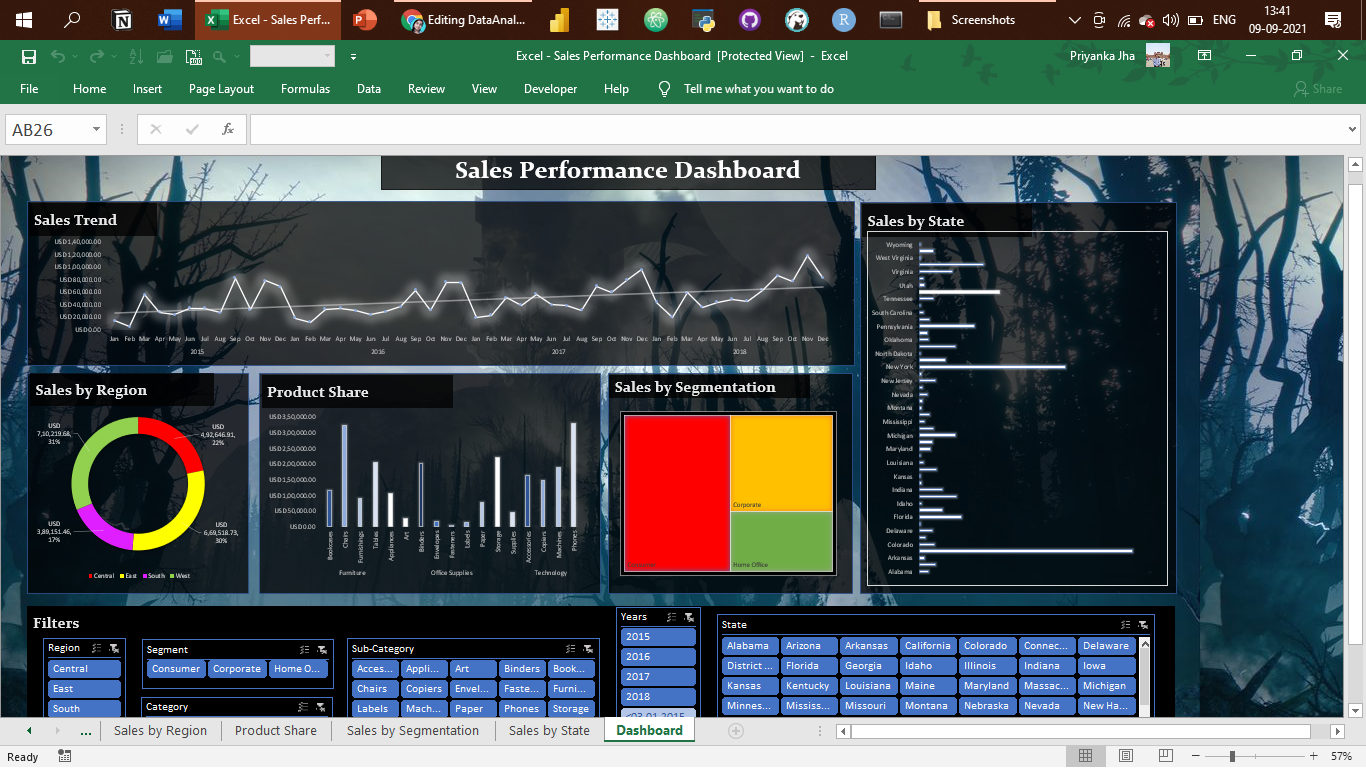
- Sales Superstore Sample: Sales Performance Dashboard
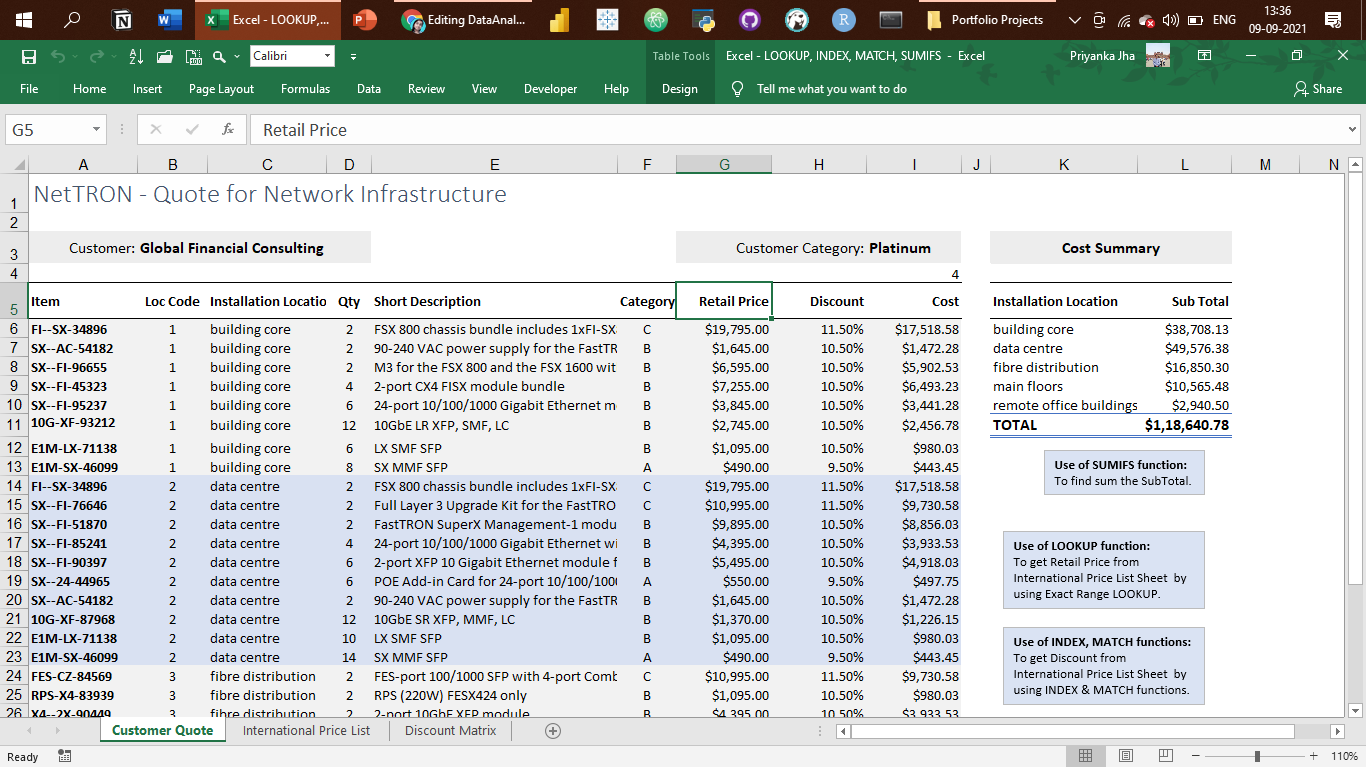
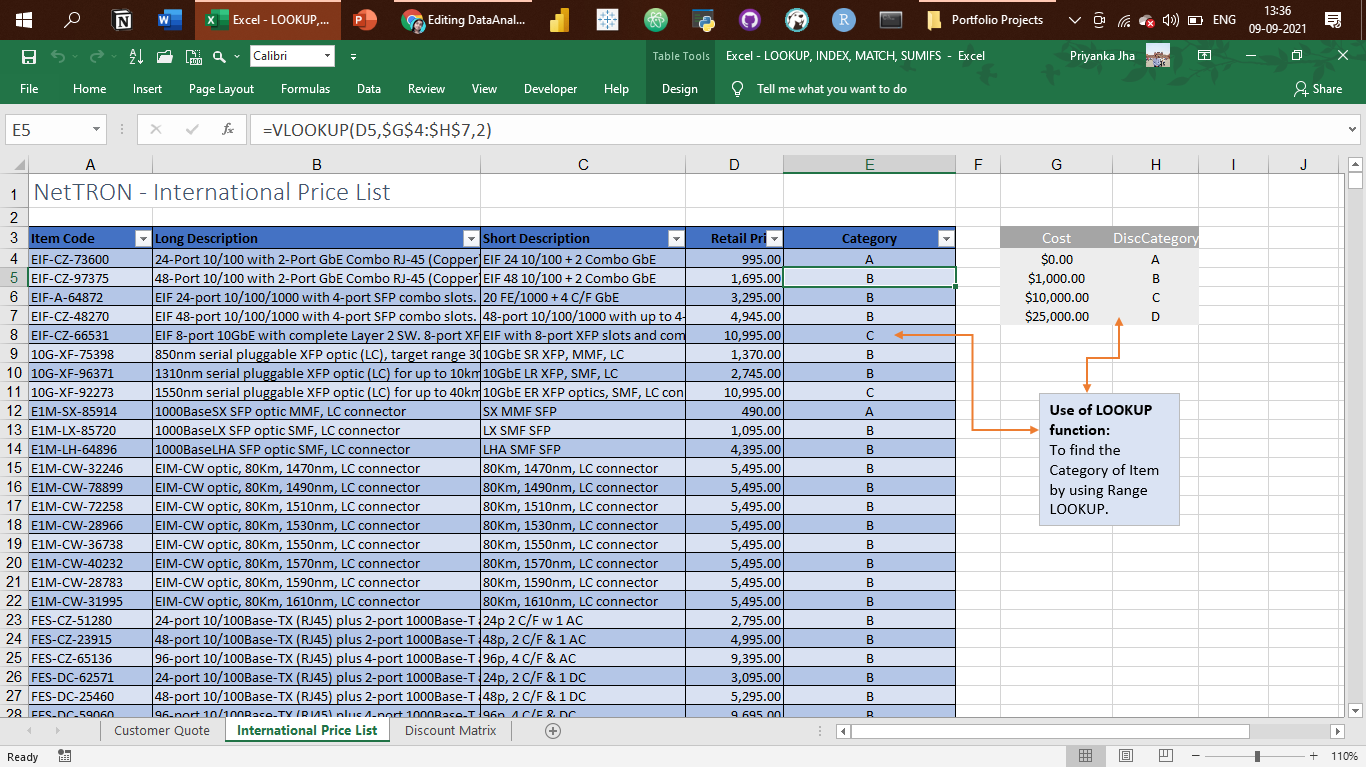
- NetTRON Network Infrastructure Data : LOOKUP, INDEX, MATCH, SUMIFS
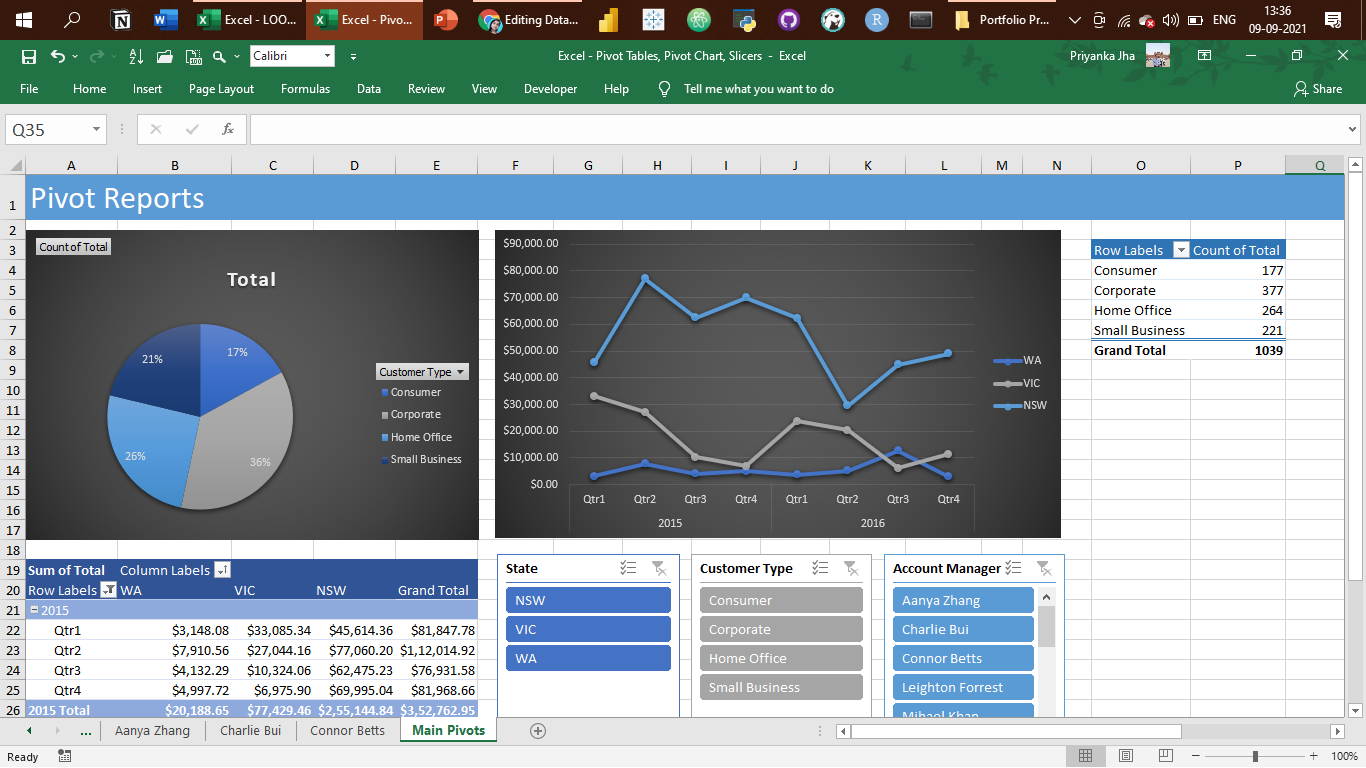
- Shipping Data: Pivot Tables, Pivot Chart, Slicers
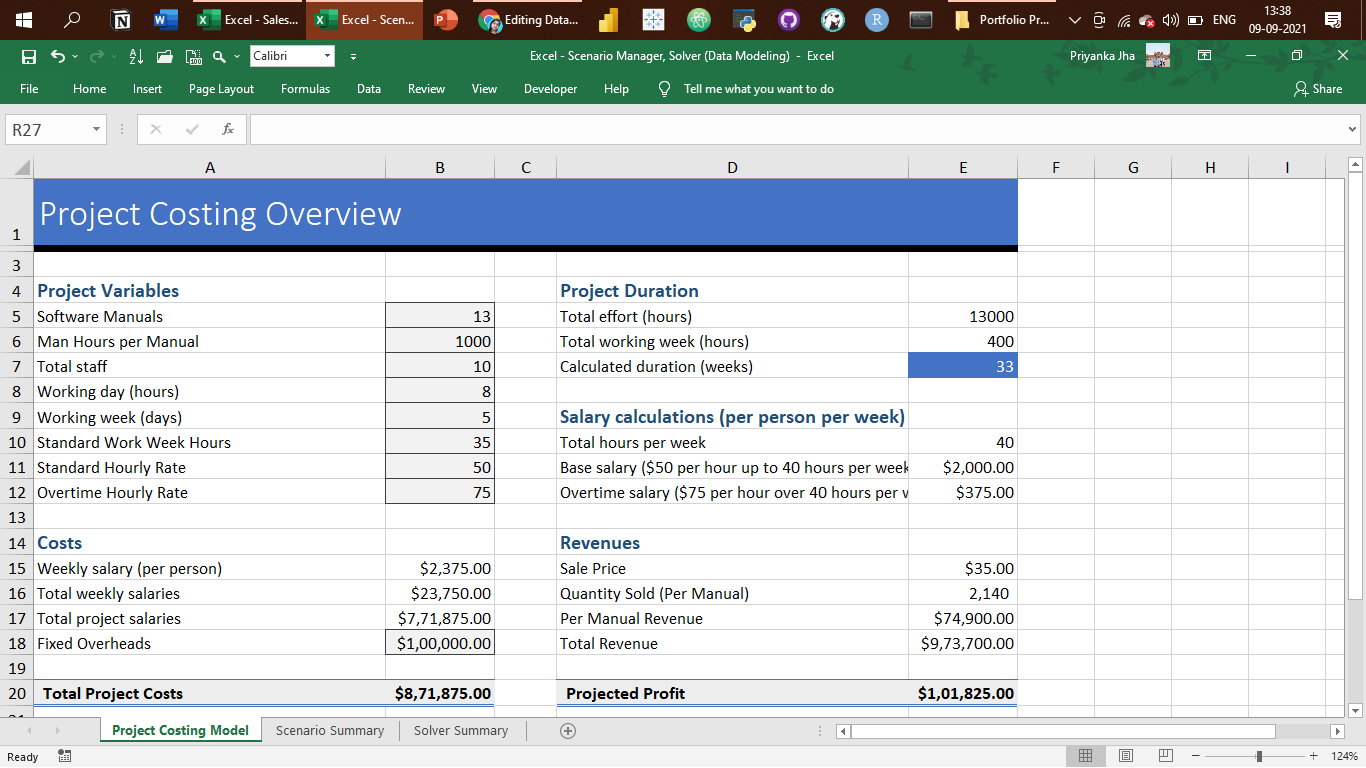
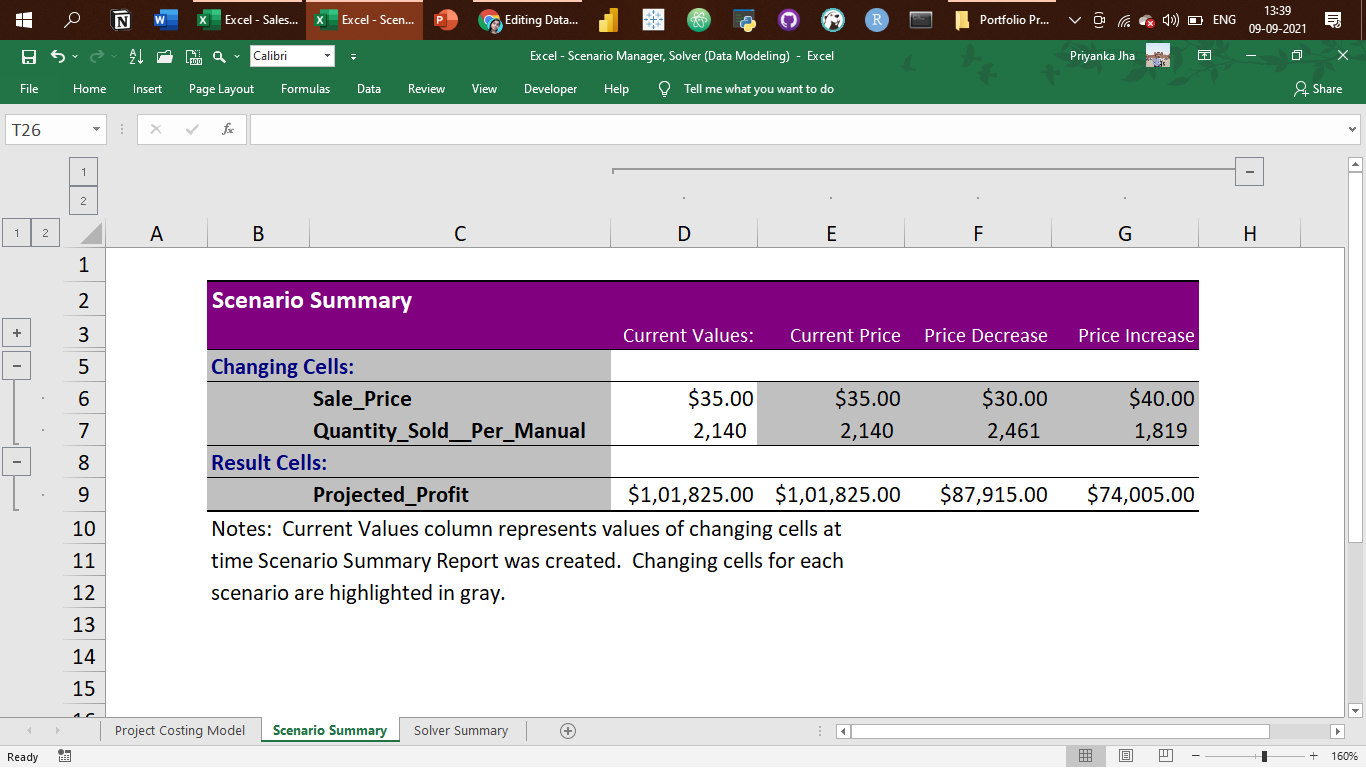
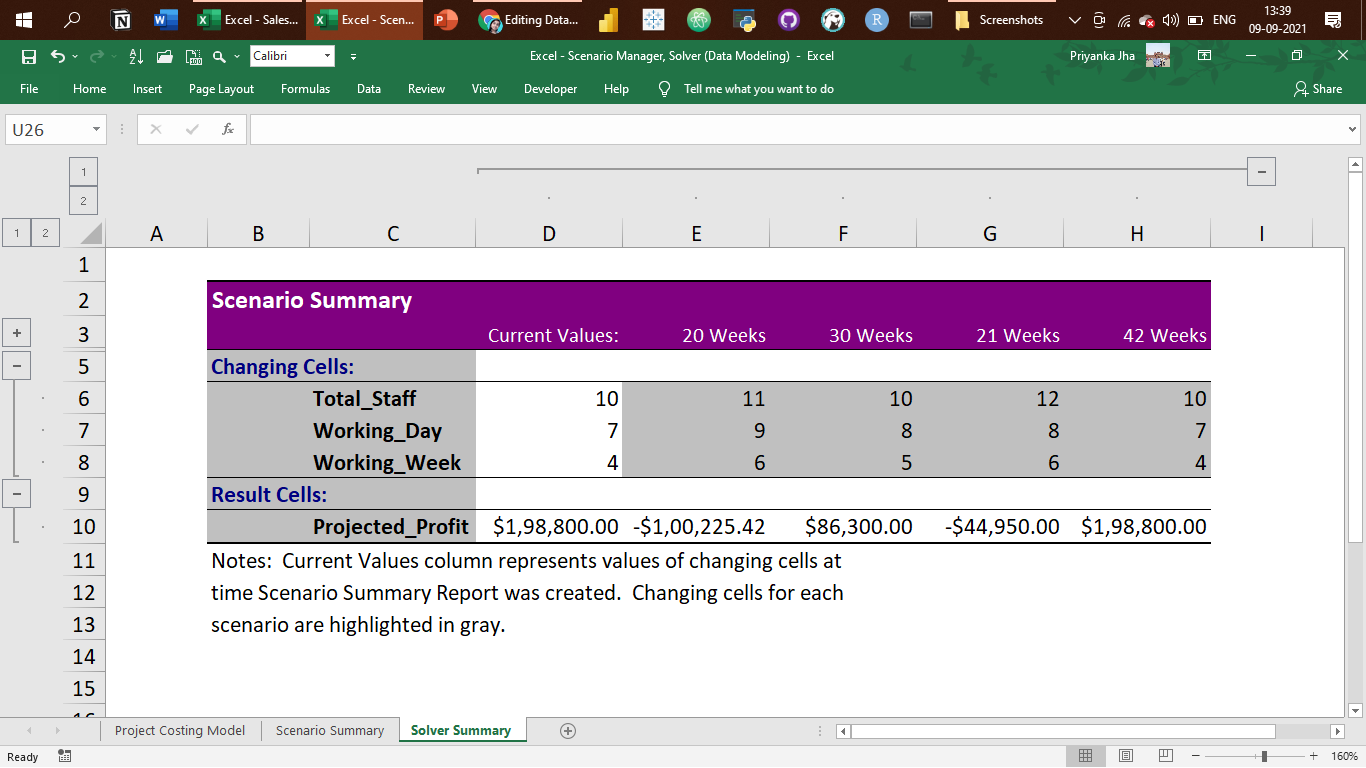
- Project Costing Model Data: Scenario Manager, Solver (Data Modeling)
Explore related projects
Asabeneh/30-Days-Of-Python
The 30 Days of Python programming challenge is a step-by-step guide to learn the Python programming language in 30 days. This challenge may take more than 100 days. Follow your own pace. These videos may help too: https://www.youtube.com/channel/UC7PNRuno1rzYPb1xLa4yktw
78,423 starsgrafana/grafana
The open and composable observability and data visualization platform. Visualize metrics, logs, and traces from multiple sources like Prometheus, Loki, Elasticsearch, InfluxDB, Postgres and many more.
77,790 starsredis/redis
For developers, who are building real-time data-driven applications, Redis is the preferred, fastest, and most feature-rich cache, data structure server, and document and vector query engine.
77,309 starsapache/superset
Apache Superset is a Data Visualization and Data Exploration Platform
75,455 stars