
NetworkBound/homelab-galaxy-dashboard
NetworkBound/homelab-galaxy-dashboard has 29 GitHub stars and 2 forks. GitHot measured 0 stars in 24 hours, +1 in 7 days, and +3 in 15 days. Last checked 2026-11-21 20:09 UTC. Last push 2026-11-12.
Measured star growth
- in 24h
- 0
- in 7 days
- +1
- in 15 days
- +3
- in 1 month
- Collecting history
Net star changes over overlapping periods, not daily totals. Missing measurements are left blank. Stars measure attention, not software quality.
About
A 3D monitoring console for Proxmox. Each node renders as a galaxy and each guest as a planet, driven by live Proxmox, Zabbix and UniFi data.
Self-hostedREADME.md
OriginalHomelab Galaxy Dashboard
A cinematic 3D monitoring console for a Proxmox homelab, built for a wall display.
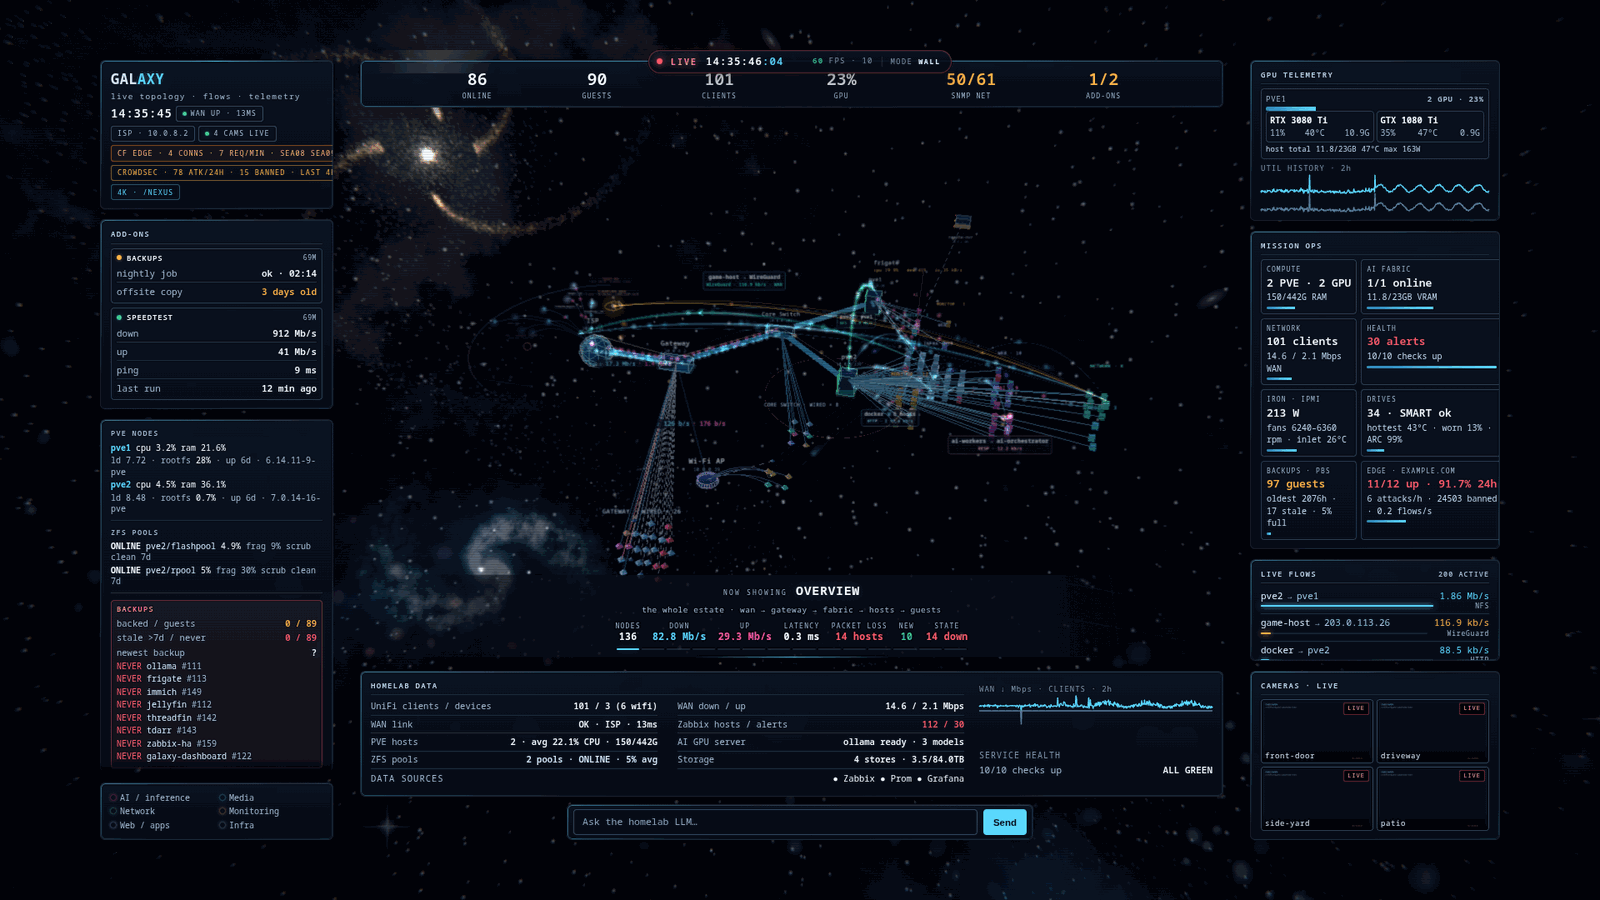
Each Proxmox node becomes a spiral galaxy. Every VM and container is a star in its node's galaxy — coloured by what it does, sized by its RAM, dimmed when stopped, flared when Zabbix has a problem against it. Your gateway, switch and access point are planets with client moons. The internet edge is a sun, and beyond it sits the edge galaxy: the outside world, where blocked intrusions streak in and real visitors arrive as comets.
Nothing in the view is decorative-only. If a star is red, that guest is actually stopped. If the room goes red, something actually attacked you.
git clone https://github.com/NetworkBound/homelab-galaxy-dashboard.git
cd homelab-galaxy-dashboard
python3 -m venv .venv && . .venv/bin/activate
pip install -r requirements.txt
DEMO=1 python3 app.py      # → http://localhost:8080  (no configuration, no network)
It binds 0.0.0.0, so that is also http://<this machine>:8080 from anywhere
on your network. In demo mode there is nothing real behind it; with your own
cluster configured there very much is, so see
Security notes before you leave it that way. LISTEN_HOST=127.0.0.1
keeps it to this machine.
That is the whole demo. It runs on anonymised fixture data, so you can see every layer — galaxies, the fabric, threats, viewers, the 4K view — before you give it a single credential.
Two screens, one universe
| Route | Built for | What it is |
|---|---|---|
/ |
a 1080p monitor at your desk | The wall. Dense console: the network graph with measured throughput on every link, live panels, an auto-tour that flies between the WAN edge, the switch fabric, the access point and each node's categories. |
/nexus |
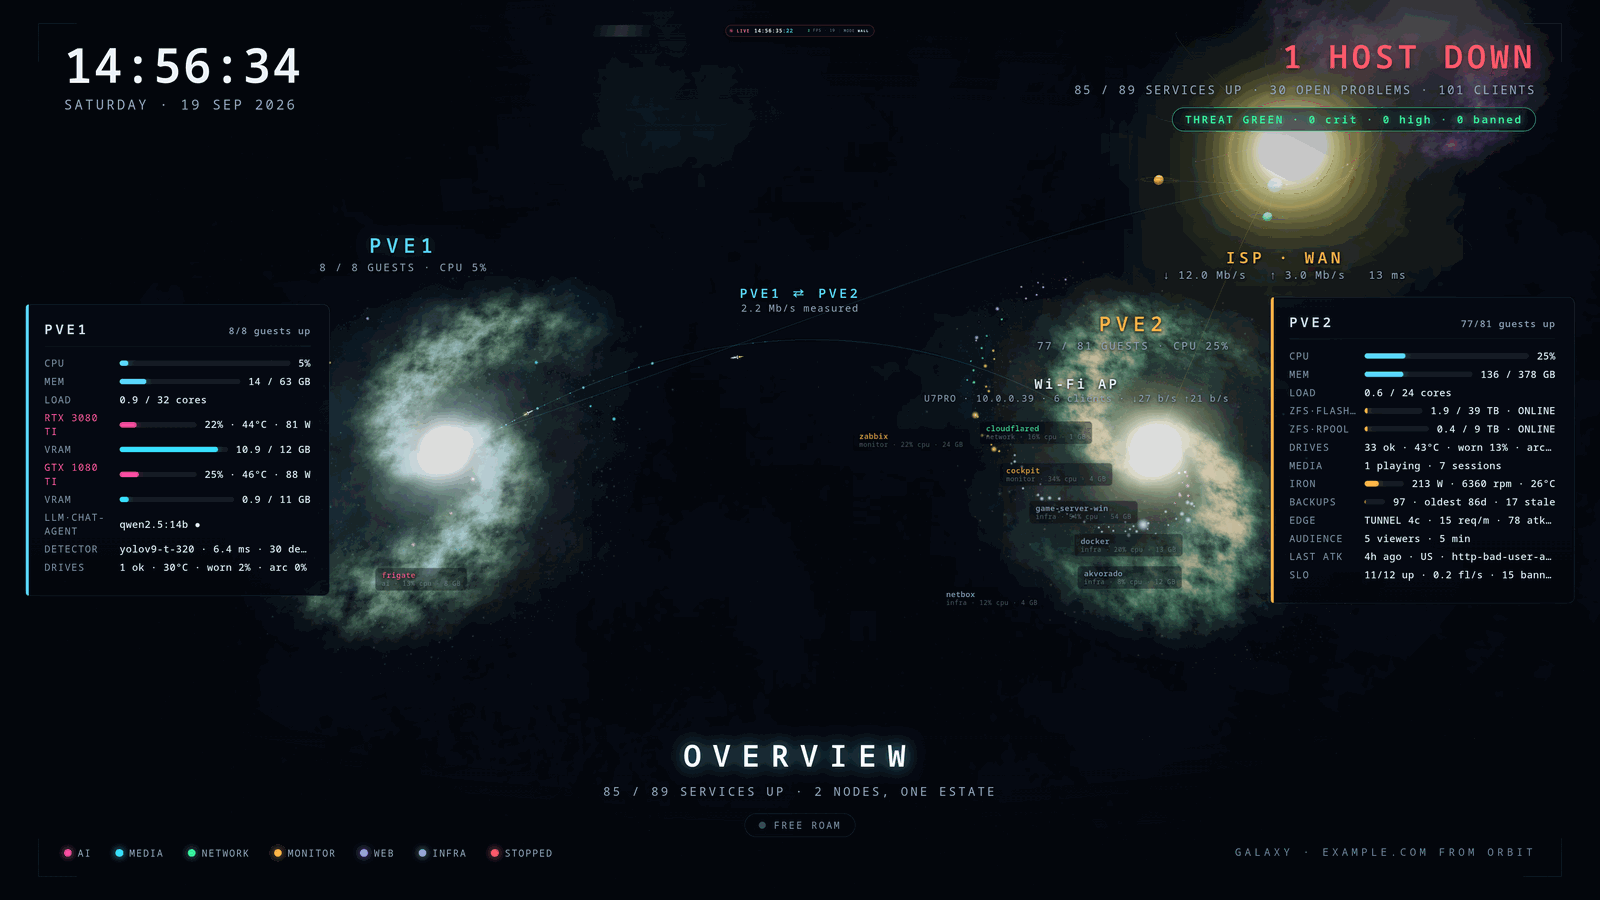
a 4K TV across the room | Nexus. The estate from orbit: galaxies, the solar-system fabric, the edge galaxy, rockets ferrying measured traffic. Reads from across a room and on camera. |
/desk |
a spare panel | The older flat HUD view, kept working. |
Run both at once and they stay in lockstep: the wall publishes its tour position
and Nexus follows it, naming the same subject at the same moment. Point two
kiosk browsers at them (see deploy/kiosk/) and you have a
two-screen NOC wall.
Any number of nodes
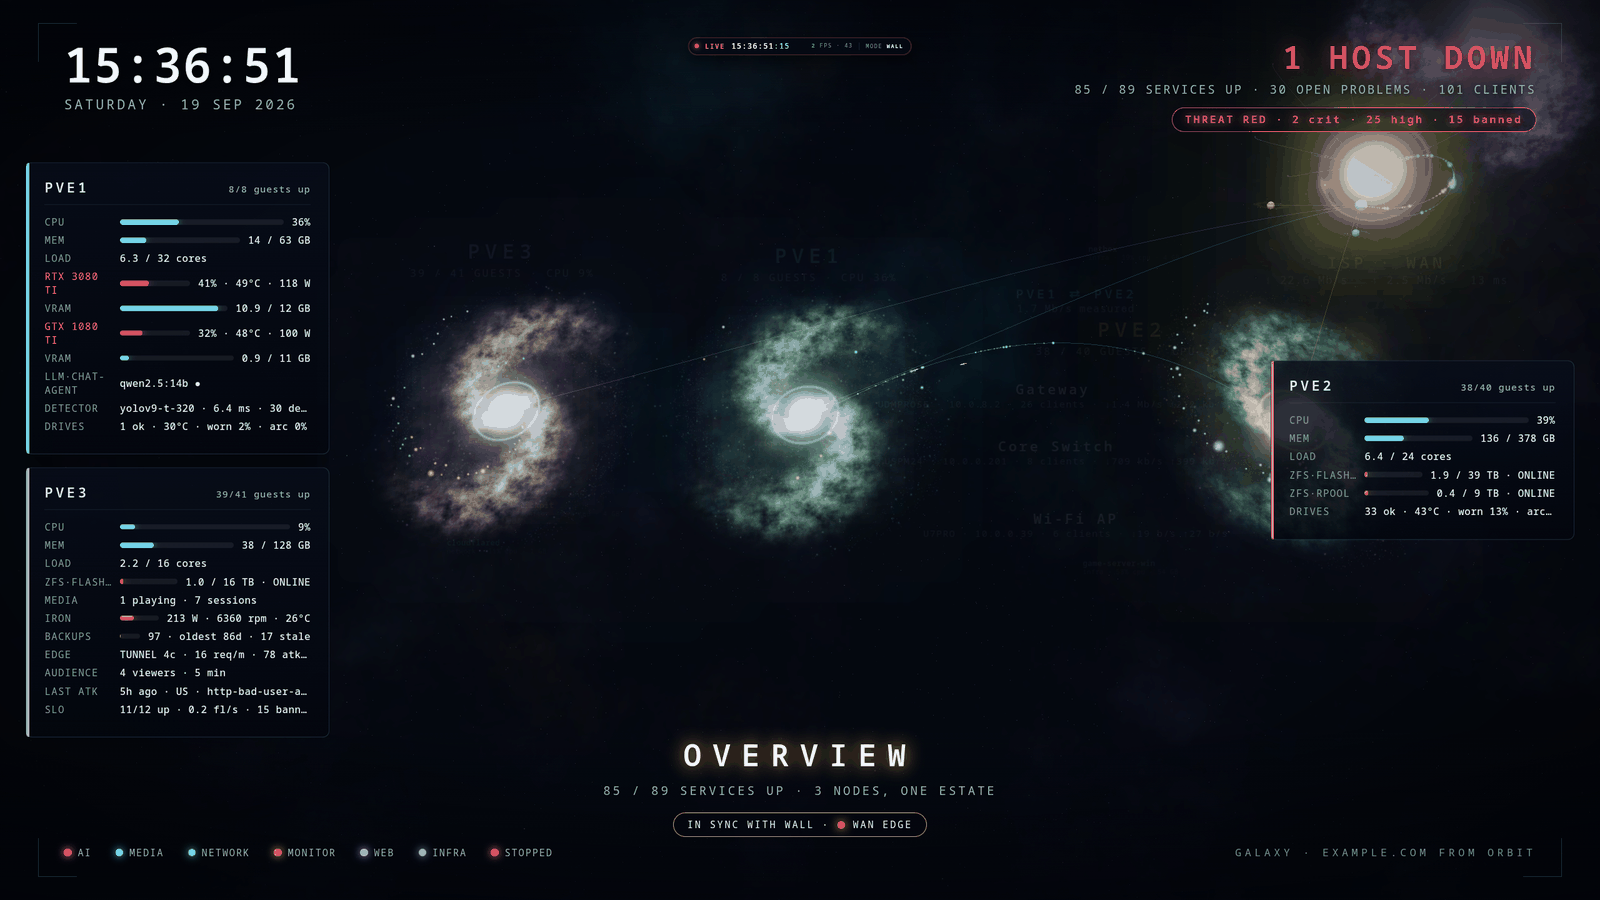
The scene is built from whatever /api/config reports, so one node or six all
work — galaxies are laid out along an arc, each with its own accent colour, its
own card, and its own stars. Nothing about "two nodes" is baked in.
Try it yourself without touching your cluster — demo mode reads its fixtures from a directory you can point anywhere:
DEMO=1 DEMO_FIXTURES=/path/to/your/fixtures python3 app.py
Set it up in a browser
No YAML archaeology required. Start it with nothing configured:
python3 app.py
# [setup] token: ...        ← printed once, also saved next to config.json
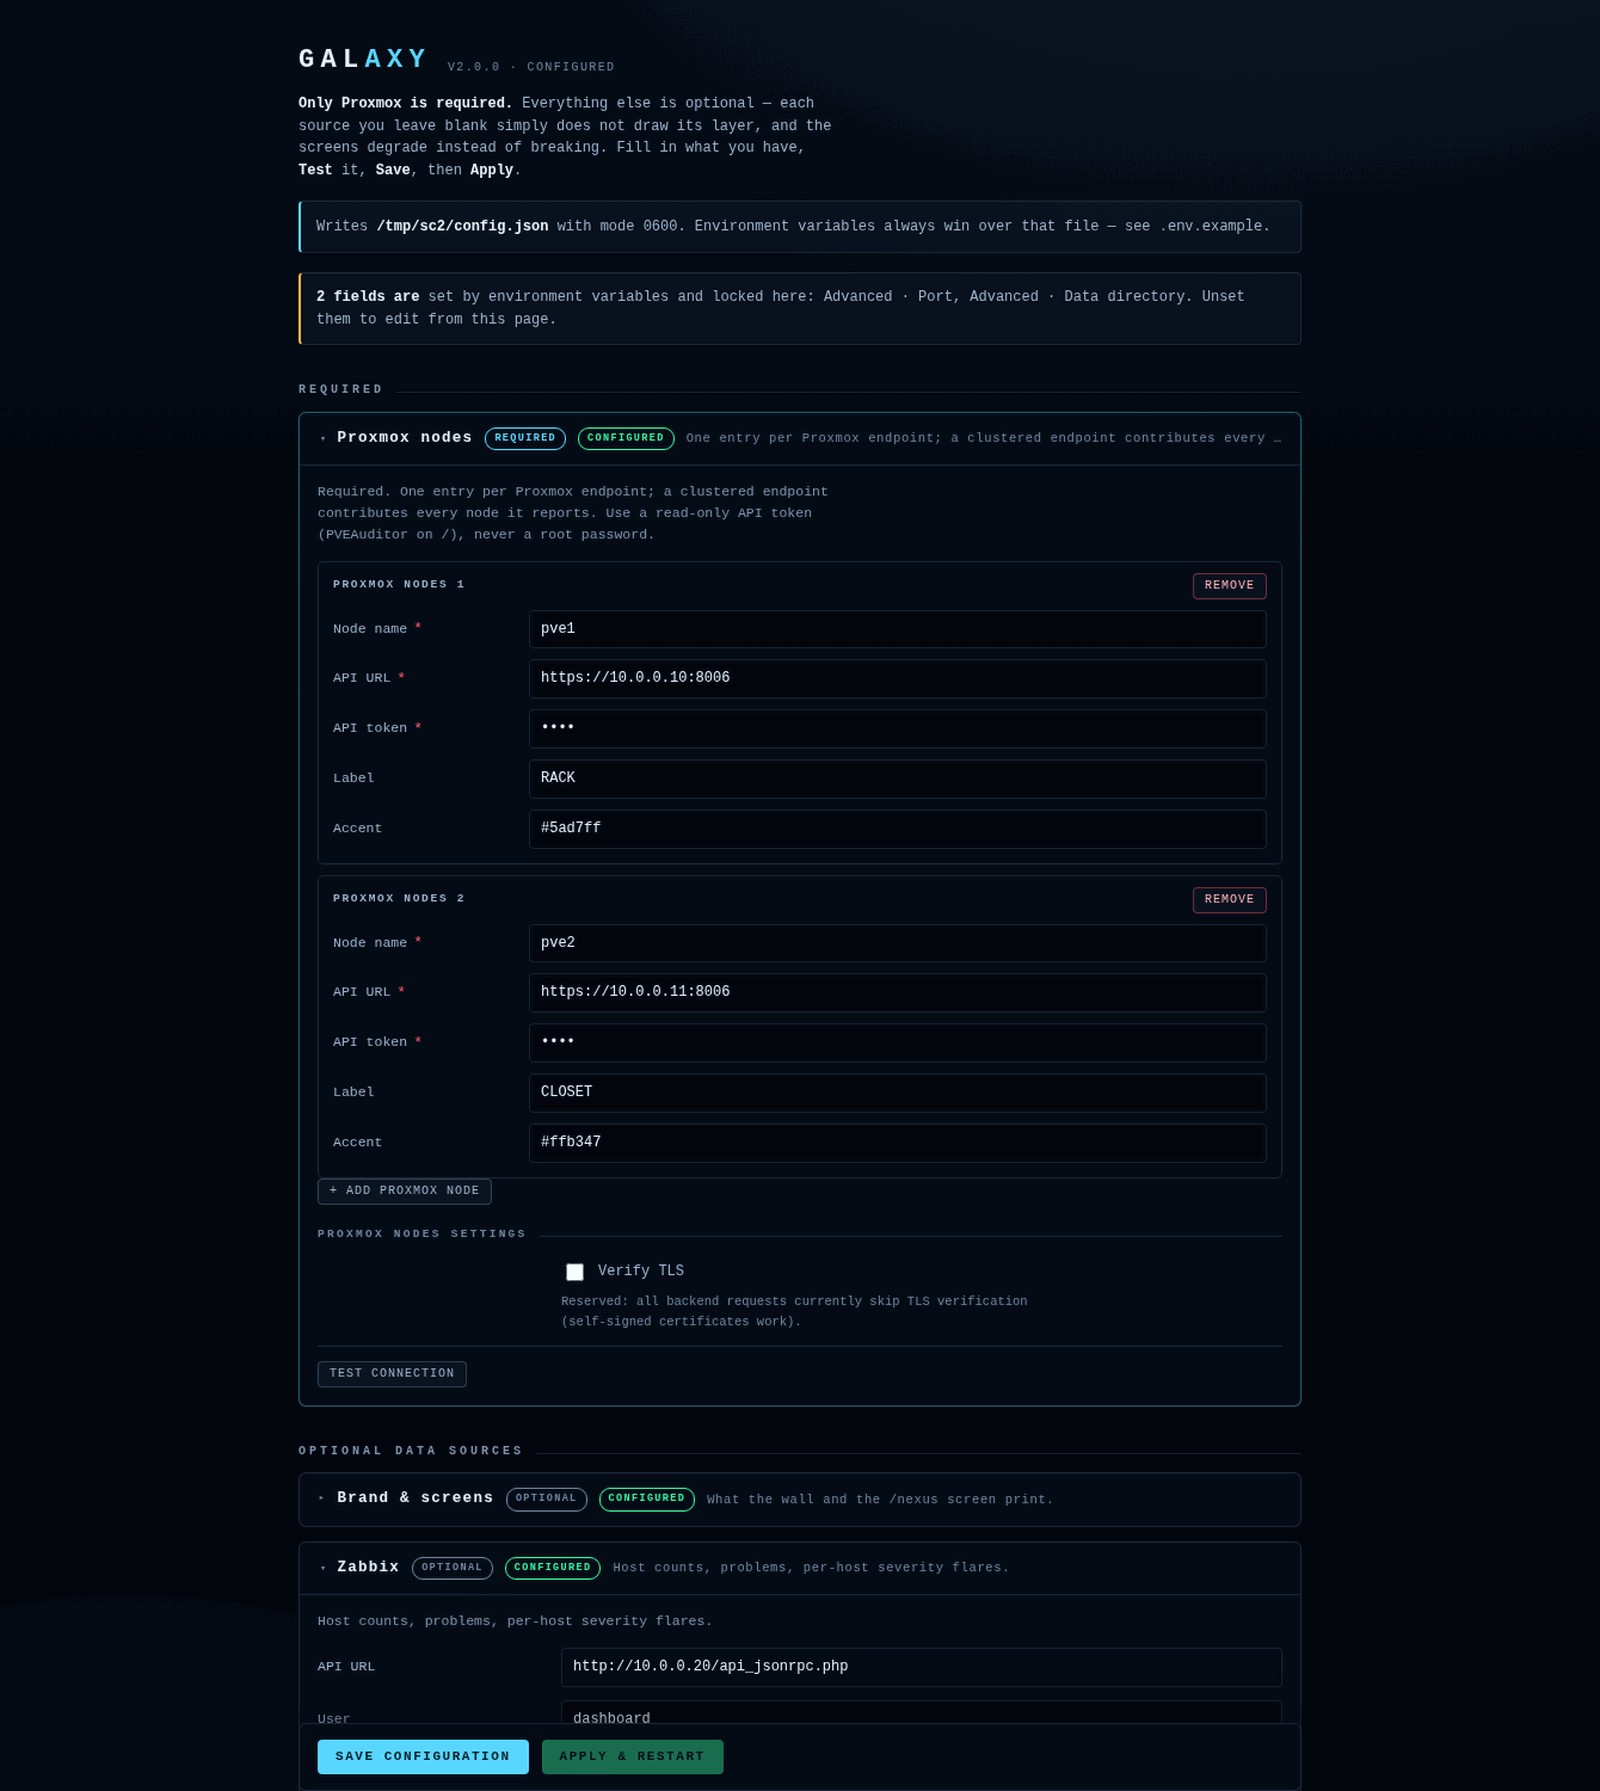
It starts anyway and redirects you to /setup: a wizard that walks every
data source, explains what each one adds, and has a Test button per section
that actually tries the connection and tells you what it found
(Zabbix 7.0.4 · 76 hosts) before you save. Save, Apply, and it restarts itself
with the new configuration.
Prefer files? Everything the wizard writes is plain config.json, and every
setting also has an environment variable that overrides it — see
.env.example and docs/configuration.md.
The layering is: environment > config.json > defaults.
What you need
- Python 3.10+
- A Proxmox VE node or cluster (8.x / 9.x) with a read-only API token
- A browser with WebGL2 for the 3D view (anything else falls back to flat panels)
That is the whole requirement list. Everything else is optional, and each optional backend only costs you its own layer if you skip it.
Create the Proxmox token on any node, as root:
pveum user add dashboard@pve
pveum aclmod / --users dashboard@pve --roles PVEAuditor
pveum user token add dashboard@pve readonly --privsep 0
Give the dashboard the single string dashboard@pve!readonly=<the-uuid-it-printed>.
PVEAuditor is read-only and this app issues no writes, so that token cannot
change your cluster.
What each optional backend adds
| Backend | You get |
|---|---|
| Zabbix | Problem flares on the right star, the alert panel, host/problem counts |
| UniFi | Clients, WAN throughput, and the real physical topology: gateway, switches, APs, per-client attachment |
| Frigate | Camera satellites with live frames, detector stats |
| Emby / Jellyfin | Now-playing and session counts |
| Ollama | Per-instance loaded models and VRAM, plus the in-scene chat box |
| Prometheus | Hypervisor temperatures, fan speeds, drive health, whatever you scrape |
| ntopng | Host-to-host flow arcs with measured bandwidth and protocol |
| Any managed switch or router (SNMP) | Real infrastructure nodes for non-UniFi gear: per-port state and measured throughput, LLDP/CDP links, merged onto what the map already knows. No NMS needed |
| LibreNMS (or any SNMP topology JSON) | Devices that no controller knows about |
| Akvorado | External flows by country and autonomous system — the exosphere |
| cloudflared | Tunnel health, request rate, edge locations |
| CrowdSec | Blocked intrusions: country, AS, scenario — the red streaks |
| A security monitor | Findings mapped onto the affected host |
| Cloudflare analytics or an origin log | Real unique viewers, by country |
| NVIDIA GPUs | Utilisation, memory, temperature, power, per card and remote |
| Home Assistant | Presence gating: the screens stop rendering when the room is empty |
| Govee / Hue | The room lights follow the tour and flash red on an intrusion |
See docs/data-sources.md for exactly what is polled
and which credentials each one needs.
Add-ons
Anything else you want on the wall goes in addons/ as a small
Python file:
TITLE = "Backups"
INTERVAL = 600

def poll(config):
    return {"status": "warn",
            "rows": [{"k": "nightly job", "v": "ok · 02:14"},
                     {"k": "offsite copy", "v": "3 days old", "cls": "warn"}]}
It appears in the ADD-ONS panel on the next poll. Exceptions are contained: a
broken add-on shows as down with its error and never touches the others. Two
working examples ship in the directory — a speed test and a generic
"fetch a URL, show these JSON keys" panel.
Threats and viewers
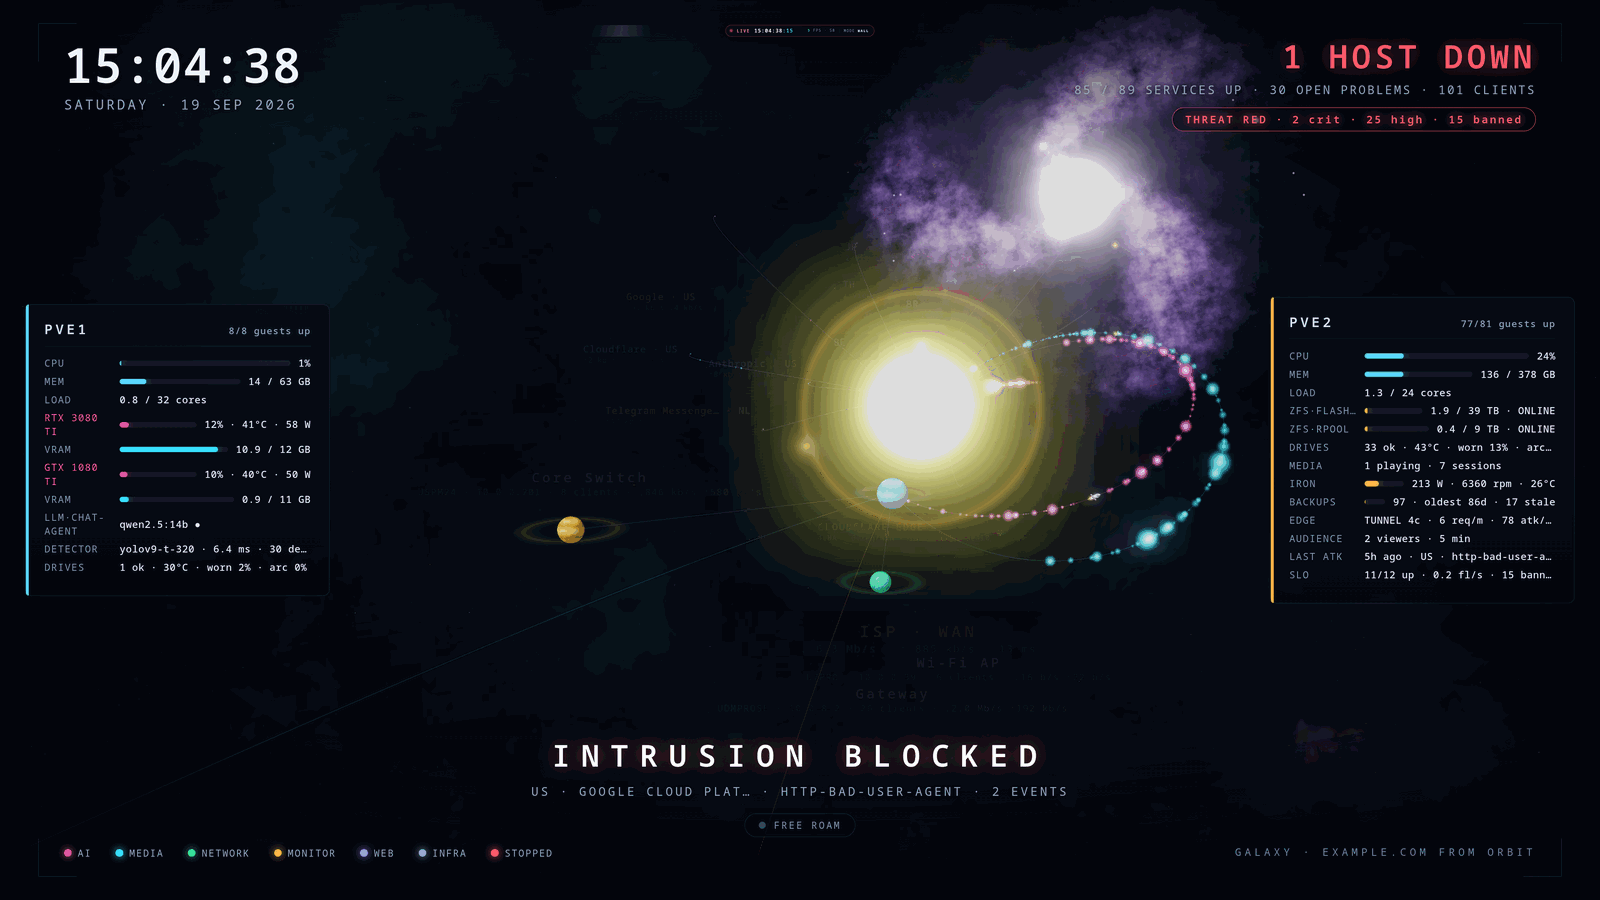
Two feeds make the outside world visible:
- Threats merge CrowdSec decisions and security-monitor findings into one
timeline with a monotonic sequence number. A new event streaks in from its
country, bursts on the edge shield, names itself
(
INTRUSION BLOCKED · US · Google Cloud · http-probing) and — if you wired the lights — pulses the room red for two seconds. - Audience counts real unique visitors, either from Cloudflare's zone
analytics (needs a token with
Zone · Analytics · Read) or, with no token at all, from your own origin access log via the exporter indeploy/edge/. Tunnel request counters are never labelled "viewers" — they are shown as in-flight requests, because that is what they are.
k3s / Kubernetes
Point the dashboard at one or more Kubernetes clusters (k3s is the usual homelab
case: K8S_CLUSTERS, a kubeconfig, or in-cluster when it runs on the cluster
itself) and each one becomes its own galaxy: the control plane as the core,
agent nodes and pods as bodies coloured by namespace, a Kubernetes stop on the
tour, and node and workload problems (not ready, crash looping, image pull
failing) in the shared problem list. Access is read-only, with a minimal RBAC
role in deploy/k3s/, which also runs the dashboard itself on
k3s. Demo mode includes a simulated four-node Raspberry Pi cluster. Details in
docs/k3s.md.
The idea of drawing a Pi cluster as part of the homelab comes from barney01's nodeyard. No code was taken from it; this is an independent implementation.
The 3D assets are generated, not downloaded
blender/galaxy_assets.py is a headless Blender
script that bakes everything the scene uses — the nebula sky, the spiral galaxy
discs, the planet and star surfaces, and the rocket mesh — procedurally:
blender -b --python blender/galaxy_assets.py -- --out static/assets
The baked results are committed, so you never need Blender unless you want to restyle it. Change the palette arguments and re-run to make it yours.
The photographic look comes from three more committed sets, each with a
manifest.json that documents its conventions: static/assets/galaxy2/ (galaxy
plates rendered from a physical model and processed like astrophotographs, a
deep-sky sphere and background galaxies, clusters and nebulae for wide shots),
static/assets/celestial/ (planet, moon and star surfaces, rings and glows that
every device is drawn as) and static/assets/universe/ (birth and flow sprites
and the discs of the home and site systems). Galaxy plates are assigned by node
order: the first node gets the blue-white spiral, the second the golden one, and
further nodes alternate two more.
Deploying
sudo ./deploy/install.sh
Installs to /opt/homelab-galaxy-dashboard with a service account, a virtualenv
and a root-owned config directory the wizard can write to, then tells you the
setup token and the URL. Also in deploy/:
kiosk/— a loop-guarded Chromium kiosk, including a dual-screen X configuration (one X server, two screens: wall on one GPU, TV on the other) and an EDID-recovery unit for displays that come up in the wrong mode after a cold boot.lights/— the room-light driver (Govee over LAN UDP, Hue over the bridge). It follows the tour colour, dips in transit, punches on arrival and flashes red on a threat.edge/— the nginx log format and exporters that turn your own access log into real viewer counts and CrowdSec decisions into the threat feed.homeassistant/— a presence package so the screens idle when the room is empty, and wake when you walk in.
HTTP API
The front end is just a client of a small JSON API; drive your own view from it.
| Endpoint | Returns |
|---|---|
GET /api/config |
Who this instance is: brand, nodes, palette, enabled features, add-on ids |
GET /api/all |
Everything: guests, nodes, storage, pools, UniFi, Zabbix, cameras, health, topology, edge, add-ons |
GET /api/topology |
The network graph: nodes, links with measured rates, flows, totals |
GET /api/universe |
Every device in one stable, append-only layout, grouped into systems, plus measured traffic between them |
GET /api/k8s |
Per-cluster Kubernetes summary (no secrets, no addresses) |
GET /api/tour |
The aspect stops (internet, security, Wi-Fi, storage, power, monitoring, AI, cameras, media) and the shared problem list |
GET /api/gpu |
Per-GPU utilisation, memory, temperature, power |
GET /api/showtime |
Ollama instances, Frigate, media sessions, display mode |
GET /api/threats (+ /stream) |
The unified intrusion timeline, SSE on change |
GET /api/history?... |
Time series for a guest, a GPU, the network, or a host's latency |
GET /api/mode · /api/presence (+ /stream) |
Display mode and room presence |
GET /api/lightstate (+ /stream) |
The tour position the lights and the TV follow |
GET /cam/<name>.jpg |
A camera still, proxied server-side |
Full shapes, including what the screens depend on, are in
docs/contracts.md.
Docs
docs/configuration.md— every setting, with defaultsdocs/data-sources.md— what each backend contributesdocs/architecture.md— pollers, cache, scenedocs/contracts.md— API shapes, add-on and wizard contractsdocs/k3s.md— Kubernetes / k3s clusters, and running on k3sdocs/demo.md— what demo mode is and how the fixtures were made
Troubleshooting
Every poller logs a bracketed tag ([pve], [zbx], [topology], [threats],
[addons], ...) with the real exception, and never a credential. Under systemd
that is journalctl -u homelab-dashboard. The entries below are the failures
with non-obvious symptoms.
I just want to see it. DEMO=1 python3 app.py. No configuration is read,
no network is touched, and the fixtures drift so the scene is alive.
The scene is black, then flat panels appear. That is the HUD fallback. The page gives the 3D scene a few seconds to report ready and falls back if WebGL2 is missing or a script failed. Check the browser console. On kiosk hardware with no GPU acceleration, the HUD is the expected steady state.
The scene renders but is empty. No guest data arrived. Check /api/all for
guests and the log for [pve]: a wrong URL, an unreachable node, or a token
in the wrong format (it is one string, user@realm!tokenid=secret).
Stars appear, but node vitals and storage are empty. The configured node name does not match what Proxmox calls that node. Guests come from a cluster-wide call that works regardless; per-node calls interpolate the name.
The wizard says 401. The setup token is wrong or was regenerated. It is
printed at startup and stored as setup-token next to config.json.
A setting I changed in the wizard has no effect. An environment variable of the same name overrides the file. The wizard shows those fields as locked.
The camera tiles are black. With no NVR configured the layer is off; with one configured but unreachable the proxy returns an empty frame. The dashboard host, not your browser, needs to reach the NVR.
The TV and the wall disagree. Nexus follows /api/lightstate, which the wall
publishes. If the wall is not running, Nexus free-roams on its own — that is the
designed fallback, not a fault.
Something says "0 viewers" but my tunnel is busy. Those are different numbers on purpose. Requests through a tunnel are not visitors; configure Cloudflare analytics or the origin-log exporter for real unique viewers.
Security notes
- Credentials are read from the environment or a
0600config.json. They are never logged and never sent to the browser. - The Proxmox token should be
PVEAuditor. This app issues no writes. - Camera frames are proxied server-side, so browsers never need a route to the NVR.
- Outbound TLS verification is currently disabled for backend requests, which is what makes Proxmox's self-signed certificate work. Treat the network path between the dashboard and its backends as trusted.
- The dashboard has no login of its own unless you give it one. It shows a read-only picture of your whole infrastructure, so put it behind your reverse proxy, SSO or a trusted VLAN, and do not expose it to the internet. That advice is unchanged and is still the real answer.
- What that means concretely. With no
DASH_API_KEY, which is the default, one unauthenticatedGET /api/allreturns every VM and container with its id, name, state and IP address; the full network topology with every client, its MAC and what it is attached to; UniFi and Zabbix state and open problems; CrowdSec decisions; your camera names, with live frames at/cam/<name>.jpg; storage layout, pool names and capacities; and whatever your add-ons report./api/confignames the brand, domain and nodes. None of it can be written to — the app issues no writes to any backend — but all of it can be read by anything that can open the port. That is the whole threat model: it is a read-only window with no curtain unless you hang one. - Optional shared key:
DASH_API_KEY. Set it (env, or/setup-> Access control) and every page, API route and stream requires it; leave it unset and nothing changes, which is what every existing install gets on upgrade. It is one shared key, not user accounts — defence in depth behind the proxy, not a replacement for it. Details indocs/configuration.md. - Bound to
0.0.0.0with no key and not in demo mode, the app prints a loud warning at startup naming exactly what is on offer. If you see it, you meant to see it or you have a problem. - The setup wizard keeps its own separate
SETUP_TOKENgate either way: that protects the settings, not the view.
Contributing
Issues and pull requests are welcome — especially support for more hardware in
the topology layer. The one hard rule: never commit a credential, a private
IP, or a hostname from your own network. CI enforces it: a secret scanner runs
over the working tree and every blob in history, and a guardrail rejects
private addresses that are not clearly placeholders. .env and config.json
are gitignored; keep it that way.
License
MIT — see LICENSE.
Explore related projects
Loading…