
Jxck-S/dashcraft
Jxck-S/dashcraft has 29 GitHub stars and 2 forks. GitHot measured +1 stars in 24 hours. Last checked 2026-11-15 05:50 UTC. Last push 2026-11-12.
What you can do
- Interact with the report. Slicers, cross-filtering per the report's interactions, tooltips, Back and page-navigation buttons, and "View as" a role to check row-level security. - See the data. M queries refresh offline, PBIX data decodes from VertiPaq, and a virtualized grid sorts, filters with SQL and exports to CSV or Parquet.
- Understand the model. Tables, relationships, measures, calculation groups, roles and descriptions, as a diagram and as a tree, with a 17-rule broken-reference linter. - Query with DAX. 299 DAX functions with filter and row context, calculation groups and many-to-many relationships; run EVALUATE queries in the DAX query view.
- PBIP projects (TMDL or model.bim; PBIR or PBIR-Legacy) - Model, data through M refresh or .pbi/cache.abf, every report page
- PBIX and PBIT files - Model, embedded VertiPaq data (PBIX), every report page
Measured star growth
- in 24h
- +1
- in 7 days
- Collecting history
- in 15 days
- Collecting history
- in 1 month
- Collecting history
Net star changes over overlapping periods, not daily totals. Missing measurements are left blank. Stars measure attention, not software quality.
About
DashCraft: BI dashboards and data models; an open-source, clean-room Power BI file explorer and report renderer, written from scratch in Rust. Open PBIX, PBIP, PBIT, TMDL and model.bim offline on macOS, Windows and Linux. No Power BI Desktop, no VM, no cloud login.
Developer ToolsREADME.md
Original
DashCraft
Open Power BI files anywhere, offline, in a native app and CLI written in Rust.
PBIP, PBIX and PBIT reports with their data, DAX and Power Query M engines, and interactive report pages,
on macOS, Windows and Linux. No Power BI Desktop, no Windows VM, no sign-in.





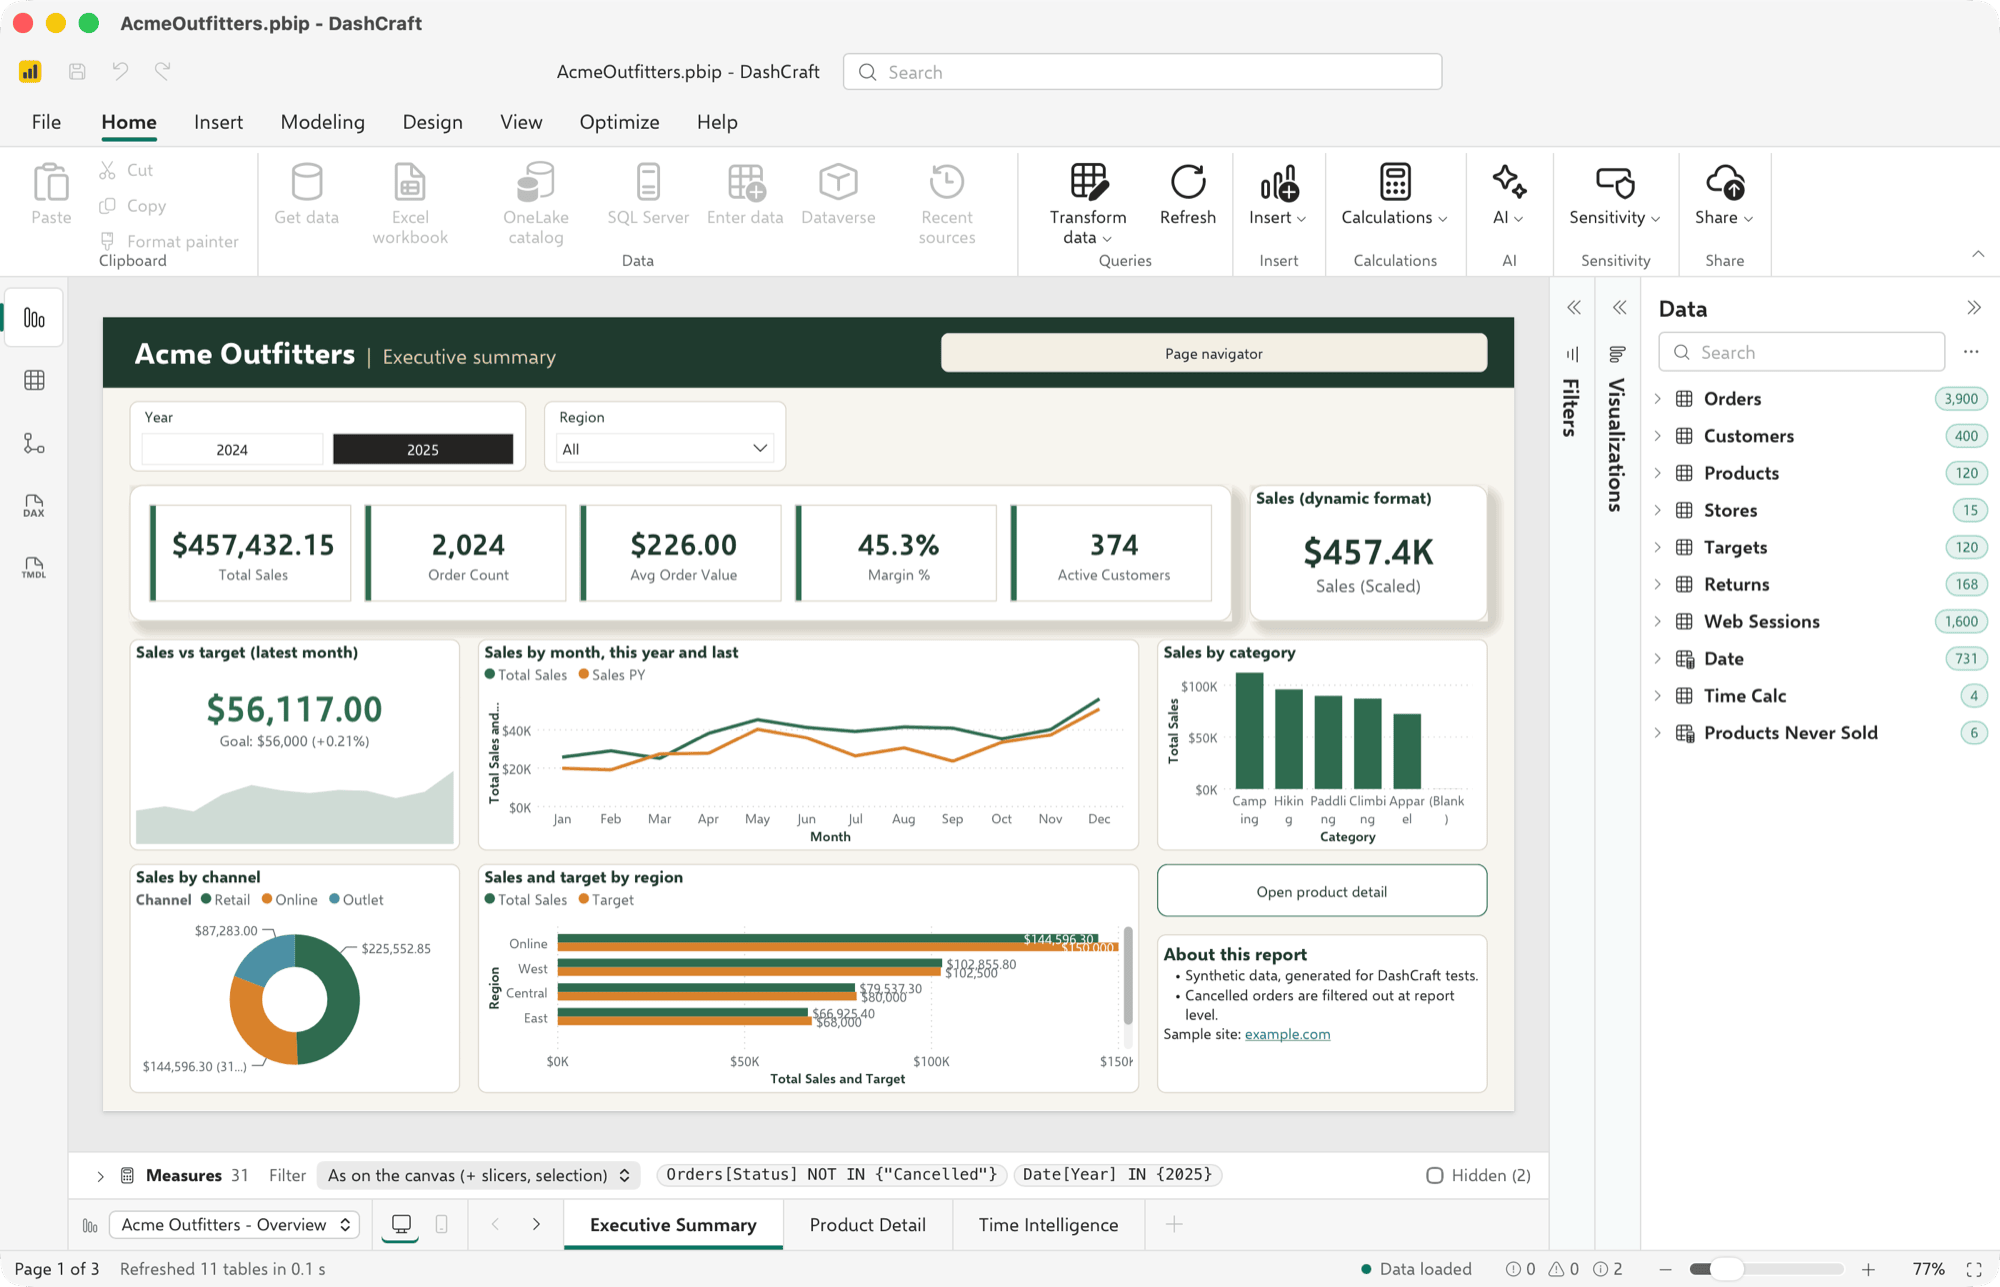
The Executive Summary page of the synthetic Acme Outfitters example, rendered and evaluated entirely by DashCraft.
Features · Agents · Under the hood · Get started · Status · Documentation
Familiar layoutThe ribbon, view rail, Filters, Visualizations and Data panes and page tabs sit where Power BI Desktop puts them. Commands DashCraft can't run yet are shown, disabled. |
Real enginesIts own DAX and Power Query M engines, a clean-room VertiPaq decoder and an Arrow + DataFusion storage engine load and evaluate the model offline. |
Interactive reportsSlicers, cross-filtering, tooltips, scrolling tables and expandable matrices, drawn by built-in Rust visuals with bundled fonts, identically on every OS. |
Agent-readyEvery capability is a typed command, so the app, the CLI, a JSON-RPC server and an MCP server for AI agents all run the same code. |
Features
Every screenshot is the real app on the synthetic Acme Outfitters example in this repository.
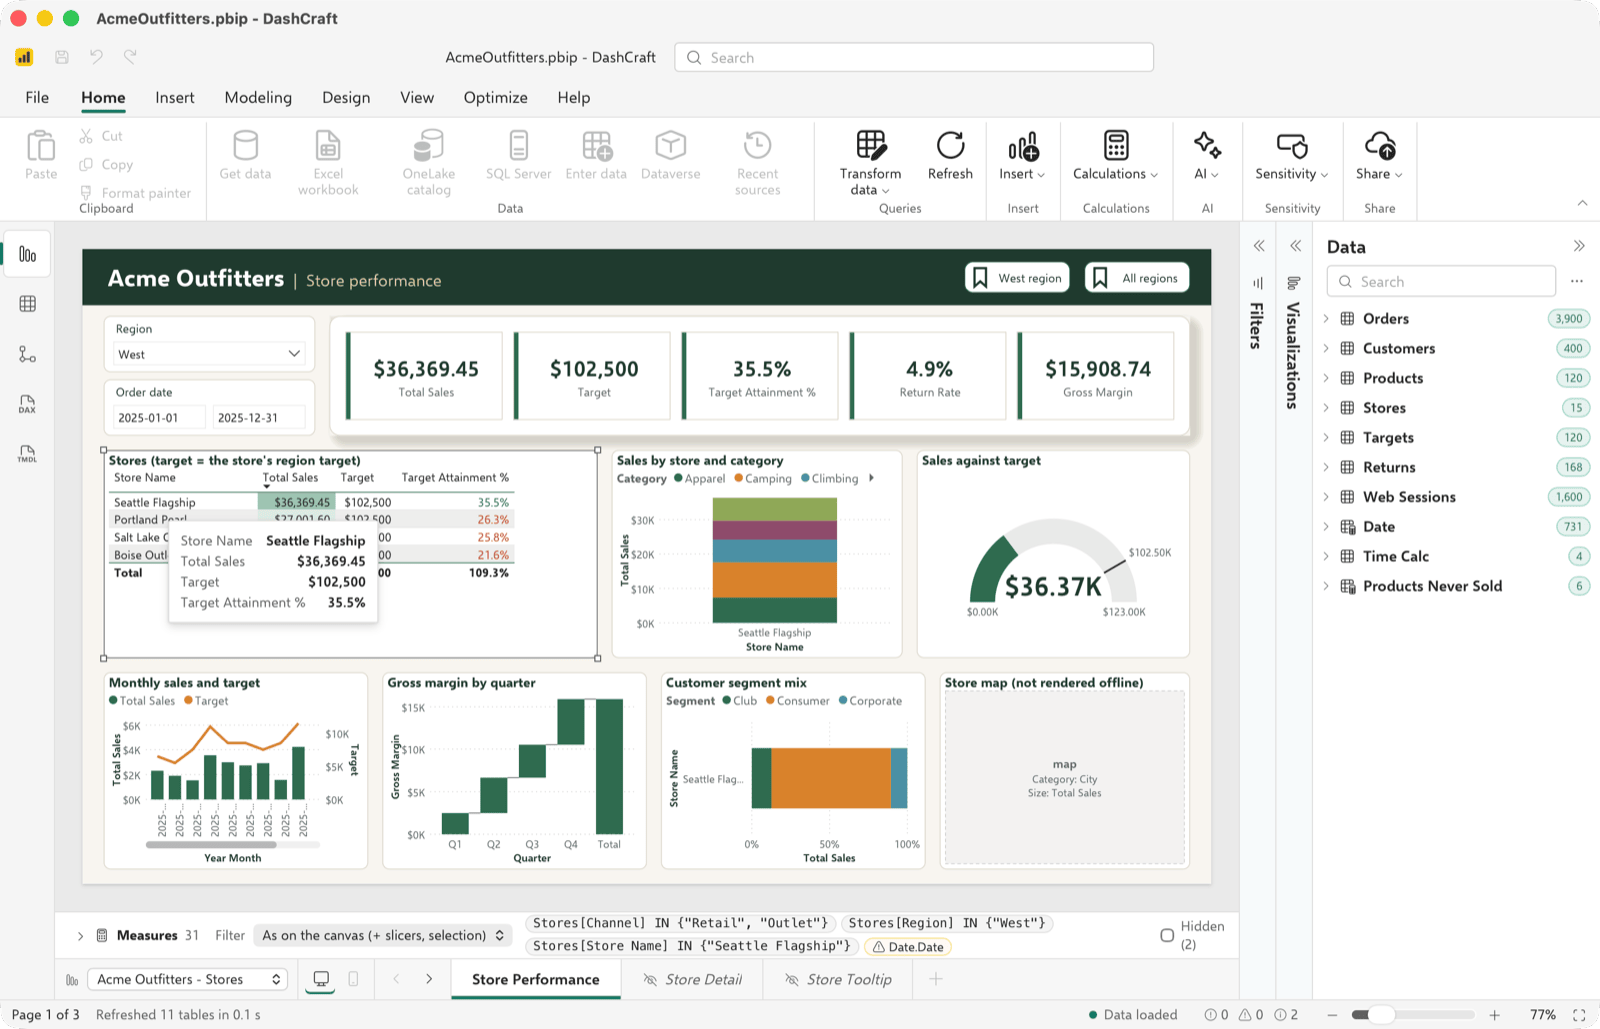
Interact with the report. Slicers, cross-filtering per the report's interactions, tooltips, Back and page-navigation buttons, and "View as" a role to check row-level security. |
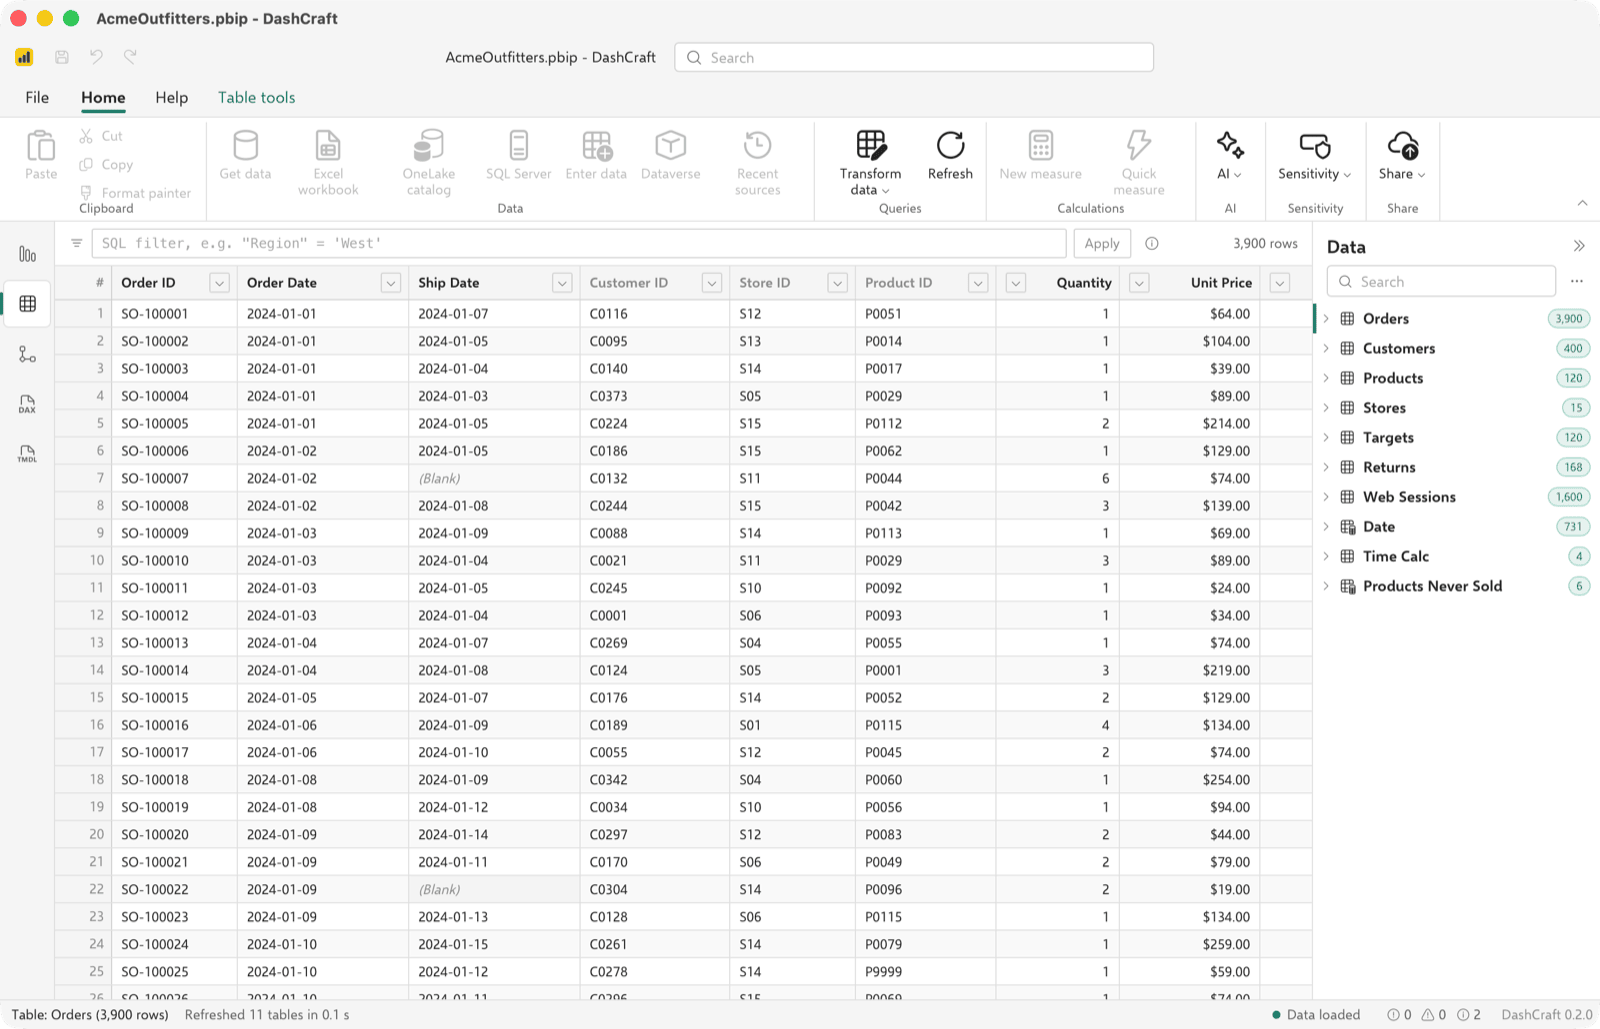
See the data. M queries refresh offline, PBIX data decodes from VertiPaq, and a virtualized grid sorts, filters with SQL and exports to CSV or Parquet. |
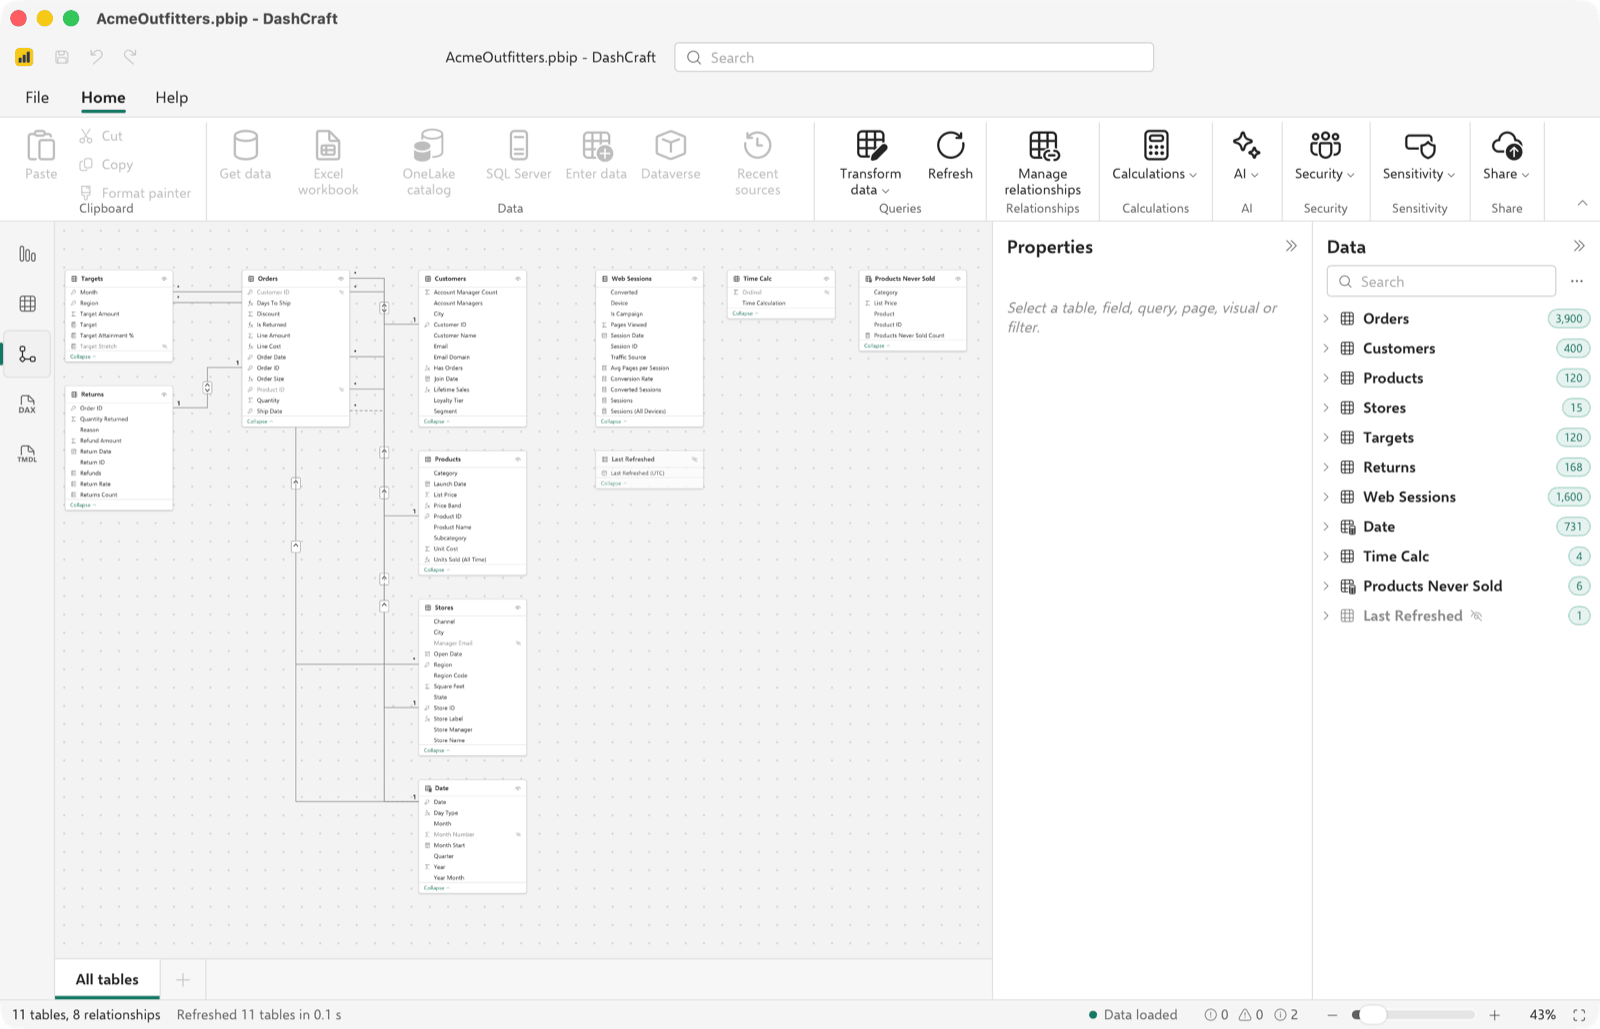
Understand the model. Tables, relationships, measures, calculation groups, roles and descriptions, as a diagram and as a tree, with a 17-rule broken-reference linter. |
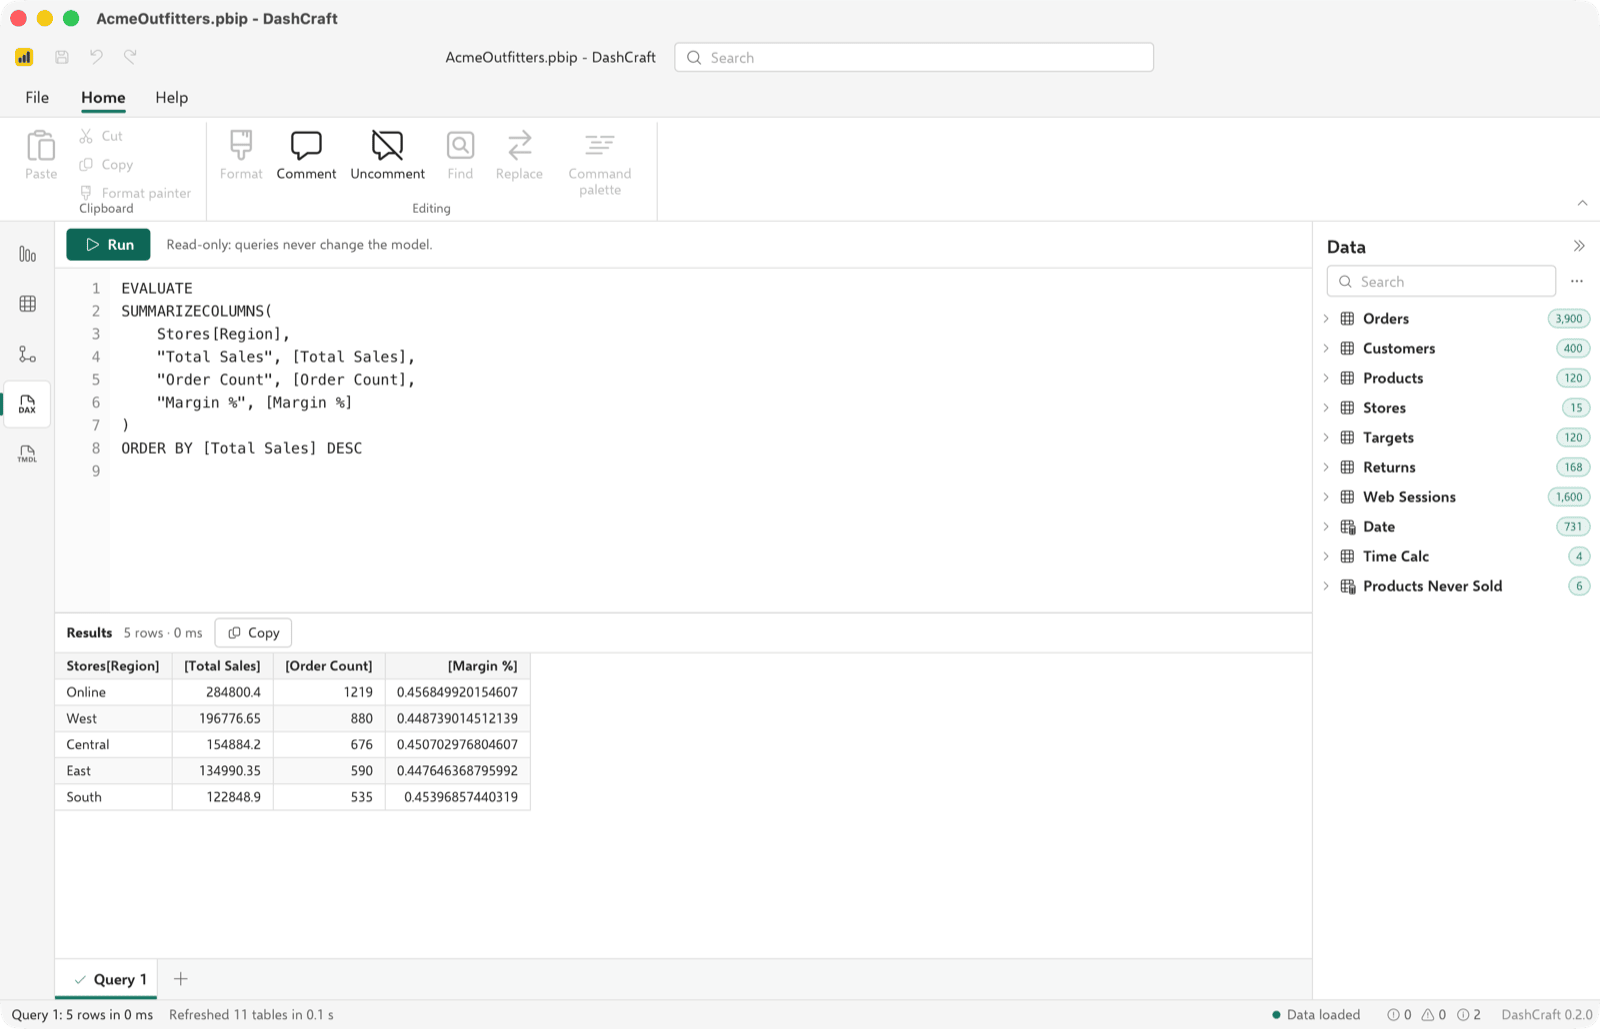
Query with DAX. 299 DAX functions with filter and row context, calculation groups and many-to-many relationships; run EVALUATE queries in the DAX query view.
|
| Opens | Notes |
|---|---|
PBIP projects (TMDL or model.bim; PBIR or PBIR-Legacy) |
Model, data through M refresh or .pbi/cache.abf, every report page |
| PBIX and PBIT files | Model, embedded VertiPaq data (PBIX), every report page |
.bim, TMDL folders, .abf, Power Pivot workbooks, .vpax, .pq/.pqt, dataflows, .rdl, .pbids |
Model, data or outline, depending on the format |
Everything else, from the per-visual support matrix to the DAX and M coverage, is in docs/FEATURES.md; the full format matrix is in FORMATS.md.
Built for agents
Every capability is a command in one registry (doc.open, measures.values, dax.query,
render.page, security.viewAs, …) with JSON Schemas for its parameters and results. The CLI, the
app, a JSON-RPC server and an MCP server are thin adapters over it.
# Every measure's value on a report, as JSON
dashcraft run measures.values --doc model.pbip -p report=Overview

# Render every page of a report to PNG
dashcraft render report.pbix --all-pages --out-dir pages/

# The command catalog with its schemas
dashcraft commands --json --schemas

# Let an AI agent use DashCraft over MCP, confined to read and write roots
dashcraft mcp --read-root ./reports

# DAX, M and TMDL help in your editor (Language Server Protocol)
dashcraft lsp --model model.pbip
AI features are opt-in and off by default: with AI off, DashCraft makes no network requests at all (docs/AI.md). The MCP server is described in docs/MCP.md, every CLI flag in docs/CLI.md.
Under the hood
- Pipeline: containers → format readers → a TOM-like model → session (M refresh, VertiPaq decoding, DAX) → visual queries → Power BI-shaped DataViews → visuals → scene graph → SVG and PNG (docs/ARCHITECTURE.md).
- Layered crates: 15 crates, layering enforced in CI by
cargo xtask layers; UI-toolkit crates stay in the app, network crates in the opt-in AI layer. - Built to edit: lossless TMDL, TMSL and PBIR readers and writers and undoable document commands, the groundwork for Power BI Desktop-style editing.
- Untrusted input: parsers never panic,
unsafeis denied, archives are capped and guarded against zip-slip, 17 fuzz targets run nightly, and embedded scripts and custom visuals are never executed (docs/SECURITY.md). - Deterministic and fast: bundled fonts only, the same bytes on every OS; performance budgets
checked by
cargo xtask perf(docs/perf.md). - Clean-room: implemented from public documentation and observed behaviour, with no Microsoft code, icons or assets (ADR-0003).
Get started
git clone https://github.com/Jxck-S/dashcraft
cd dashcraft
cargo build --release -p dashcraft-cli                     # the dashcraft CLI
target/release/dashcraft inspect path/to/report.pbix

cd app && npm install
npm run tauri dev -- -- path/to/report.pbix              # the desktop app
Try it on the example in this repository: open
reference/examples/acme-outfitters/AcmeOutfitters.pbip with
DASHCRAFT_BLOB_MAP=reference/examples/acme-outfitters/blob-map.json set, so its data loads
offline. Prerequisites, every build and test command and the test-data rules:
docs/DEVELOPMENT.md. Using the app and the CLI:
docs/USER-GUIDE.md. Contributors and AI agents: start with
AGENTS.md.
Installers for macOS, Windows and Linux are built by the release workflow (docs/packaging.md); they are unsigned until signing certificates exist.
Status
[!IMPORTANT] DashCraft is mainly a viewer today. It opens, refreshes, queries and renders Power BI files, and makes a first set of undoable edits (tables, columns, measures, relationships, renames, descriptions, visual position and size) that it saves back to PBIP projects; report authoring, the modeling editors and Power Query editing are not there yet. The goal is a full Rust reimplementation of Power BI Desktop.
- Released: v0.1.0 (Data Explorer), v0.2.0 (Report Renderer, remaining formats,
installers) and v0.3.0 (editing and save, language services and the formula bar, recovery
and external changes, reading-view parity); later work is in
mainunder[Unreleased]in the CHANGELOG. - Where it stands: each area is scored 0–5 against Power BI Desktop in docs/GAPS.md. The viewer scores 3–5; editing, modeling and Power Query, 0–1.
- Where it is going: milestones M6 to M31, from editable documents to 1.0, in docs/DESKTOP-PLAN.md; releases, acceptance criteria and the next items in docs/ROADMAP.md.
Documentation
| Using DashCraft | User guide · Features · CLI · Commands · MCP · AI |
| Support matrices | Formats · Visuals · DAX functions · Lint rules |
| Project | Roadmap · Desktop plan · Gaps · Changelog · Dev log |
| Contributing | AGENTS.md · Development · Architecture · Decisions · Performance · CI · Packaging · Security |
| App and data | App · Desktop UI reference · Test fixtures · VertiPaq notes |
License and notices
DashCraft is open source under either the MIT License or the Apache License, Version 2.0, at your option. Bundled assets: the Selawik and Carlito fonts (SIL OFL 1.1, unmodified) and Fluent UI System Icons (MIT); no Power BI icons, images or CSS. The XPress9, ABF and VertiPaq decoders are clean-room implementations; shipping PBIX data decoding in a release needs the legal review recorded in ADR-0003. Third-party attributions: THIRD_PARTY_NOTICES.md.
DashCraft is an independent project, not affiliated with, endorsed or sponsored by Microsoft. "Power BI" and "Microsoft" are trademarks of Microsoft, used only to say which files DashCraft opens. It is not affiliated with storytold/ArtCraft or with other products named "DashCraft". See NOTICE and ADR-0009.