
JohnYan2017/SmartCharts
JohnYan2017/SmartCharts has 771 GitHub stars and 130 forks. GitHot measured 0 stars in 24 hours and -1 in 7 days. Last checked 2026-11-09 22:18 UTC. Last push 2026-09-28.
🔥数据可视化,大屏, 支持Echarts,SQL,API,VUE,可用于Jupyter, 比pyecharts容易, 极低门槛,拿来即用,比拖拽方便,项目插件或独立平台皆可, 简单, 敏捷, 高效, 通用化, 高度可定制化,为你完全打通前后端, 图形数据联动, 筛选开发毫无压力, 数据缓存处理机制让报表快人一步
Measured star growth
- in 24h
- 0
- in 7 days
- -1
- in 15 days
- Update delayed
- in 1 month
- Update delayed
Net star changes over overlapping periods, not daily totals. Missing measurements are left blank. Stars measure attention, not software quality.
README-EN.md
OriginalWiki | Community | Documentation | GitHub | Gitee

A NoBI Platform That Connects Data to Insight


Introduction
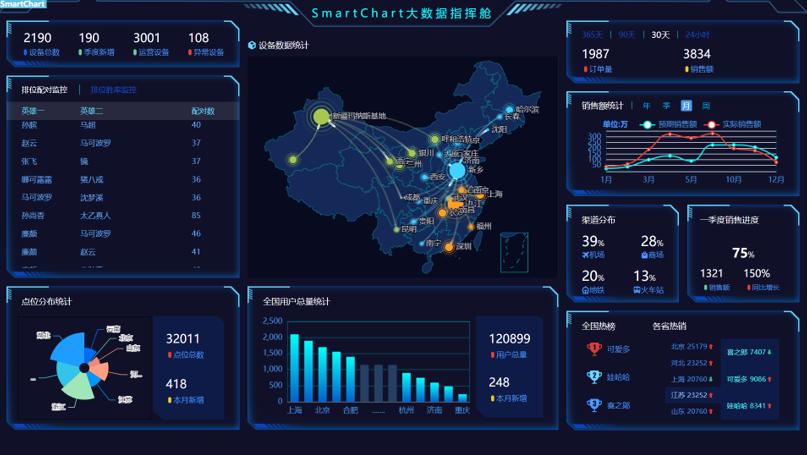
SmartChart is a full-ecology data application management platform built on Python + Django, integrating dataset development, ECharts visualization, drag-and-drop layout, permission management, and AI agents. With only SQL (or Python) knowledge, you can rapidly build data dashboards, large screens, and business systems.
The platform is trusted by 5,000+ enterprises, with core projects running stably in multiple listed companies for over 5 years.
Architecture
┌─────────────────────────────────────────────────────────┐
│                   Data Service Layer                     │
│  API │ Self-Service Query │ Subscription │ AI │ Smart BI│
├─────────────────────────────────────────────────────────┤
│                   Application Layer                     │
│     SmartChart Visualization │ SmartPip Governance │ Form│
├─────────────────────────────────────────────────────────┤
│                   Platform Layer                        │
│    Data Pipeline │ Data Dev & Mgmt │ Multi-Source ETL   │
└─────────────────────────────────────────────────────────┘
| Module | Description |
|---|---|
| SmartChart | Low-code visual analytics platform |
| SmartPip | Data governance platform |
| Data Services | API, self-service query, data subscription, AI assistant |
Key Features
- A low-code development platform for data visualization, large screens, mobile reports, data middleware, and web applications
- Simple, agile, efficient, universal, and highly customizable — instantly elevate your project's quality
- Fully bridges front-end and back-end; supports chart data linkage, filtering, and drill-down; compatible with nearly all common databases
- Building-block drag-and-drop development — out of the box, easy to install, minimal dependencies, cross-platform
- Supports Chinese-style EXCEL-like reports and 3D scene dashboards
- Built-in OA organization and workflow engine — supports approval flow design, parallel branches, reject/withdraw/transfer
- Built-in APScheduler — supports scheduled dataset refresh and distributed master-slave mode
- Standalone admin panel — one-stop management for connection pools, datasets, dashboards, chart formats, and project groups
- Dataset type extensions: Agent, Tool, Chart, and API
- In-memory acceleration technology — significantly reduces database pressure
- True WYSIWYG drag-and-drop development — no canvas design required
- Dataset-as-a-Service — rapidly build data service APIs with low code
- Dashboard backup/restore/snapshot — meets enterprise-grade version control and deployment workflows
- User/group permission control with row-level and field-level data access policies
- Django plugin integration — infinitely extensible for your personalized applications
- Jupyter Notebook support for data development
- AI integration with DeepSeek, ChatGPT, ERNIE Bot, Tongyi, Alibaba Bailian, and more
- Enterprise WeChat / DingTalk SSO, third-party OAuth, and self-service user registration
- Customizable data entry, import, export, file upload, and more
- No redundant learning curve, highly customizable — yes, HIGHLY customizable!!
Development Workflow
Create Dashboard → Add Chart Component → Edit Dataset (write SQL) → Edit Chart (configure ECharts/HTML) → Drag-and-Drop Layout → Preview/Publish


Video Tutorials
| Version | Link |
|---|---|
| 6.0 Introduction | Bilibili |
| Advanced Development | Bilibili |
| 7.0 CRUD | Bilibili |
| 7.0 CRUD Data | Toutiao |
| 7.0 AI Agent | Toutiao |
| Enterprise Digital Solution | Bilibili |
V8.0 is continuously being released — follow smartAi on Toutiao for the latest updates.
Quick Start
1. Install Python
- Download: Python 3.9 Official (3.6+ recommended)
- Windows: Make sure to check "Add to Path" during installation
2. Install SmartChart
# Option 1: Install from PyPI
pip install smartchart

# Upgrade
pip install smartchart -U
V8.0 Note: pip package is not available for V8.0 at this time. Please contact us if needed. Since v7.9, SmartChart has been fully AI-powered as SmartAi. Before upgrading, run
smartchart makemigrationsfirst.
# Option 2: Install from release package
pip3 install smartchart-xxx-py3-none-any.whl

# Use mirror if download is slow
pip3 install -i https://mirrors.aliyun.com/pypi/simple smartchart-xxx-py3-none-any.whl
3. Launch
# Local development
smartchart

# Server (remote access)
smartchart runserver 0.0.0.0:8000 --insecure --noreload

# Linux background process
nohup smartchart runserver 0.0.0.0:8000 --insecure --noreload &
After startup, visit: http://127.0.0.1:8000
- Default admin account:
admin/admin
# Reset forgotten password
smartchart changepassword username
Please read the SmartChart Getting Started Guide for the complete setup walkthrough.
Design Philosophy
SmartChart's design philosophy is grounded in real-world application scenarios, emphasizing agile development, data-driven design, and developer friendliness.
| Principle | Description |
|---|---|
| Agile Data Platform | Designed for real-world scenarios, battle-tested in large enterprises for years |
| Low-Code, Not No-Code | Developer-friendly with full freedom to extend |
| Minimalist UI | Low-frequency features are hidden to reduce interface complexity |
| Data Highway | No proprietary language — just connects data to visualization |
| Progressive Experience | Accumulate charts and templates for rapid reuse |
Comparisons
vs. Traditional BI
- Traditional BI targets non-technical users with no-code approaches, resulting in limited visualization quality, low customization, slow performance, and high hardware requirements
- SmartChart targets technical users with low-code — better visualization, higher customization, faster performance, and broader applicability
- If your data/report developers are primarily in the technical department, SmartChart is the optimal choice
vs. Dashboard Designers
- Dashboard designers focus only on front-end effects (borders, decorations) without real data development capabilities
- SmartChart is a full-stack solution covering data development, visualization, version control, deployment, and embedding
vs. Data Platforms
- SmartChart is a component of the data platform stack — use it to complement data service and application capabilities
- If your data platform is Django-based, SmartChart is likely the best fit
- Our data platform can be introduced later with seamless SmartChart integration
vs. Low-Code Platforms
- Traditional low-code platforms target non-technical users with process-driven approaches
- SmartChart is built on real developer needs with higher openness and data-driven design
vs. AI Agents
- Common agents are either Python libraries or inflexible GUI-only tools
- SmartChart leverages its powerful data connectivity and visualization to enable low-code AI Agent development
Deployment Options
| Method | Use Case | Description |
|---|---|---|
| pip install | Development / personal use | Quick install and launch |
| uWSGI + Nginx | Linux production | Recommended production deployment |
| Offline | Air-gapped environments | Available with professional edition |
Authentication: Username/password, Enterprise WeChat OAuth, DingTalk OAuth, third-party OAuth, and email registration.
Full deployment documentation: Deployment Guide
Contact & Support
Join our QQ group for community discussions: QQ Group: 476715246 Code: smartchart
Please include your company name and phone number when adding us on WeChat.

Change Log
| Version | Highlights |
|---|---|
| V8.0 | Approval workflows, scheduled tasks, full UI overhaul, datasets upgraded to AI Agents, product evolved into SmartAi |
| V7.5 | Full AI agent support, ECharts 6.0, enhanced CRUD templates, drag-sort homepage |
| V7.1 | Optimized chart components, 3D model integration, WeCom/DingTalk SSO, dashboard favorites |
| V7.0 | Powerful CRUD template development, resource management, AI agent support, Excel import/export |
| V6.8 | ECharts 5.5, Feishu/WeCom connectors, vector DB client |
| V6.5 | Grid-assisted positioning, ds_filter function, enhanced data source icons |
| V6.0 | Complex reports, 3D scenes, mobile adaptation, Prometheus/InfluxDB connectors |
| V5.7 | Major template/graphics editor overhaul, MongoDB/ES connectors, API rate limiting |
| V5.0 | New UI, removed Bootstrap, 40 chart themes, custom themes, linkage drill-down UI |
| V4.0 | New 24/12 grid layout, drag-and-drop, HTML components, auto identity detection |
Full changelog available at Official Documentation.
Explore related projects
Asabeneh/30-Days-Of-Python
The 30 Days of Python programming challenge is a step-by-step guide to learn the Python programming language in 30 days. This challenge may take more than 100 days. Follow your own pace. These videos may help too: https://www.youtube.com/channel/UC7PNRuno1rzYPb1xLa4yktw
78,486 starsgrafana/grafana
The open and composable observability and data visualization platform. Visualize metrics, logs, and traces from multiple sources like Prometheus, Loki, Elasticsearch, InfluxDB, Postgres and many more.
77,790 starsredis/redis
For developers, who are building real-time data-driven applications, Redis is the preferred, fastest, and most feature-rich cache, data structure server, and document and vector query engine.
77,332 starsapache/superset
Apache Superset is a Data Visualization and Data Exploration Platform
75,455 stars