
Huy-8bit/locklens
Huy-8bit/locklens has 31 GitHub stars and 4 forks. Star changes are not measured yet. Last checked 2026-11-18 07:07 UTC. Last push 2026-11-14.
What you can do
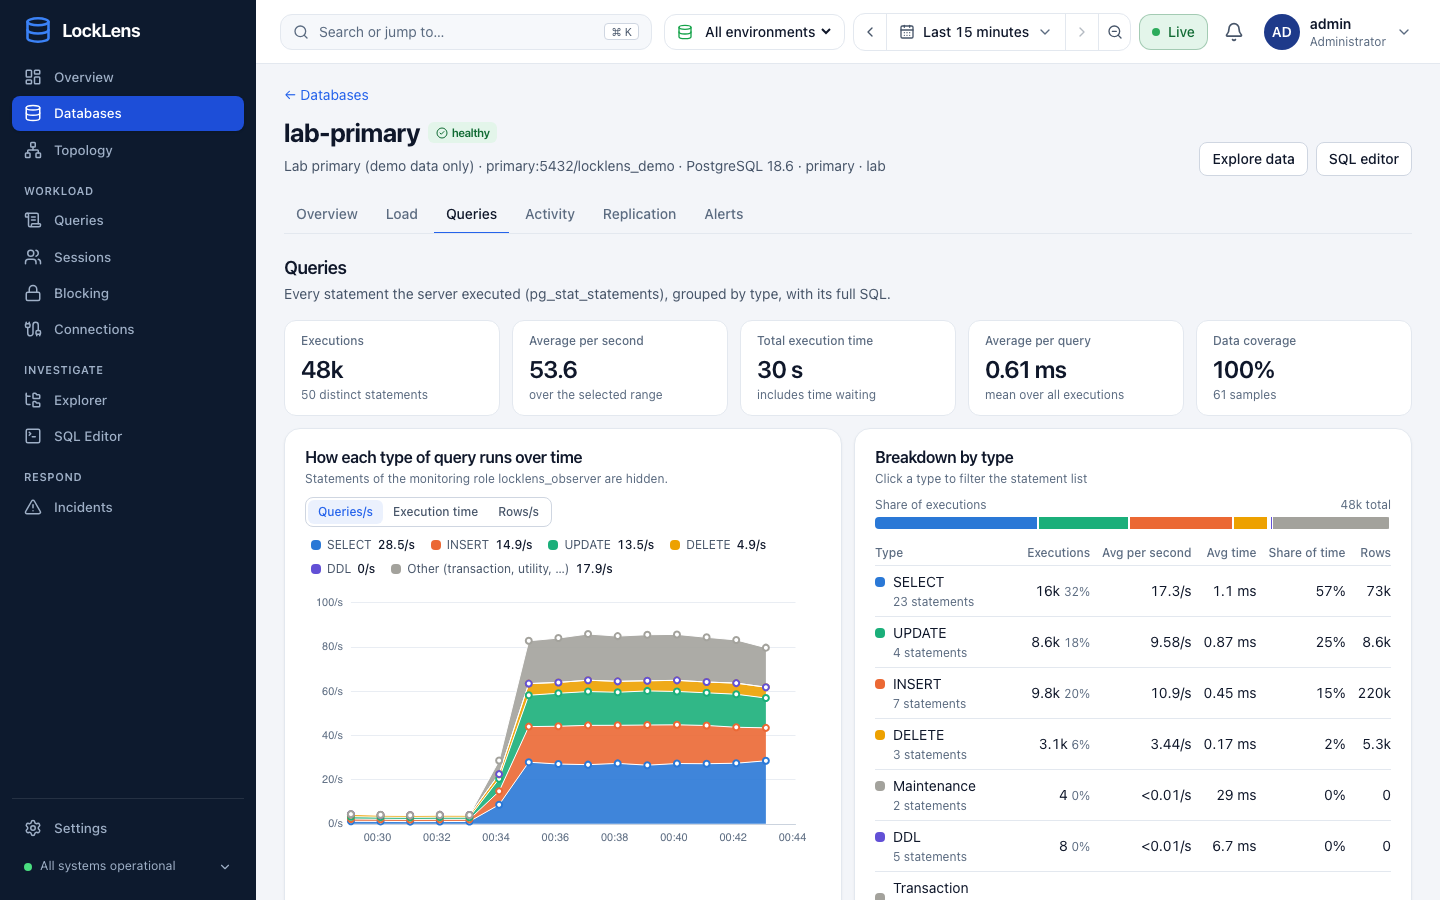
- Queries - Every statement from pg_stat_statements, classified as SELECT, INSERT, UPDATE, DELETE, DDL, … · rate, time, and rows per type over time · top queries across instances · comparison with the previous period
- Changes - A timeline of what changed: settings and reloads, restarts, failovers and promotions, upgrades, created and dropped indexes and tables — detected automatically — plus deploys and migrations reported by your pipeline with an API token · drawn on every chart and weighed when explaining an anomaly
- Server logs - locklens agent on the database host ships slow statements with p50/p95/p99, real plans from auto_explain, lock waits with their holders, deadlocks, autovacuum runs, temporary files, checkpoints, and errors · statements normalised and messages redacted before they leave the host
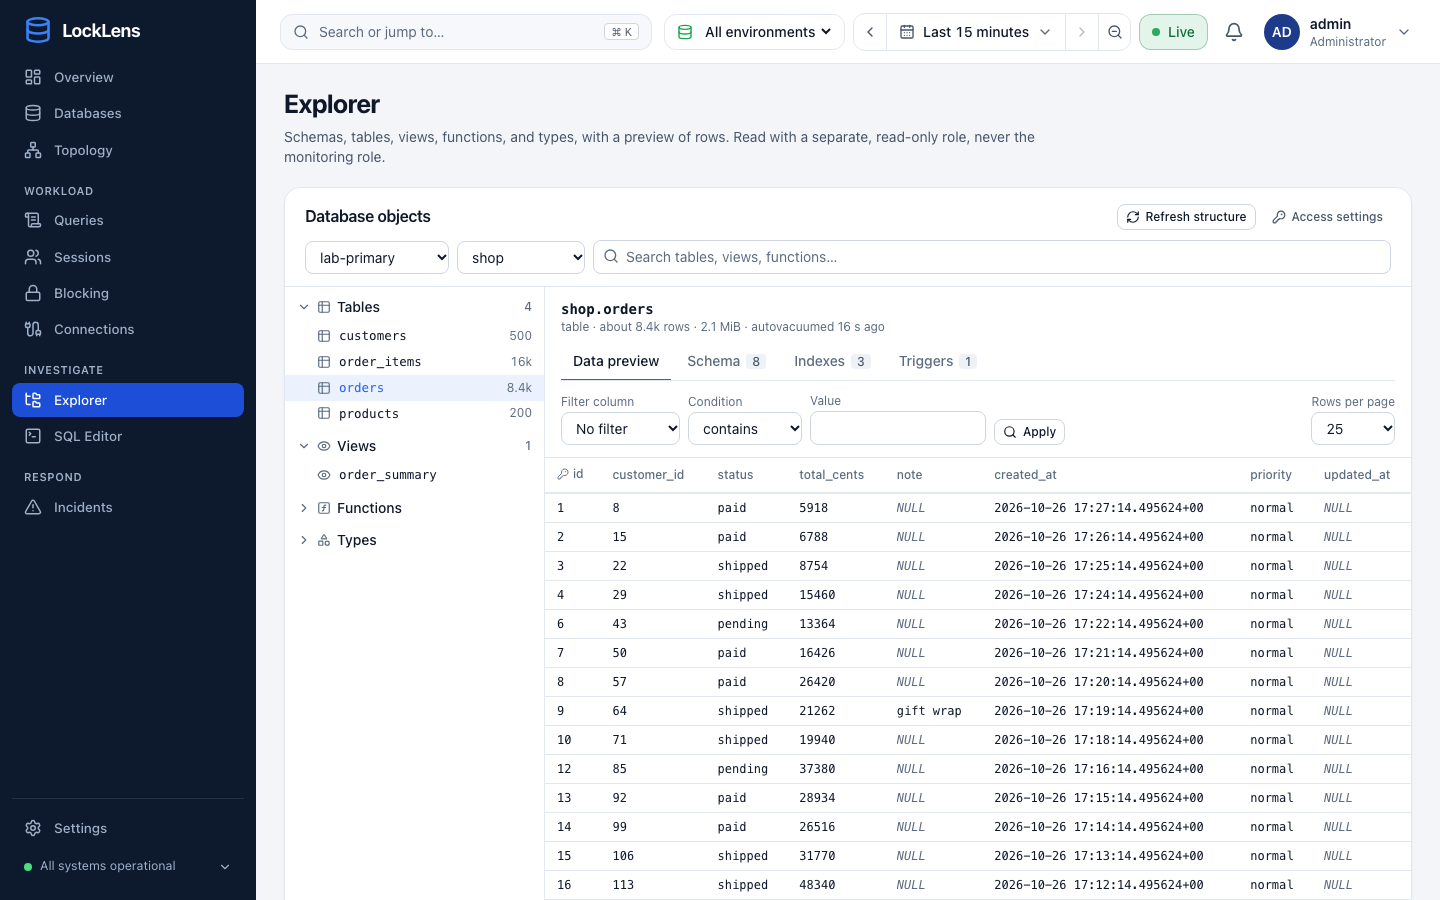
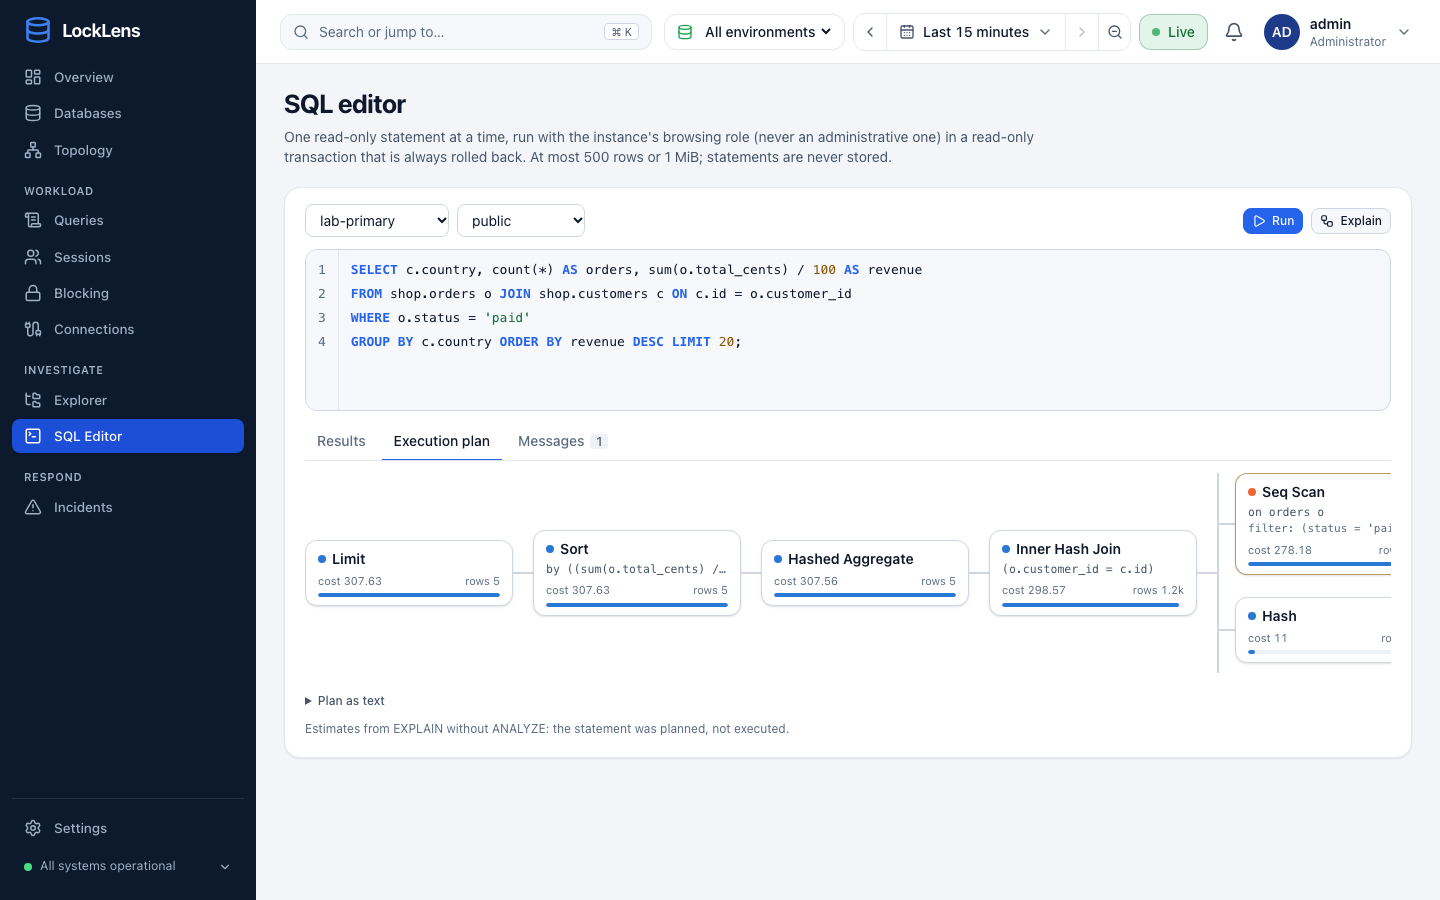
- Explore (opt-in) - Browse schemas, tables, views, functions, types, indexes, and triggers · preview rows · read-only SQL editor with an execution-plan graph — never with an administrative role
Measured star growth
- in 24h
- Update delayed
- in 7 days
- Collecting history
- in 15 days
- Collecting history
- in 1 month
- Collecting history
Net star changes over overlapping periods, not daily totals. Missing measurements are left blank. Stars measure attention, not software quality.
About
PostgreSQL monitoring and incident investigation
DataREADME.md
OriginalLockLens
Open-source PostgreSQL monitoring and incident investigation.
See what your databases are doing right now, find out who is blocking whom, and keep the evidence when something goes wrong.




Quick start · Features · Documentation · Deployment · Contributing
Why LockLens
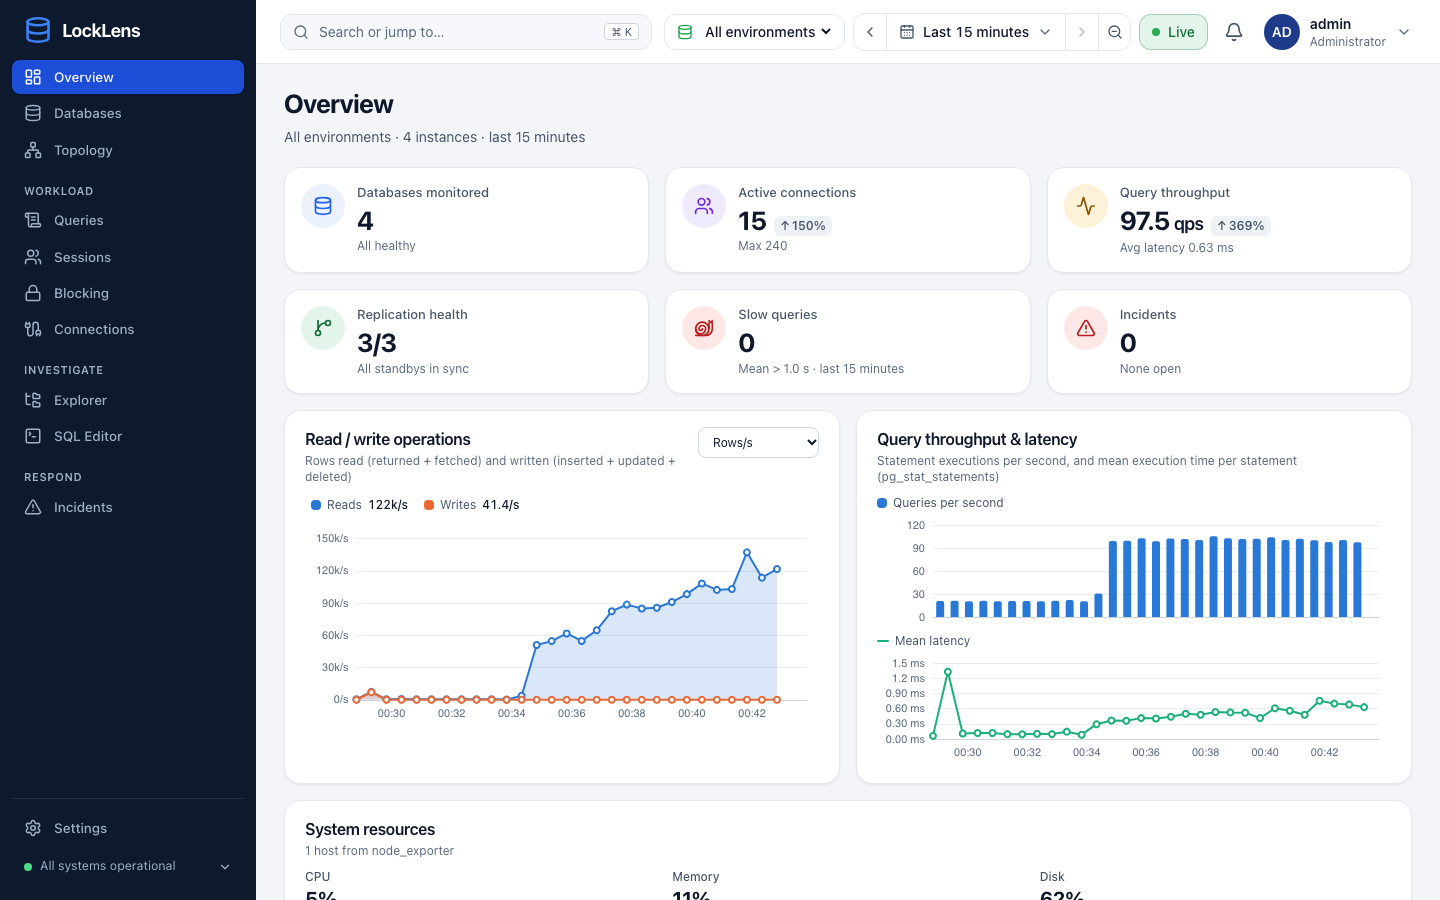
- One screen for the whole fleet. Connections, query throughput and latency, replication, slow queries, sessions, blocking, and incidents for every instance of an environment.
- Answers, not just charts. Database load by wait class and statement shows what keeps the server busy; blocking chains show their root blocker; incidents name the statement and the sessions involved, with the evidence, possible explanations, and what to check next.
- Tells you when it matters. Incidents go to Slack, webhooks, or email, with reminders and silences for maintenance windows.
- Observe-only by design. LockLens connects with a read-only role. It never cancels queries, terminates sessions, changes configuration, or runs DDL/DML on your databases.
- Two small images. A Go backend (API, collectors, CLI) and an nginx frontend that serves the web UI and proxies the API. Their only dependency is a PostgreSQL database for LockLens' own history; with TimescaleDB it is partitioned by time and compressed.
Features
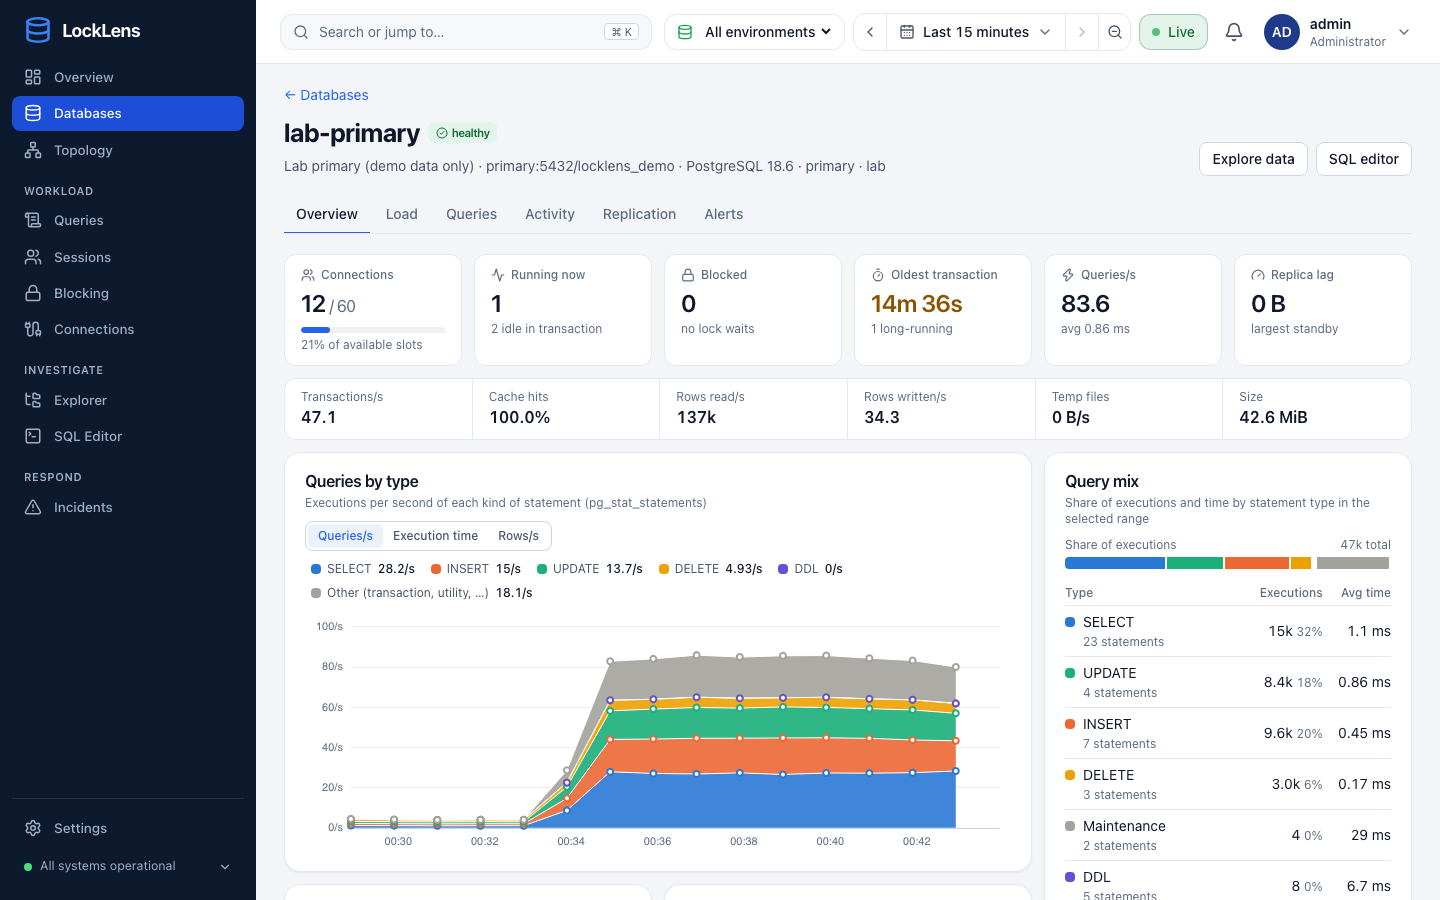
| Monitor | Fleet overview with environments (production, staging, …) · per-instance dashboards · sessions, transactions, cache, WAL, temp files, vacuum · hot tables · replication topology with replay lag · host metrics from node_exporter · several databases per instance · statements every 15 s, faster collection while there is a problem, one-minute and hourly rollups for long ranges |
| Queries | Every statement from pg_stat_statements, classified as SELECT, INSERT, UPDATE, DELETE, DDL, … · rate, time, and rows per type over time · top queries across instances · comparison with the previous period |
| Performance | Each statement compared with its own baseline (median and MAD, by hour of day) · slower per call, more calls, more load, more I/O, different rows per call, possible N+1 · queries slow while they run · explainable impact score and confidence · evidence correlated into ranked hypotheses (never presented as confirmed causes) · execution plan history and comparison, without ever running EXPLAIN ANALYZE |
| Changes | A timeline of what changed: settings and reloads, restarts, failovers and promotions, upgrades, created and dropped indexes and tables — detected automatically — plus deploys and migrations reported by your pipeline with an API token · drawn on every chart and weighed when explaining an anomaly |
| Server logs | locklens agent on the database host ships slow statements with p50/p95/p99, real plans from auto_explain, lock waits with their holders, deadlocks, autovacuum runs, temporary files, checkpoints, and errors · statements normalised and messages redacted before they leave the host |
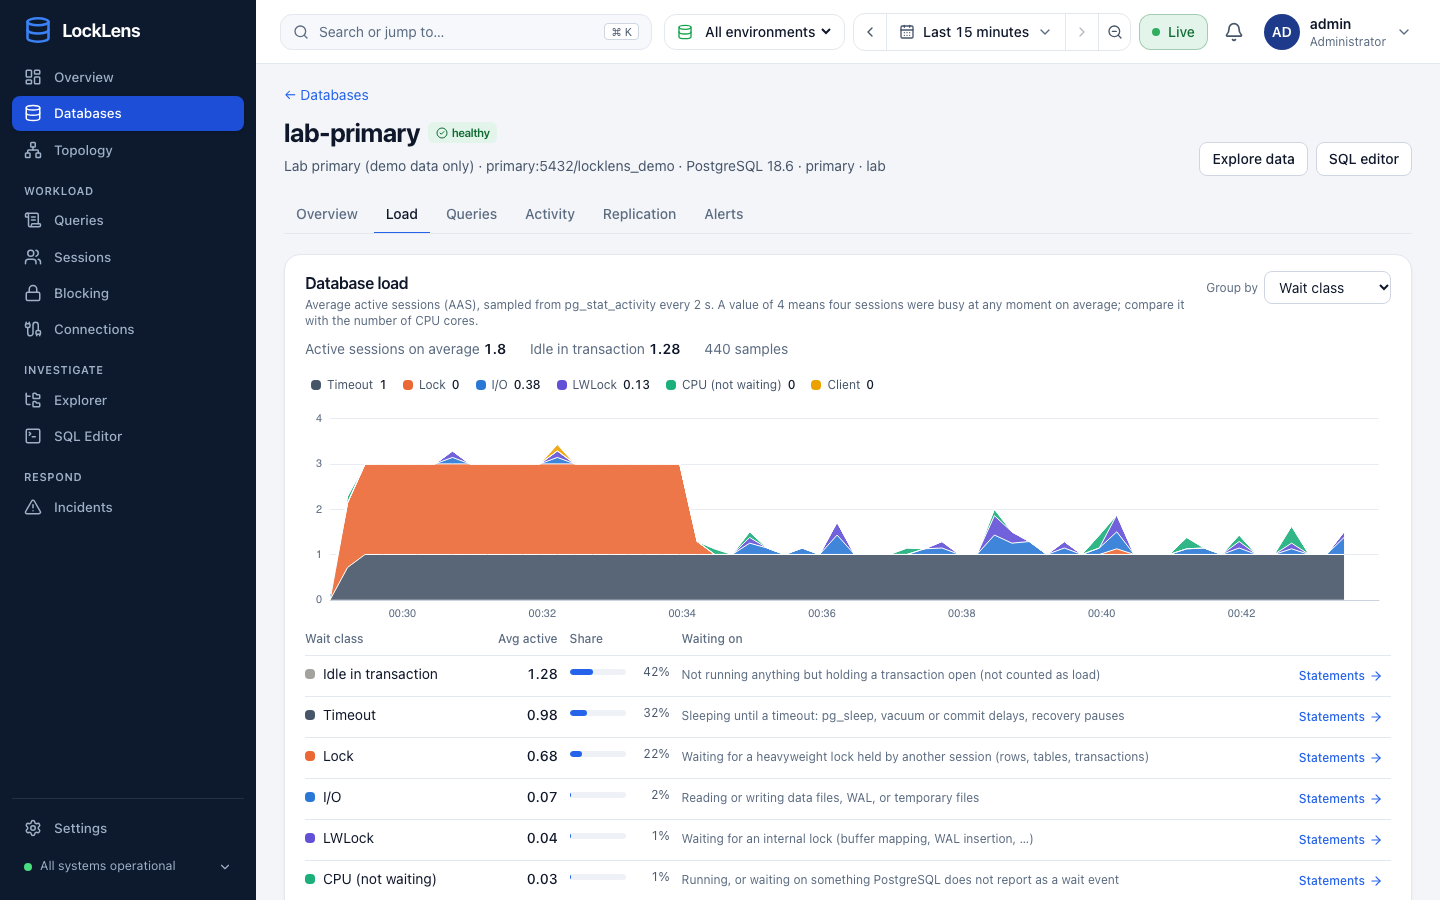
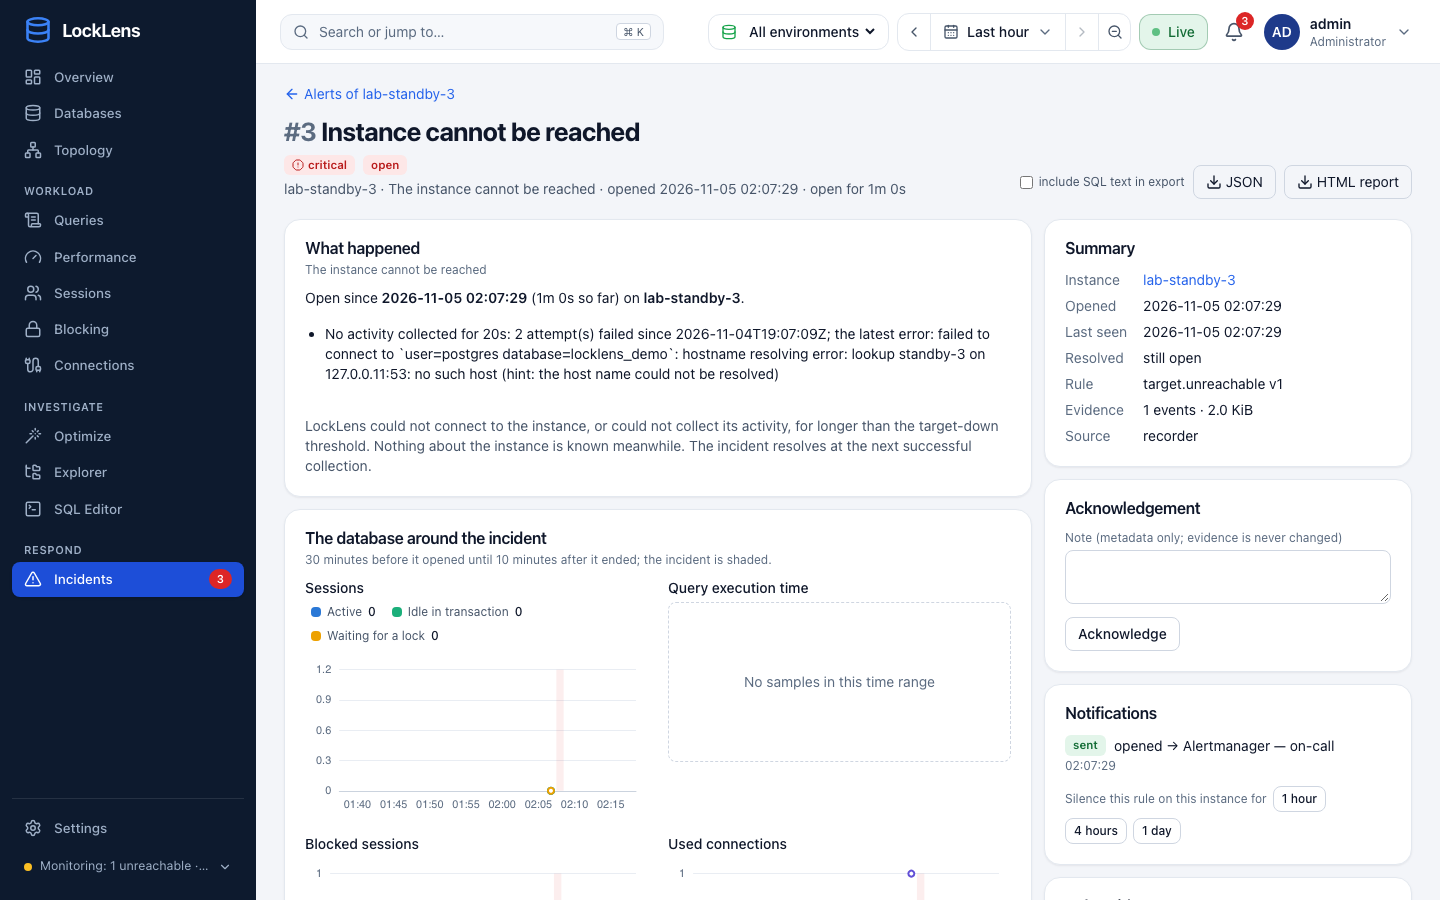
| Investigate | Database load from active session sampling: average active sessions by wait class, wait event, statement, user, or application · blocking trees from pg_blocking_pids() with lock modes and wait times · idle-in-transaction blockers · 18 evidence-based rules · incident recorder with the statement involved, the sessions and load when it started, and a timeline |
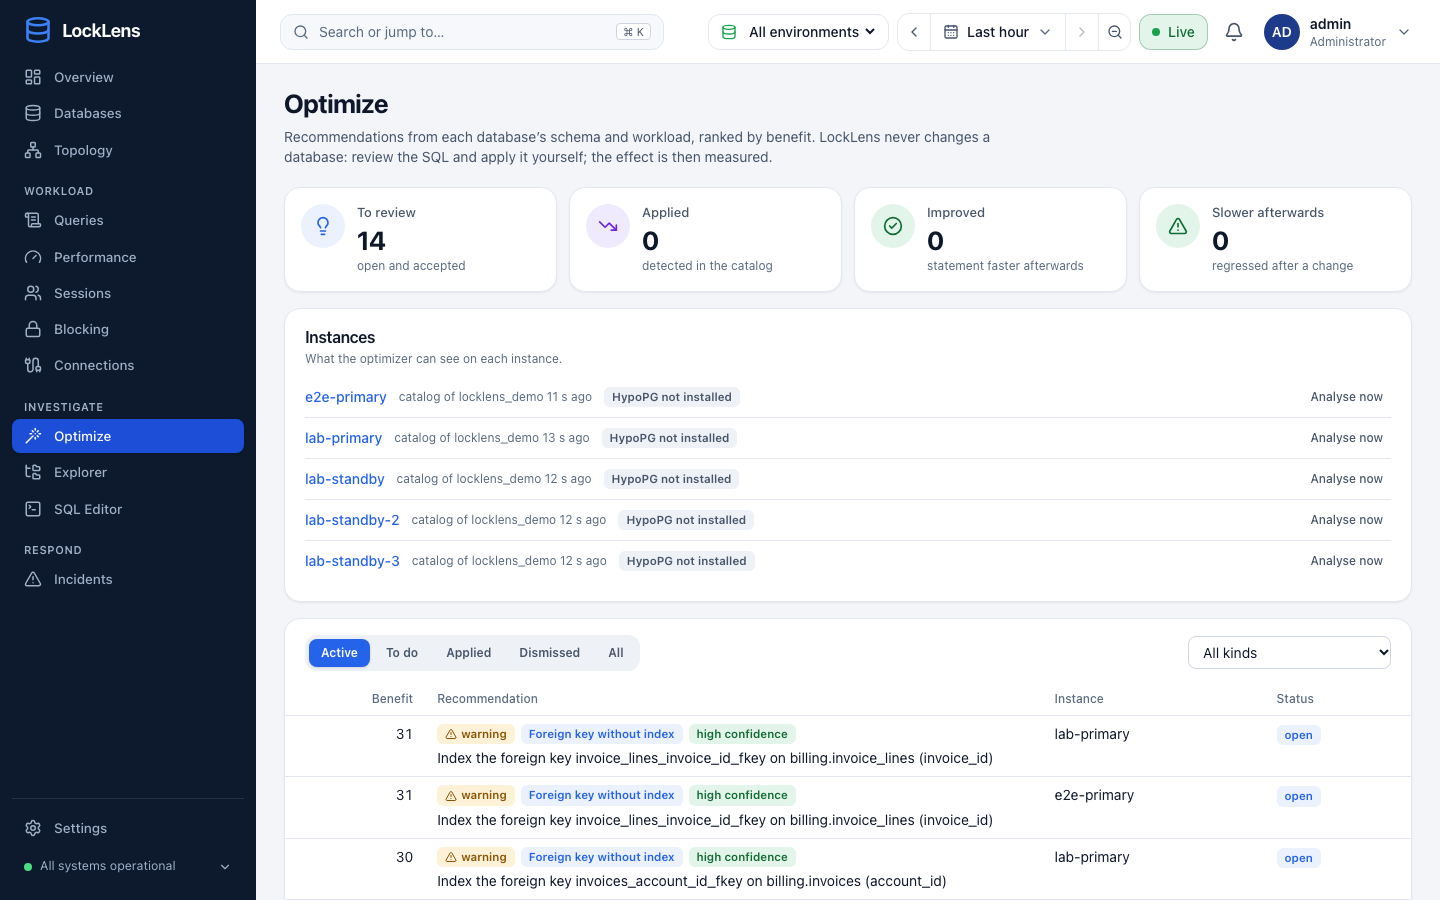
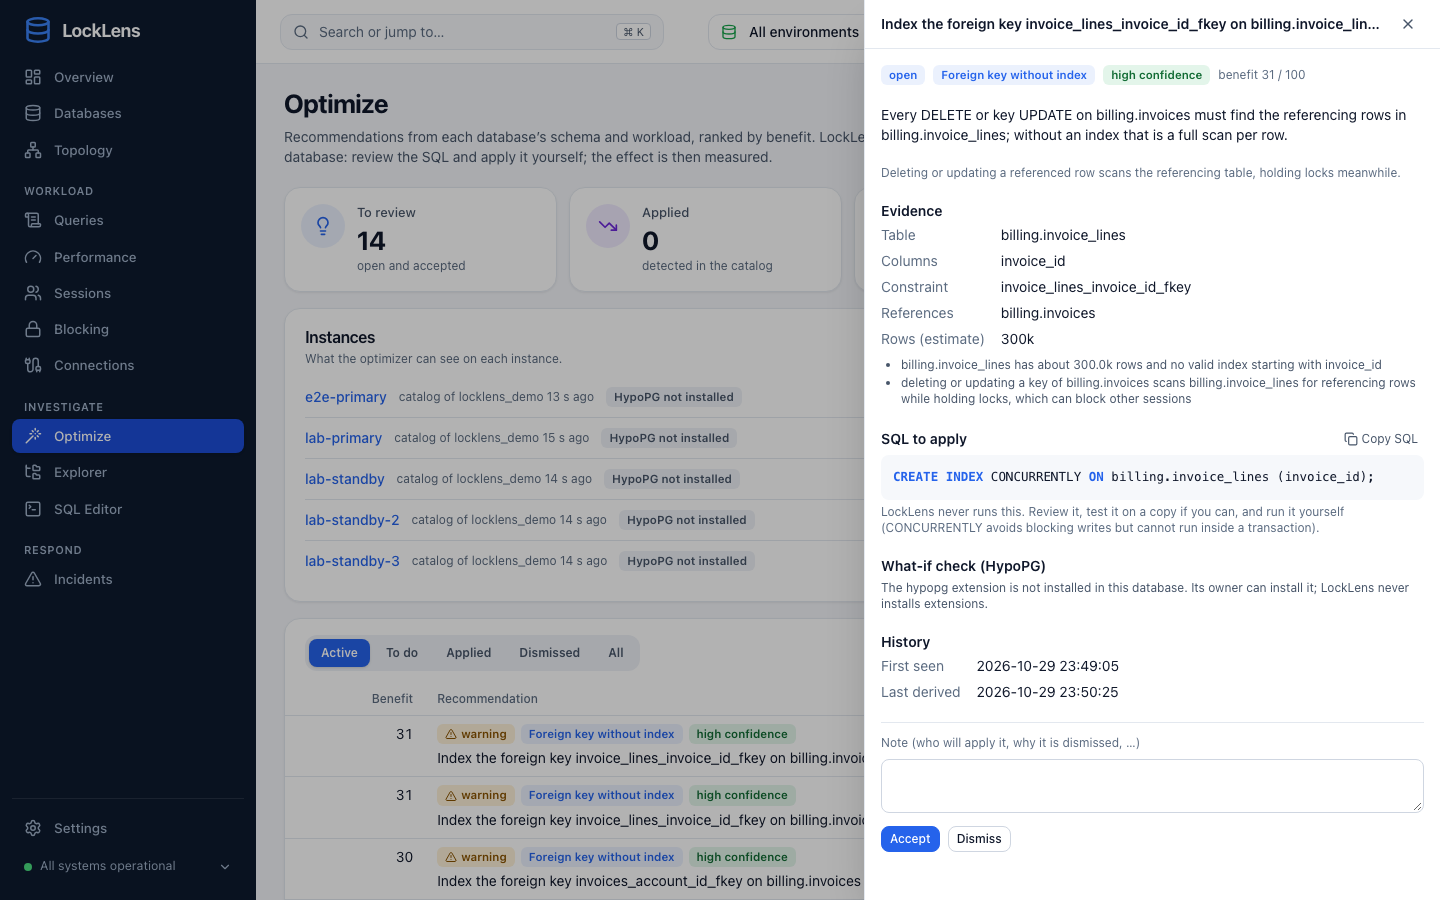
| Optimize | Recommendations from each database's schema and workload, analysed with PostgreSQL's own parser: missing and redundant indexes, foreign keys without an index, invalid indexes, stale statistics, row misestimates, spills to disk, statement shapes that perform badly · ranked by benefit with evidence and the SQL to apply (LockLens never changes the database) · optional what-if checks with hypothetical indexes (HypoPG) · applied changes detected and measured before and after |
| Explore (opt-in) | Browse schemas, tables, views, functions, types, indexes, and triggers · preview rows · read-only SQL editor with an execution-plan graph — never with an administrative role |
| Team | Users with roles: administrators manage everything, operators also preview rows and run read-only SQL, viewers only read · add an instance by pasting one connection string |
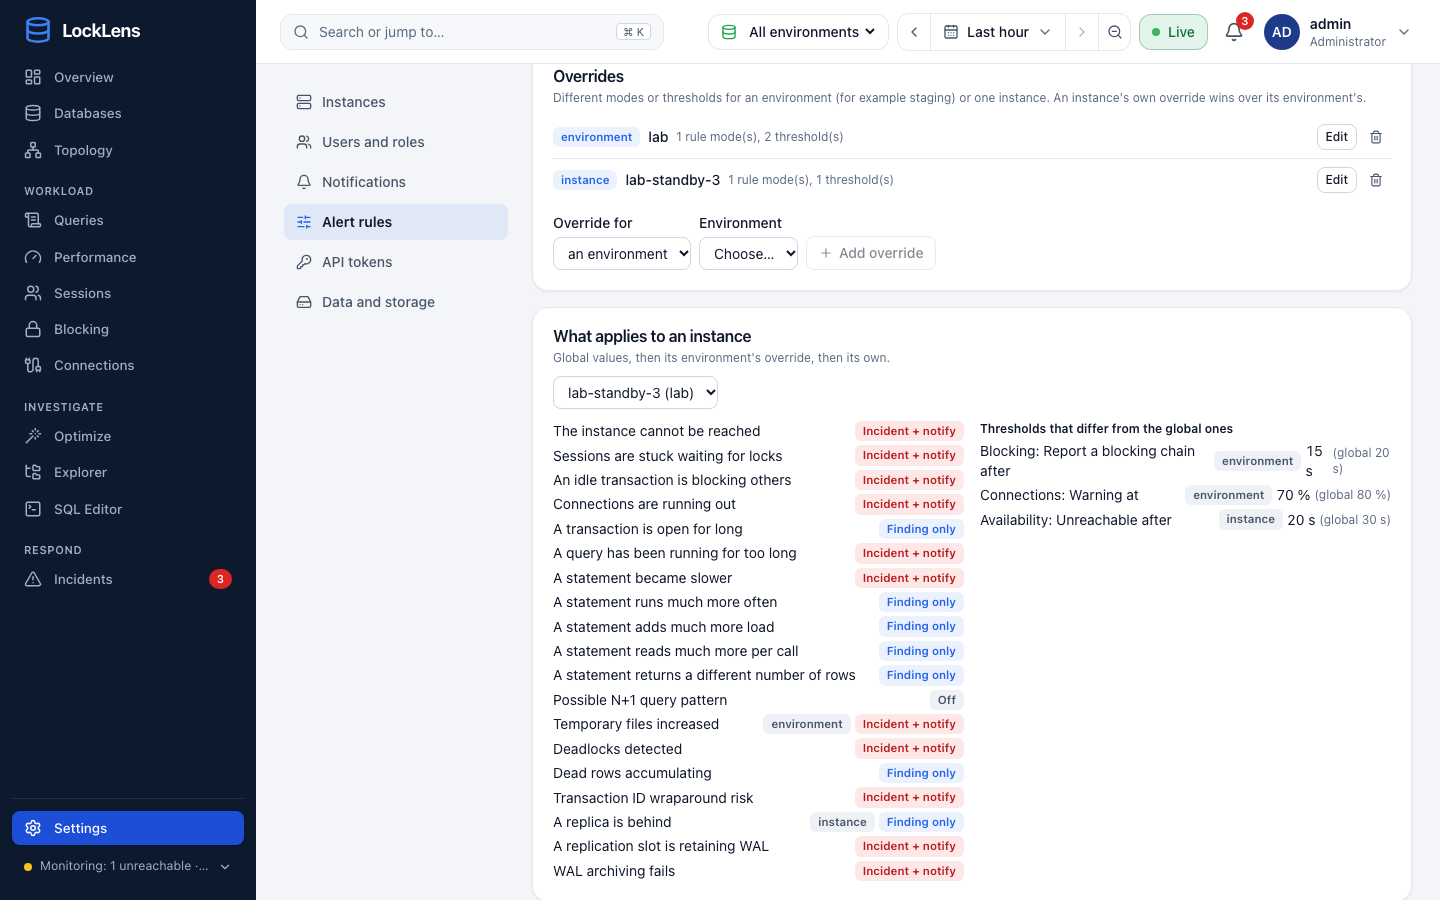
| Alert | Each rule opens incidents, reports findings only, or is off — globally, per environment, or per instance, with thresholds overridden the same way · instance-unreachable alerts · notifications to Slack, webhooks, email, and Prometheus Alertmanager, filtered by rule and instance, with escalation tiers, reminders, silences, and maintenance windows |
| Integrate | Prometheus metrics of every instance (/metrics/targets, token-protected) with ready alerting rules and a Grafana dashboard · OpenTelemetry push · read-only API tokens |
| Operate | TimescaleDB store: time-partitioned, compressed history (plain PostgreSQL works too) · incident export to JSON and standalone HTML · Prometheus /metrics · health and readiness probes · retention · bounded buffering when the store is down · several servers on one store for availability |
 |
 |
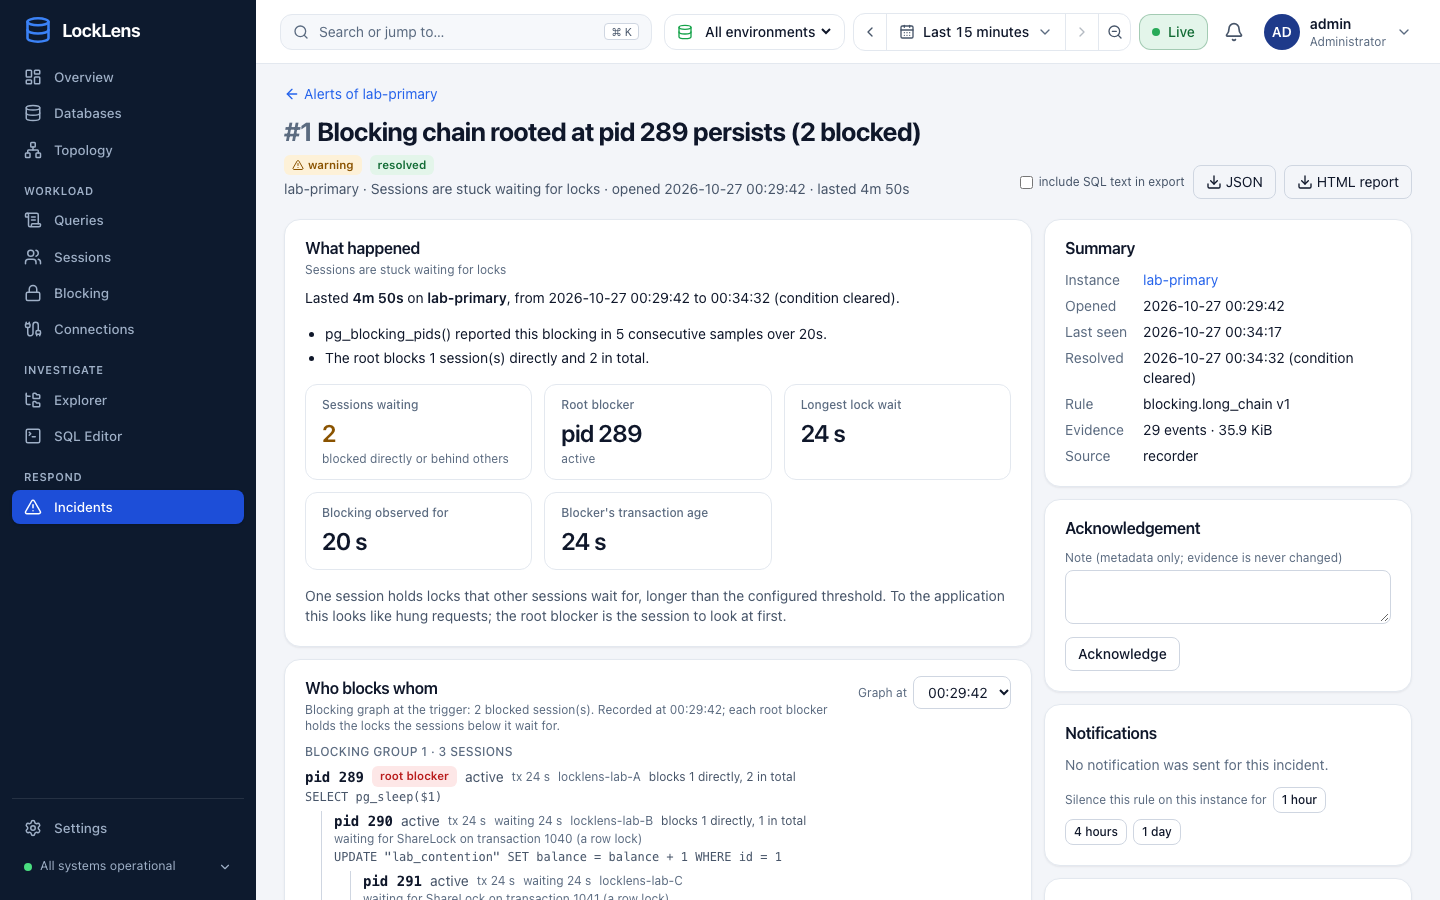 |
| Instance overview | Database load (active session sampling) | Incident with its evidence |
 |
 |
 |
| Queries by type | Explorer | SQL editor and plan |
 |
 |
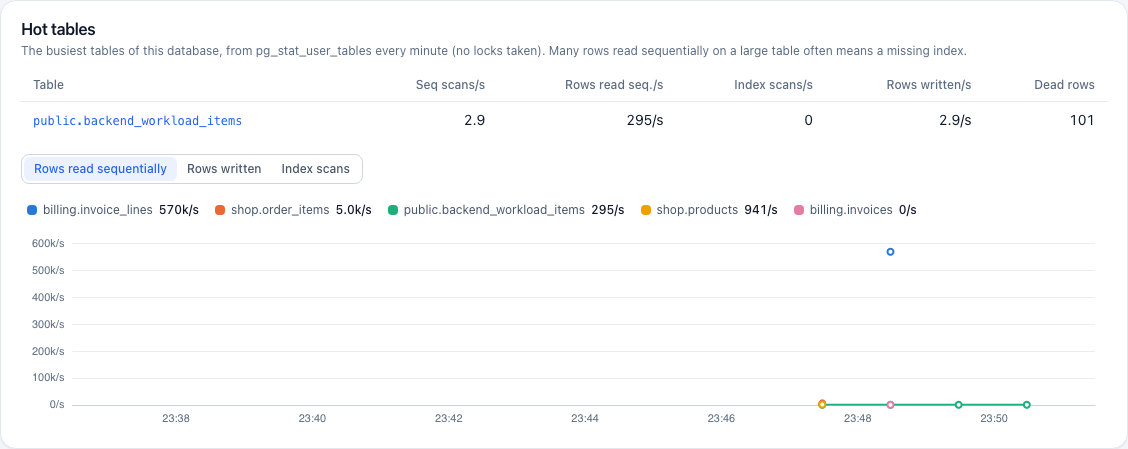 |
| Optimize | A recommendation and its SQL | Hot tables |
 |
 |
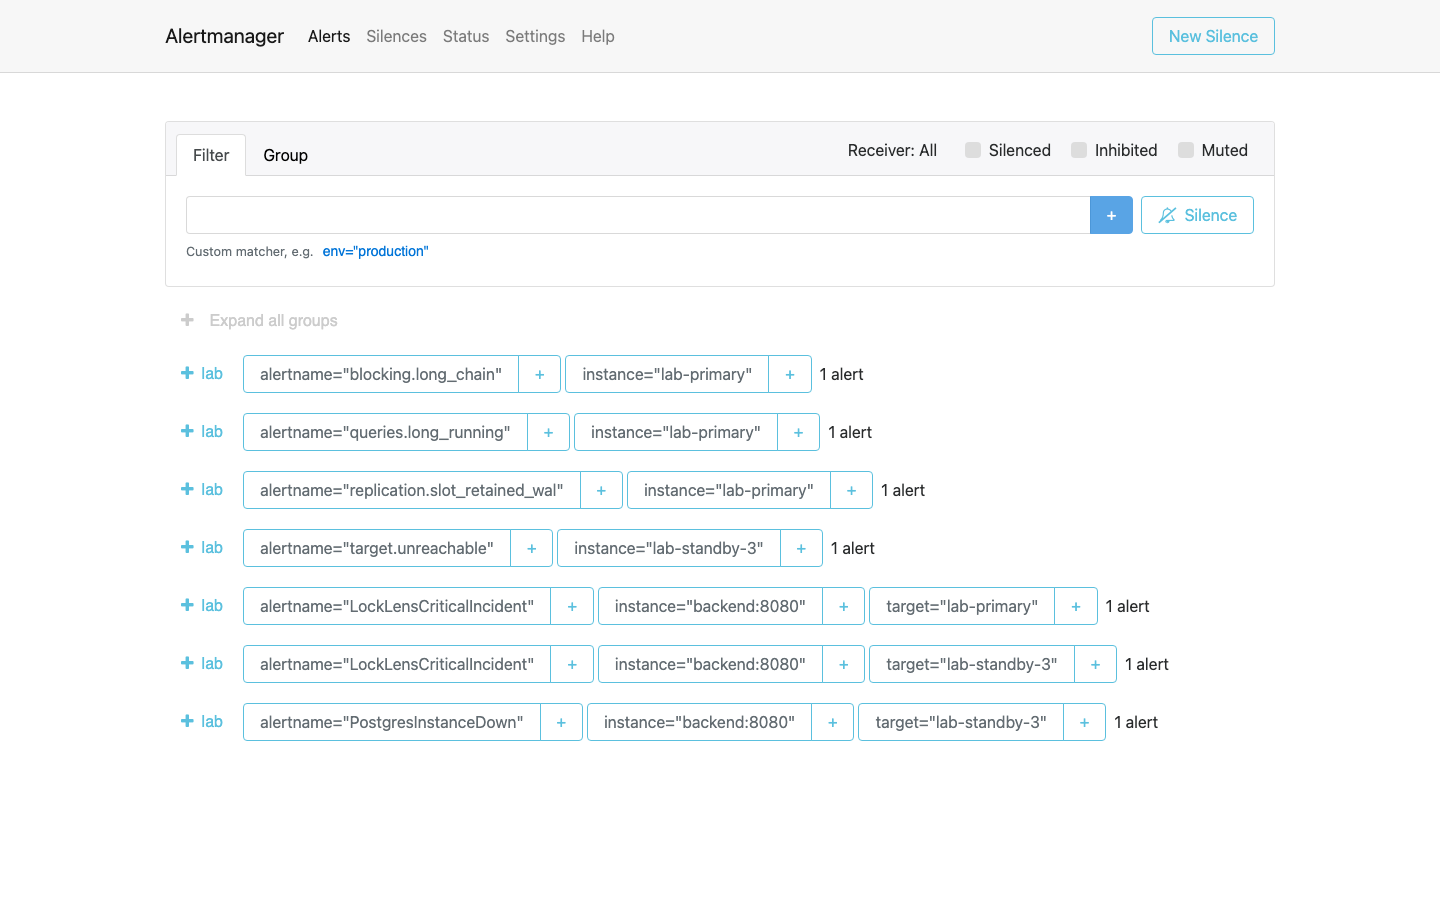 |
| Alert rules and overrides | Instance unreachable | Alertmanager |
Quick start
Try the demo lab
Requires Docker with Compose v2 and make. It starts LockLens with a
PostgreSQL primary, three streaming standbys, and a background workload, all on
127.0.0.1 with fake, local-only credentials.
git clone https://github.com/Huy-8bit/locklens.git && cd locklens
make lab-up                      # first build takes a few minutes
Open http://127.0.0.1:8080 and sign in as admin / locklens-lab-admin.
Then create a problem and watch LockLens explain it:
make lab SCENARIO=chain          # an A → B → C blocking chain for 3 minutes
make lab-list                    # all scenarios
make lab-down                    # remove the lab and its data
See the quickstart for every scenario and what to expect.
Run LockLens from the repository
Starts the backend, the frontend, and LockLens' own store; add your databases in the UI.
make up                          # creates deploy/.env with random secrets and prints the admin password
make down                        # stop (data is kept)
Run the Docker image
LockLens stores its history in its own PostgreSQL database (the store), never in the databases it monitors.
export LOCKLENS_MASTER_KEY="$(openssl rand -base64 32)"   # keep it: it encrypts stored connection strings

docker network create locklens
docker run -d --name locklens-store --network locklens \
  -e POSTGRES_USER=locklens -e POSTGRES_PASSWORD=change-me -e POSTGRES_DB=locklens \
  -v locklens-store:/var/lib/postgresql timescale/timescaledb:2.30.2-pg18 \
  postgres -c shared_preload_libraries=timescaledb -c timescaledb.telemetry_level=off

docker run -d --name locklens-backend --network locklens \
  -e LOCKLENS_STORE_DSN='postgres://locklens:change-me@locklens-store:5432/locklens?sslmode=disable' \
  -e LOCKLENS_MASTER_KEY \
  -e LOCKLENS_ADMIN_PASSWORD='choose-a-long-password' \
  -e LOCKLENS_COOKIE_SECURE=false \
  -e LOCKLENS_TRUSTED_PROXIES=locklens-frontend \
  johnnynguyen882/locklens-backend:latest

docker run -d --name locklens-frontend --network locklens -p 127.0.0.1:8080:8080 \
  -e LOCKLENS_BACKEND_URL=http://locklens-backend:8080 \
  johnnynguyen882/locklens-frontend:latest
The frontend serves the UI and proxies /api/ to the backend, so only the
frontend is published. Use the same released tag (X.Y.Z) for both images in
production, and put LockLens behind HTTPS before exposing it beyond your
machine (then drop LOCKLENS_COOKIE_SECURE). See deployment
and configuration.
Connect your databases
Monitored servers need PostgreSQL 14 or later and a login role with
pg_read_all_stats (no superuser). pg_stat_statements is optional but
recommended.
CREATE ROLE locklens_observer LOGIN PASSWORD '…';
GRANT pg_read_all_stats TO locklens_observer;
Then paste its connection string in Settings → Instances → Add instance. You can also
paste a superuser connection string: LockLens shows the statements it would run,
creates locklens_monitor and locklens_reader after you confirm, and stores
only those. Standbys reuse the roles of their primary.
Build from source
Requires Go 1.26+, a C compiler (cgo, for PostgreSQL's SQL parser; CGO_ENABLED=0 builds without statement analysis), and Node.js 24.15+ (or 22.22.2+).
make build                       # web/dist (the UI) and bin/locklens (API server and CLI)
bin/locklens server              # needs LOCKLENS_STORE_DSN, LOCKLENS_MASTER_KEY, LOCKLENS_ADMIN_PASSWORD
make image                       # the two Docker images: locklens-backend:local, locklens-frontend:local
The backend serves only the API; serve the UI with the frontend image or, for
development, with make dev (Vite proxies /api/ to a local backend).
Command line
The CLI works directly against a database, without the server:
export LOCKLENS_DSN='postgres://[email protected]:5432/app?sslmode=verify-full'
locklens doctor                              # connectivity, version, privileges
locklens inspect                             # blocking chains and long transactions
locklens watch                               # live view, refreshed every 2 s
locklens snapshot save --out incident.json   # capture now, analyse offline later
Blocking chains (blocker -> waiter)
  Incident 1: root blocker pid 116 blocks 1 directly, 2 in total
    pid 116  idle in transaction  tx 3s  user=demo_app  app=locklens-demo-A  blocks 1 directly, 2 in total
    └─ pid 117  active  lock wait 3s  tx 3s  user=demo_app  app=locklens-demo-B
       └─ pid 118  active  lock wait 3s  tx 3s  user=demo_app  app=locklens-demo-C
Reference: CLI.
How it works
                              backend (locklens server)                                frontend (nginx)
PostgreSQL targets ──read-only──► collectors ──► write queue ──► monitoring store (PostgreSQL / TimescaleDB)
                                      │                                │
                                      ▼                                ▼
                           rules + incident recorder         REST API + live events ◄──/api/── web UI ◄── browser
                                      │
                                      ▼
                           notifications (Slack, webhook, email)
One worker per target runs its collectors on a schedule under a global concurrency limit. Counters become rates at ingest; restarts, statistics resets, and gaps are stored as unknown, never as zero. More in architecture and collectors.
Security and privacy
- Connection strings are encrypted at rest (AES-256-GCM) and never returned by the API or shown in the UI, logs, or exports.
- Users with roles (administrator, operator, viewer), bcrypt, server-side
sessions,
HttpOnly+SameSite=Strictcookies, and CSRF tokens. Listens on 127.0.0.1 by default. - SQL text is collected by default and can be switched off per instance.
- Row browsing and the SQL editor are off by default, limited to operators and administrators, never use an administrative role, and run inside read-only transactions. A superuser connection string is used once to create least-privilege roles and is never stored.
Details in security. To report a vulnerability, see SECURITY.md.
Documentation
| Getting started | Quickstart · Configuration · UI guide · Troubleshooting |
| Concepts | Architecture · Collectors · PostgreSQL observation · Blocking graph · Query analysis · Query performance intelligence · Query optimizer · Rules · Incidents · Notifications · Explorer and SQL |
| Operations | Integrations (Prometheus, Alertmanager, Grafana, OTLP) · Deployment · Storage and retention · Security · Limitations |
| Reference | HTTP API · CLI · Snapshot format |
| Development | Development · Testing · Test report |
Contributing
Contributions are welcome. Read CONTRIBUTING.md first; the usual loop is:
make dev            # Go API, Vite dev server, and lab databases
make check          # gofmt, vet, Go unit tests with the race detector
make web-check      # frontend typecheck, lint, unit and accessibility tests
make test-integration && make e2e   # real PostgreSQL and browser tests (slower)
Repository layout: backend/ (Go, with its Dockerfile), web/ (React, with
its Dockerfile and nginx config), deploy/ (Compose files),
demo/ (lab fixtures), tests/e2e/ (CLI, server, and browser tests),
docs/.
Project status
LockLens is young. The test suites pass against PostgreSQL 14 through 18 in a local lab (test report), but it has not yet been run in production environments, and performance figures in the docs are lab measurements, not guarantees. Known gaps: limitations.
License
MIT © The LockLens contributors