
EndoTheDev/OMeter
EndoTheDev/OMeter has 29 GitHub stars and 5 forks. GitHot measured 0 stars in 24 hours. Last checked 2026-11-14 16:29 UTC. Last push 2026-11-11.
What you can do
- 🌐 Live dashboard — auto-published benchmark trends at EndoTheDev.github.io/OMeter with filtering, sorting, and charts
- 📋 List models from local and cloud Ollama endpoints
- 📊 Rich tables with sorting by name, size, context length, modification date, TTFT, or TPS
- 🔃 Reverse sort with --reverse
Measured star growth
- in 24h
- 0
- in 7 days
- Collecting history
- in 15 days
- Collecting history
- in 1 month
- Collecting history
Net star changes over overlapping periods, not daily totals. Missing measurements are left blank. Stars measure attention, not software quality.
About
Benchmark and compare Ollama models across local and cloud endpoints with rich, sortable tables.
Developer ToolsREADME.md
OriginalOMeter


Benchmark and compare Ollama models across local and cloud endpoints with rich, sortable tables.
Features
- 🌐 Live dashboard — auto-published benchmark trends at EndoTheDev.github.io/OMeter with filtering, sorting, and charts
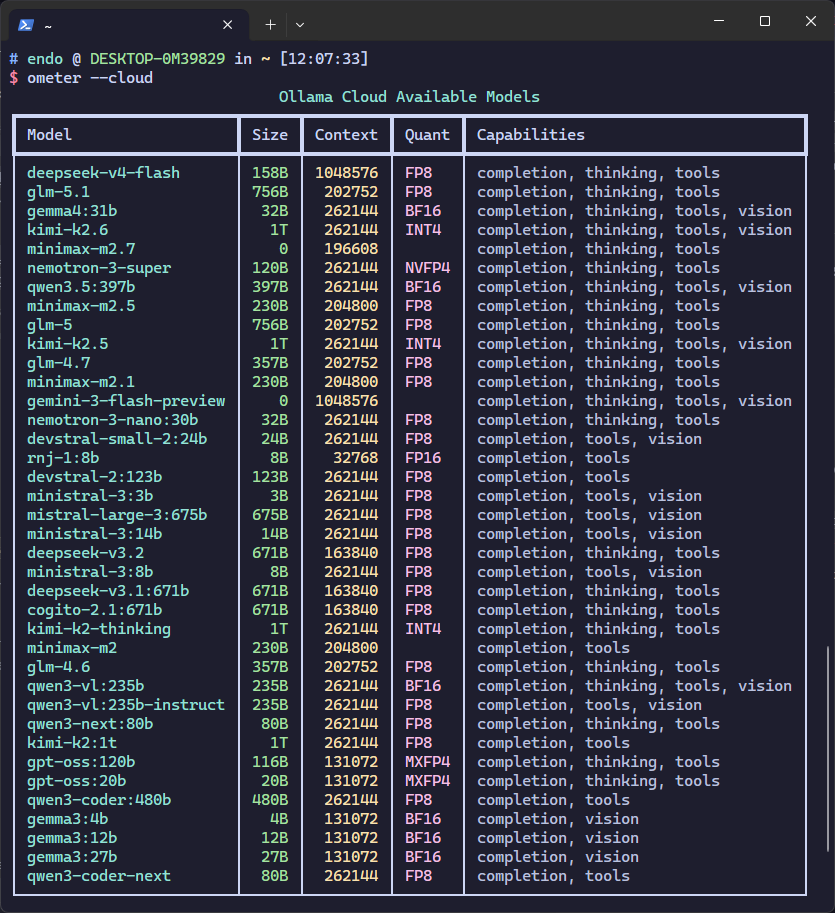
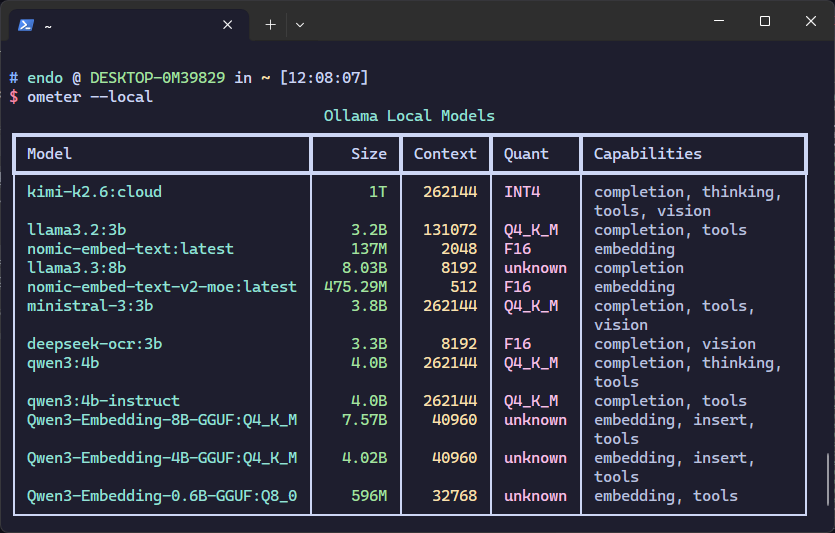
- 📋 List models from local and cloud Ollama endpoints
- 📊 Rich tables with sorting by name, size, context length, modification date, TTFT, or TPS
- 🔃 Reverse sort with
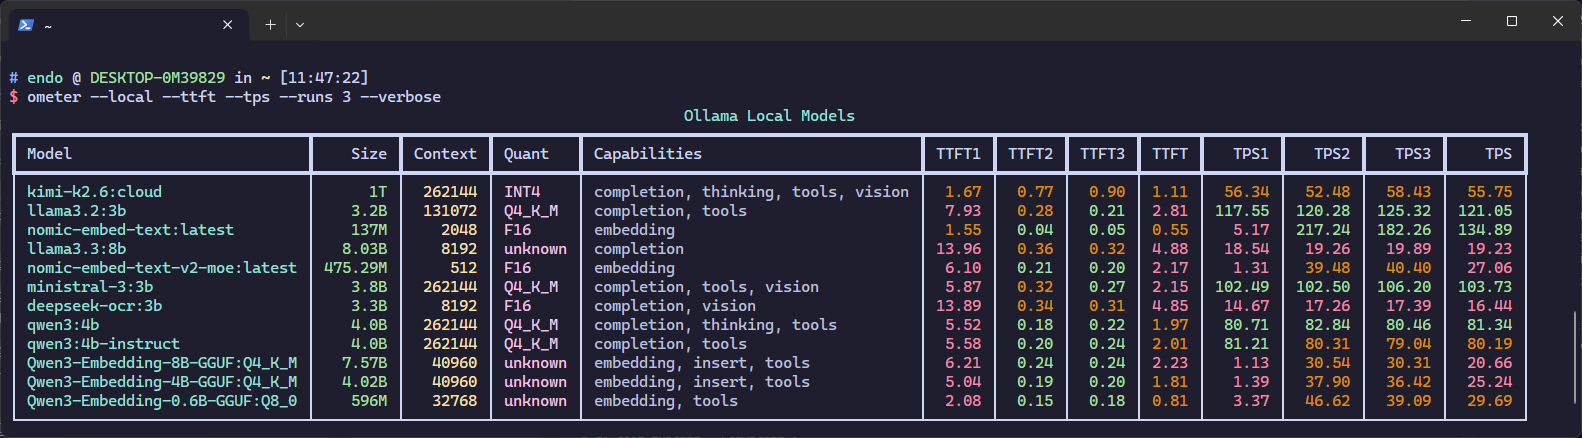
--reverse - ⏱️ Benchmark time-to-first-token (TTFT) and tokens-per-second (TPS)
- 🔍 Model filtering by exact name or family match (e.g.
llama3matchesllama3:latest) - 📤 Export results to JSON or CSV (stdout or file)
- 🧪 Multi-prompt averaging — 3 prompts per model for robust stats (or use
--promptsfor custom prompts) - 🧬 Embedding model support — automatically uses
/api/embedfor local embedding models - 🎨 Beautiful CLI powered by
rich+InquirerPy - 📜 Benchmark history — runs are auto-saved to a local SQLite database and merged into the public dashboard history; view past results with
--history - 📈 Performance trends — arrows (↑↓→) automatically appear inline next to TTFT/TPS values when historical data is available
Preview
Cloud model listing — ometer --cloud
Local model listing — ometer --local
Benchmark with per-run breakdown — ometer --local --ttft --tps --verbose --runs 2 --parallel 1
Installation
Install as a uv tool (recommended)
From the project directory:
uv tool install .
Or install directly from GitHub:
uv tool install git+https://github.com/EndoTheDev/OMeter.git
This installs ometer and ometer globally, so you can run them from anywhere.
Update:
uv tool install --upgrade ometer
Uninstall:
uv tool uninstall ometer
Install into a project
uv add ometer
Or via pip:
pip install ometer
Usage
Show the version:
ometer --version
List models with an interactive menu:
ometer
List local models only:
ometer --local
List cloud models only:
ometer --cloud
List both local and cloud models:
ometer --local --cloud
Benchmark time-to-first-token and tokens-per-second:
ometer --cloud --ttft --tps
Benchmark models in parallel for faster results (default is 1 — max 10):
ometer --cloud --ttft --tps --parallel 4
Show per-run breakdown in the table:
ometer --cloud --ttft --tps --verbose
Run with fewer benchmark prompts for faster results (default is 3 — max 3):
ometer --cloud --ttft --tps --verbose --runs 1
ometer --cloud --ttft --tps --verbose --runs 2
Use custom benchmark prompts instead of the built-in defaults (overrides --runs):
ometer --local --ttft --tps --prompts "why is the ocean salty?"
ometer --local --ttft --tps --prompts prompts.txt
Pass a filename to read one prompt per line (skips blank lines, strips whitespace).
Filter to specific models (exact name or family match, accepts multiple names):
ometer --model llama3 --ttft --tps
ometer --local --model llama3.2:3b llama3.3:8b --ttft --tps
Sort results by model size (largest first) or name (A–Z):
ometer --cloud --sort size
ometer --cloud --sort name
Sort by context length (largest first) or modification date (newest first):
ometer --cloud --sort ctx
ometer --local --sort modified
Sort by benchmark metrics — TTFT (lowest/best first) and TPS (highest/best first):
ometer --cloud --ttft --tps --sort ttft
ometer --cloud --ttft --tps --sort tps
Reverse any sort order (worst first, Z–A, oldest first):
ometer --cloud --sort name --reverse
ometer --cloud --ttft --tps --sort tps --reverse
Export results as JSON (to stdout or a file):
ometer --cloud --ttft --tps --json
ometer --cloud --ttft --tps --json results.json
Export results as CSV (to stdout or a file):
ometer --local --ttft --tps --csv
ometer --local --ttft --tps --csv results.csv
View benchmark history (latest run per model):
ometer --history
Show all historical runs with full details:
ometer --history --verbose
Filter history to specific models:
ometer --history --model llama3
Export history as JSON or CSV:
ometer --history --json
ometer --history --csv history.csv
Performance trend arrows (↑ improved, ↓ degraded, → stable within 5%) appear inline next to TTFT and TPS values automatically. No flag needed.
See all options:
ometer --help
Web Dashboard
Benchmark data is automatically merged into the live dashboard after each scheduled GitHub Actions run:
The dashboard supports filtering by capability, context window, parameter size, and model name, plus sorting and time-series charts once multiple runs have been collected.
Environment Variables
OMeter looks for a .env file in this order, using the first one found:
./.env— current working directory (project-specific)~/.env— home directory (global fallback)~/.config/ometer/.env— dedicated config directory (recommended for global installs)
Create the config directory and file:
mkdir -p ~/.config/ometer
cat > ~/.config/ometer/.env << 'EOF'
OLLAMA_CLOUD_BASE_URL=https://ollama.com
OLLAMA_CLOUD_API_KEY=your_api_key_here
OLLAMA_LOCAL_BASE_URL=http://localhost:11434

# Number of benchmark prompts per model (1–3, default 3). Ignored when --prompts is used.
OMETER_RUNS=3

# Number of models benchmarked in parallel (default 1, max 10)
OMETER_PARALLEL=1
EOF
The cloud API key is only needed for benchmarking cloud models.
Benchmark results are auto-saved to a local SQLite database. The database path can be overridden:
export OMETER_HISTORY_DB=/custom/path/history.db
By default it lives at ~/.local/share/ometer/ometer_history.db.
OMeter has six modules that handle distinct concerns:
User ──► cli.py ──► config.py ──► api.py ──► display.py
           │             │            │            │
      arg parsing    .env load    HTTP calls    rich tables
      mode resolve   validate     benchmark     color thresholds
      interactive     clamp       stream        live updates
      export             │            │            │
         │               │            │        history.py
         │               │            │            │
     export.py           │            │       SQLite DB
         │                              │
    JSON/CSV output                auto-save + trend
- cli.py — Entry point, argument parsing, interactive model selection, export dispatch
- config.py — Hierarchical
.envloading, settings validation and clamping - api.py — HTTP communication with Ollama, TTFT/TPS measurement
- display.py — Rich terminal UI, live table updates, percentile-based color coding
- export.py — JSON/CSV export formatting and file output
- history.py — SQLite-backed benchmark persistence, trend computation, history queries
For detailed documentation, see the docs directory:
- Architecture — Module decomposition, request lifecycle, data entities
- Benchmarking Pipeline — TTFT/TPS methodology, concurrency, color thresholds
- Configuration — Environment variables, CLI flags, loading order
- API Reference — Ollama endpoints, function reference, BenchmarkResult
- Development — Dev setup, running tests, project structure, conventions
License
MIT License — see LICENSE for details.