
Dicklesworthstone/process_triage
Dicklesworthstone/process_triage has 29 GitHub stars and 7 forks. GitHot measured 0 stars in 24 hours and 0 in 7 days. Last checked 2026-11-15 06:56 UTC. Last push 2026-11-04.
Measured star growth
- in 24h
- 0
- in 7 days
- 0
- in 15 days
- Collecting history
- in 1 month
- Collecting history
Net star changes over overlapping periods, not daily totals. Missing measurements are left blank. Stars measure attention, not software quality.
About
Bayesian process classifier that detects abandoned/zombie processes and recommends safe cleanup actions
Developer ToolsREADME.md
Originalpt

curl -fsSL https://raw.githubusercontent.com/Dicklesworthstone/process_triage/main/install.sh | bash
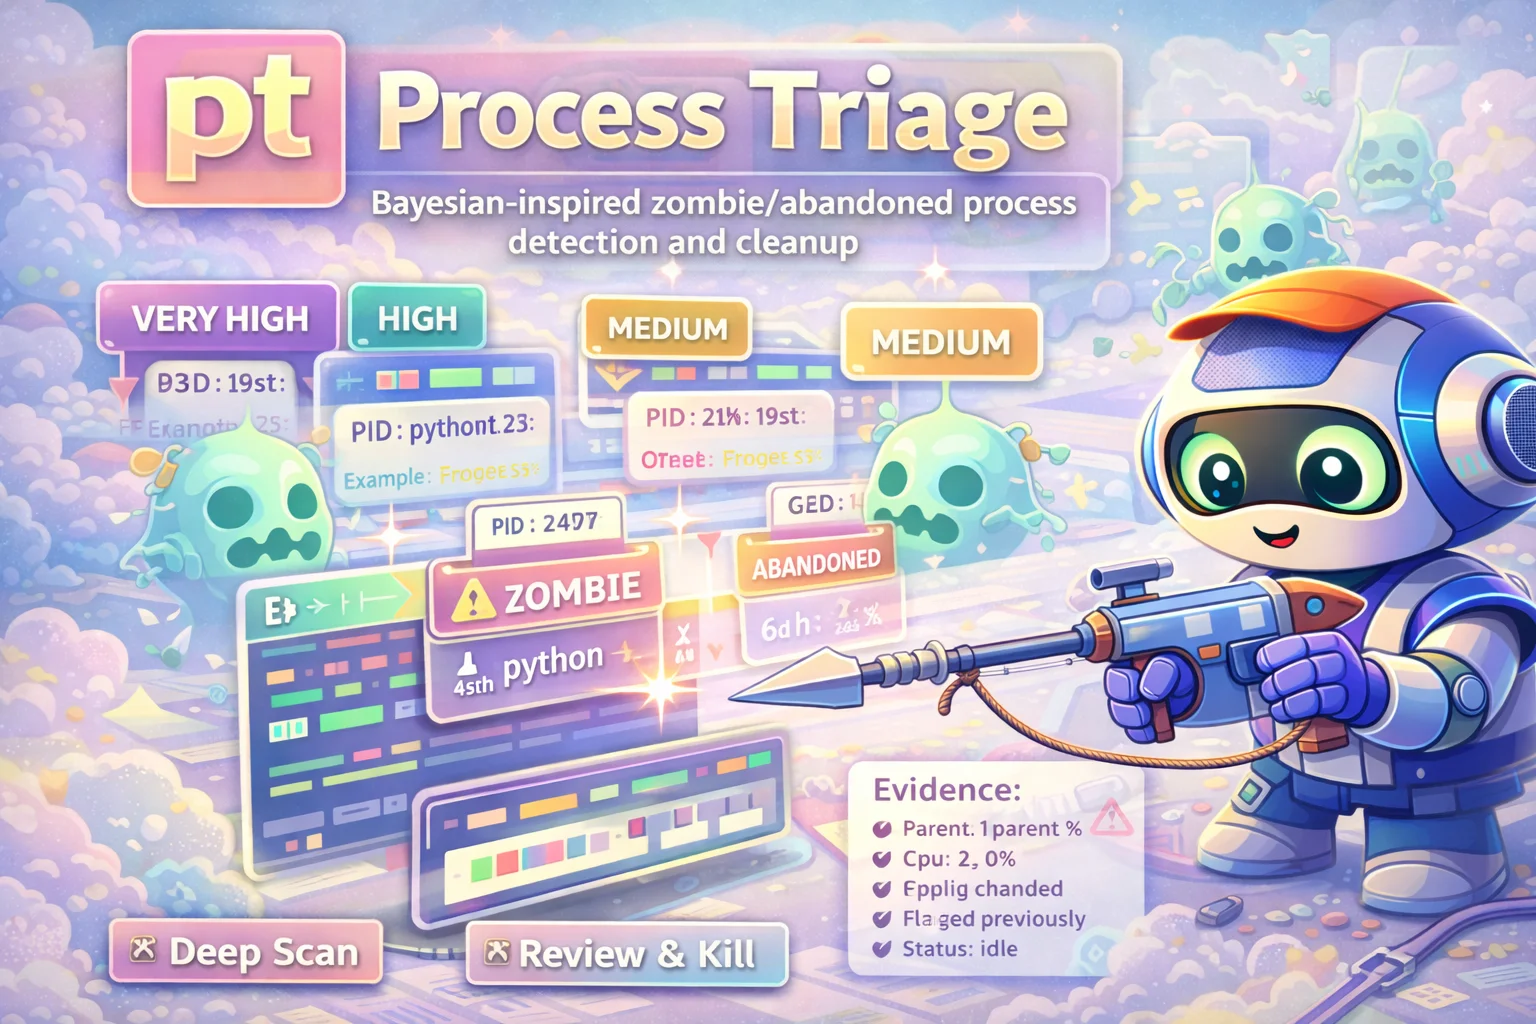
pt finds abandoned processes and helps you get rid of them safely. It scores every process with a Bayesian posterior (CPU, age, orphan status, terminal, state, plus process lineage and shared resources on Linux), refuses to touch live infrastructure (multiplexers, SSH masters, databases, agent sessions, your own shell), and tells you why each candidate looks abandoned. It is deliberately conservative: most candidates come back as review or pause, and a kill recommendation needs overwhelming evidence.
The Problem
Development machines accumulate abandoned processes. Stuck bun test workers. Forgotten next dev servers from last week's branch. Orphaned Claude/Copilot sessions. Build processes that completed but never exited. They silently eat RAM, CPU, and file descriptors until your 64-core workstation grinds to a halt.
Manually hunting them with ps aux | grep is tedious, error-prone, and teaches you nothing about whether killing something will break something else.
The Solution
pt automates detection with statistical inference, skips protected processes before scoring, and presents ranked candidates with the evidence behind each score (pt opens the TUI; pt agent plan gives the same ranking as JSON):
 SCORE  ACTION  PID     AGE    CPU   MEM     COMMAND
   85   pause   412233  260h   0.0%  12MB    python3 -m http.server 61493 --bind 127.0.0.1   (orphan)
   83   review  90121   211h   0.2%  134MB   chrome --headless ...                            (orphan)
   46   review  48758   1h     0.0%  1MB     sleep 8888                                       (orphan)
        spare   1204            protected: builtin.service_daemon (postgres)
The score is 100 × P(abandoned or zombie). The action is the one with the lowest expected loss under the policy's loss matrix, which makes kill rare by design (see the 8 actions).
Why pt?
| Feature | ps aux | grep |
htop |
pt |
|---|---|---|---|
| Finds abandoned processes automatically | - | - | Yes |
| Bayesian confidence scoring | - | - | Yes |
| Explains why a process is suspicious | - | - | Yes |
| Estimates blast radius before kill (Linux) | - | - | Yes |
| Learns from your past decisions | - | - | Yes |
| Built-in protection for live infrastructure | - | - | Yes |
| Fleet-wide planning over SSH | - | - | Yes |
| Guardrails for automation (posterior, RSS, kill caps, live pre-checks) | - | - | Yes |
| Safe kill signals (SIGTERM → SIGKILL) | - | - | Yes |
| Interactive TUI | - | Yes | Yes |
Quick Example
# Install (one-liner)
curl -fsSL https://raw.githubusercontent.com/Dicklesworthstone/process_triage/main/install.sh | bash

# Interactive mode — scan, review, confirm, kill
pt

# Scored candidates without acting (JSON; what agents and scripts use)
pt agent plan --format json

# Raw process snapshot / raw deep /proc records (no scoring)
pt scan
pt deep

# Compare two sessions to see what changed
pt diff --last

# Shadow mode — record recommendations without acting (calibration)
pt shadow start
Design Philosophy
1. Conservative by default. No process is ever killed without explicit confirmation. Robot mode is off unless enabled in policy, needs --yes, a posterior of at least min_posterior (0.95) for the event that justifies the action, per-action and total RSS limits, a kill cap, and live pre-checks (identity, protection, session safety, data-loss gate) immediately before acting.
2. Transparent decisions. Every recommendation comes with its evidence: which features contributed, how much each shifted the posterior, and the expected loss of every action (pt agent explain --galaxy-brain, the TUI detail pane, pt report --include-ledger).
3. Protection before scoring. Terminal multiplexers, SSH ControlMasters, session infrastructure, interactive shells, database/web servers and their workers, pt's own caller chain, systemd/container-supervised services, and on macOS system and app-bundle processes are never candidates. AI agent CLIs are only ever shown for review.
4. Real processes in tests. Parsers, collectors and the action layer are tested against real /proc and real spawned processes; a live read-only fleet gate (scripts/fleet_reality_e2e.py) checks plans on real hosts. Some higher-level tests use synthetic process builders.
How It Actually Works
The Inference Pipeline
Every process on your system passes through a five-stage pipeline:
          ┌─────────┐     ┌─────────┐     ┌─────────┐     ┌─────────┐     ┌─────────┐
 /proc ──→│ Collect │────→│  Infer  │────→│ Decide  │────→│   Act   │────→│ Report  │
          └─────────┘     └─────────┘     └─────────┘     └─────────┘     └─────────┘
           25 modules      41 modules      40 modules      13 modules      5 formats
Collect takes a process snapshot (ps plus exact start times from /proc or proc_pidinfo), cgroup placement, and on Linux process lineage and a shared-resource graph (listeners, sockets, lockfiles).
Infer computes a 4-class posterior (useful, useful-but-bad, abandoned, zombie) by naive Bayes over CPU occupancy, age, orphan status, controlling terminal and kernel state, with each term clipped and tempered so no single signal dominates. On Linux, lineage and shared-resource evidence add terms; signature matches and your own past verdicts (pt agent label, TUI kills) set the prior. The TUI also uses deep network/I/O evidence when it collects it.
Decide picks the action with the lowest expected loss under the policy's loss matrix, among the actions feasible for the process state, then applies protection, supervision and policy enforcement. Rather than a binary kill/spare, it evaluates Keep, Renice, Pause, Freeze, Throttle, Quarantine, Restart and Kill.
Act re-verifies identity (exact start time; a pidfd on Linux) and runs live pre-checks immediately before each signal, then escalates SIGTERM → SIGKILL. Renice, pause/resume and kill run on Linux and macOS; freeze, throttle and quarantine are Linux-only and refused unless the target owns its cgroup. Failures are reported; there is no automatic rollback.
Report produces JSON, TOON (token-optimized), Markdown, HTML reports, or the interactive TUI, with the evidence ledger and Bayes factors.
Experimental Library Models
The workspace also ships these models as tested library code. None of them is wired into agent plan, the TUI, or agent apply yet; they are candidates to be added only where they measurably improve decisions:
| Model | What It Detects | How It Works |
|---|---|---|
| BOCPD | Sudden behavior changes | Bayesian Online Change-Point Detection with run-length recursion |
| HSMM | State transitions with duration | Hidden Semi-Markov Model with Gamma-distributed dwell times |
| IMM | Regime switching | Interacting Multiple Model filter bank with Markov transitions |
| Kalman | Trend estimation | Scalar Kalman filter + Rauch-Tung-Striebel backward smoother |
| CTW | Sequential prediction | Context Tree Weighting with Krichevsky-Trofimov estimator |
| Hawkes | Burst detection | Self-exciting point process (branching ratio n=alpha/beta) |
| EVT/GPD | Tail risk | Extreme Value Theory with Generalized Pareto Distribution |
| Conformal | Distribution-free coverage | Mondrian split conformal with blocked + adaptive variants |
| Martingale | Anytime-valid testing | Azuma-Hoeffding + Freedman/Bernstein bounds |
| Wasserstein | Distribution drift | 1D earth-mover's distance for non-stationarity detection |
| M/M/1 Queue | Socket stall detection | EWMA-smoothed queue depth with logistic rho estimation |
| Compound Poisson | Bursty I/O | Markov-modulated Levy subordinator |
| Belief Prop | Hierarchical inference | Message-passing over process lineage trees |
| Robust Bayes | Model misspecification | Credal sets + Safe-Bayes eta-tempering |
| BMA | Model uncertainty | Bayesian Model Averaging across competing posteriors |
| Sketches | Heavy hitters | Count-Min Sketch + T-Digest + Space-Saving for pattern detection |
All computation happens in log-domain using numerically stable log-sum-exp to prevent overflow/underflow.
The 8 Actions
Most tools only know "kill" or "don't kill." pt evaluates 8 possible actions ranked by expected loss:
| Action | Signal/Mechanism | Reversible | Executes on |
|---|---|---|---|
| Keep | No action | Yes | - |
| Renice | lower priority (nice), never raises it |
Yes | Linux, macOS |
| Pause | SIGSTOP (resume: SIGCONT) |
Yes | Linux, macOS |
| Freeze | cgroup v2 freezer | Yes | Linux, if the target owns its cgroup |
| Throttle | cgroup CPU quota | Explicit prior metadata | Linux, in an exclusive leaf |
| Quarantine | cpuset controller | Explicit prior metadata | Linux, in an exclusive leaf |
| Restart | via the supervisor | Partial | not executable yet (planned, e.g. for a zombie's parent); apply reports it as failed |
| Kill | SIGTERM → SIGKILL | No | Linux, macOS |
Why kill is rare. The default loss matrix makes killing a useful process 500 times worse than leaving an abandoned one paused, so kill wins only when P(useful) is below about 0.7% of P(abandoned). The posterior is deliberately conservative, so on real machines idle orphans usually come back as pause or review. Your own verdicts (pt agent label --kill) raise the prior for a command pattern; the loss matrix is configurable in policy.json.
Evidence Collection: What /proc Files Are Parsed
On Linux, pt deep reads 12+ files per process (raw records; the TUI turns network/I/O activity into evidence terms, agent plan does not yet use them):
| File | Data Extracted |
|---|---|
/proc/[pid]/stat |
PID, PPID, state, utime, stime, starttime, vsize, rss, num_threads |
/proc/[pid]/io |
rchar, wchar, syscr, syscw, read_bytes, write_bytes |
/proc/[pid]/fd/ |
Open file descriptors with type (socket, pipe, file, device) |
/proc/[pid]/schedstat |
CPU time, wait time, timeslices |
/proc/[pid]/sched |
Voluntary/involuntary context switches, priority |
/proc/[pid]/statm |
Memory pages (size, resident, shared, text, data) |
/proc/[pid]/cgroup |
cgroup v1/v2 paths, CPU/memory limits |
/proc/[pid]/wchan |
Kernel wait channel (detects D-state processes) |
/proc/[pid]/environ |
Environment variables (for workspace/supervisor detection) |
/proc/net/tcp |
TCP connections with tx_queue/rx_queue depths |
/proc/net/udp |
UDP socket state |
/proc/net/unix |
Unix domain sockets with reference counts |
Critical file detection recognizes 20+ patterns: git locks (.git/index.lock), package manager locks (dpkg, apt, rpm, npm, pnpm, yarn, cargo), SQLite WAL/journal files, database write handles, and generic .lock/.lck files. At apply time the data-loss gate blocks any target holding a regular file open for writing or a file lock; the categorized critical-file rules are not yet attached to plans.
The TUI
The interactive TUI is built on ftui (an Elm-style Model-View-Update framework for terminals):
- Responsive layout: adapts to terminal width with breakpoints at 80/120/200 columns (single-panel, two-pane, three-pane)
- Process table: sortable by score, age, CPU, memory, with live filtering via search input
- Detail panel: expanded evidence view for the selected process including Bayes factors, evidence term glyphs, and decision rationale
- Command palette: fuzzy-searchable action palette for power users
- Inline mode (
pt run --inline): confines the UI to a bottom region, preserving terminal scrollback above
From source: cargo run -p pt-core -- run (the ui feature is on by default).
Session Diffing
pt diff --last compares two scan snapshots and classifies every process into lifecycle transitions:
| Transition | Meaning |
|---|---|
Appeared |
New process since last scan |
Resolved |
Process exited since last scan |
Stable |
Same classification and score |
NewlyOrphaned |
Parent died, process adopted by init |
Reparented |
Process moved to a new parent |
StateChanged |
Classification changed (e.g., Useful → Abandoned) |
OwnershipChanged |
User or group changed |
Each delta includes score_drift (how much the score changed), worsened/improved flags, and continuity confidence.
MCP Server
pt includes a Model Context Protocol server for AI agent integration:
pt-core mcp # Start JSON-RPC 2.0 server over stdio
Available tools:
pt_plan: the same engine, protections and output aspt agent plan --format json.pt_scan: a process listing with signature-match scores.pt_explain: a PID's evidence.pt_history: recent sessions.pt_signaturespt_capabilities
AI agents can use these to query process state, run scans, and make triage decisions without CLI parsing.
Learning Tutorials
pt learn list              # Show available tutorials
pt learn show 01           # Read a tutorial
pt learn verify --all      # Verify completion
Built-in tutorials cover first-run safety, stuck test runners, port conflicts, agent workflow, fleet operations, shadow mode, and deep scanning. pt learn verify smoke-runs each tutorial's commands under a time budget to check they still work.
Installation
Quick Install (recommended)
curl -fsSL https://raw.githubusercontent.com/Dicklesworthstone/process_triage/main/install.sh | bash
Installs pt (bash wrapper) and pt-core (Rust engine) to ~/.local/bin/.
Package Managers
There is no Homebrew formula, Scoop manifest, or winget package for pt yet.
Use the install script above (it works on macOS and Linux, and inside WSL2 on
Windows), or build from source below.
From Source
git clone https://github.com/Dicklesworthstone/process_triage.git
cd process_triage
cargo build --release -p pt-core
ln -s "$(pwd)/pt" ~/.local/bin/pt
Verified Install
# Verify ECDSA signatures + checksums (fail-closed on missing/invalid metadata).
# Pass --verify to bash (a `VERIFY=1 curl ... | bash` prefix only reaches curl).
curl -fsSL https://raw.githubusercontent.com/Dicklesworthstone/process_triage/main/install.sh | bash -s -- --verify
Releases up to v2.1.0 were published without signatures, so a verified install of them fails closed ("does not publish release-signing-public.pem") and installs nothing. pt update verifies by default and says so when it refuses; pt update --no-verify installs unverified on explicit request.
The installer and the pt wrapper pin the release-signing key: a verified install or pt update accepts a release only if its release-signing-public.pem has one of the SHA-256 fingerprints (of the DER public key) listed in TRUSTED_RELEASE_KEY_FINGERPRINTS, currently b5084da80f9652304307fa7c3f965ee7840d3815fd863c2b40f4524e00e2e4ee (first used for v2.2.0). A release signed with any other key is refused even if its signatures are internally consistent. PT_RELEASE_PUBLIC_KEY_FINGERPRINT (comma- or space-separated) or PT_RELEASE_PUBLIC_KEY_FINGERPRINT_FILE replaces the built-in list, for example to pin a fork's own key.
Platforms: Linux x86_64 (primary), Linux aarch64, macOS x86_64, macOS aarch64, Windows x86_64 (via WSL2 only, using the Linux install)
Quick Start
1. Interactive Mode (recommended)
pt
Runs the full triage workflow: Scan → Review → Confirm → Kill.
Use pt run --inline to preserve terminal scrollback.
2. Scored Candidates Without Acting
pt agent plan --format json                 # ranked candidates, evidence, recommended actions
pt agent explain --session <id> --pids 1234 # why one process scored the way it did
pt scan and pt deep print raw process snapshots (JSON by default), not scores.
3. Agent/Robot Mode
pt agent plan --format json            # Structured JSON plan
pt agent plan --format toon            # Token-optimized output
pt agent plan --pids 1234,5678          # Score selected PIDs with full ancestry/protection checks
pt agent apply --session <id> --yes    # Execute a plan (needs robot_mode.enabled=true in policy)
pt agent verify --session <id>         # Confirm outcomes
pt agent label --pid 1234 --kill       # Teach pt your verdict for this command pattern
pt agent watch --format jsonl          # Stream events
4. Shadow Mode (calibration)
pt shadow start                   # Observe without acting
pt shadow report -f md            # ASCII calibration report
pt shadow stop                    # Stop observer
Command Reference
| Command | Description | Example |
|---|---|---|
pt |
Interactive triage (scan + review + kill) | pt |
pt run --inline |
Interactive with preserved scrollback | pt run --inline |
pt scan |
Raw process snapshot (no scoring) | pt scan |
pt deep |
Raw deep /proc records (Linux) | pt deep |
pt agent plan |
Scored, ranked candidates + plan | pt agent plan --format json |
pt agent explain |
Evidence for specific PIDs | pt agent explain --session <id> --pids 1234 |
pt agent label |
Record your kill/spare verdict | pt agent label --pid 1234 --spare |
pt agent apply |
Execute a plan (robot mode) | pt agent apply --session <id> --yes |
pt agent verify |
Confirm outcomes | pt agent verify --session <id> |
pt agent watch |
Stream events | pt agent watch --format jsonl |
pt agent report |
Generate HTML report | pt agent report --session <id> |
pt diff |
Compare two sessions | pt diff --last |
pt learn |
Interactive tutorials | pt learn list |
pt bundle create |
Export session bundle | pt bundle create --session <id> --output out.ptb |
pt report |
HTML report from session | pt report --session <id> --output report.html |
pt shadow start |
Start calibration observer | pt shadow start |
pt doctor |
Read-only host hygiene audit (prints fixes, never runs them) | pt doctor --format md |
pt config validate |
Validate config files | pt-core config validate policy.json |
pt --version |
Show version | pt --version |
pt --help |
Full help | pt --help |
Core Concepts
Four-State Classification
Every process is classified into one of four states via Bayesian posterior updates:
| State | Description | Typical Action |
|---|---|---|
| Useful | Actively doing productive work | Leave alone |
| Useful-Bad | Running but stalled, leaking, or deadlocked | Throttle, review |
| Abandoned | Was useful, now forgotten | Kill (usually recoverable) |
| Zombie | Terminated but not reaped by parent | Clean up |
Evidence Sources
| Evidence | What It Measures | Impact | Used by |
|---|---|---|---|
| CPU activity | Active computation vs idle | Idle + old = suspicious | all |
| Runtime | Age of the process | Old = more suspicious | all |
| Orphan | Reparented to init and lost its session | Orphans are suspicious | all |
| TTY state | Controlling terminal or detached? | Detached old processes = suspicious | all |
| Kernel state | Running, sleeping, zombie, D-state | Zombie = terminal | all |
| Lineage / shared resources | Ownership, listeners, lockfiles, blast radius | Shifts toward useful when others depend on it | agent plan (Linux) |
| I/O and network activity | Recent file/network I/O | No I/O for hours = abandoned | TUI deep evidence |
| Network queues | Socket rx/tx queue depth | Deep queues = stalled (useful-bad) | TUI deep evidence |
| Signatures | Test runner, dev server, build tool? | Sets the prior | all |
| Past decisions | Have you killed or spared similar processes? | Sets the prior per pattern | all |
Confidence Levels
confidence in plans labels how peaked the posterior is:
| Level | Posterior | Meaning |
|---|---|---|
very_high |
> 0.99 | Strong evidence |
high |
> 0.95 | Clears the default robot min_posterior |
medium |
> 0.80 | Requires confirmation |
low |
< 0.80 | Review only |
Robot eligibility is decided by robot_mode.min_posterior against the probability that justifies the action (P(abandoned or zombie) for kill), not by this label.
Safety Model
Identity Validation
Every kill target is verified by a triple <boot_id>:<start_time_ticks>:<pid> that prevents PID-reuse attacks, stale plan execution, and race conditions.
Protected Processes
Protection has two layers:
- Policy (
policy.json→guardrails): protected patterns (defaultssystemd,sshd), protected users (defaultroot), protected categories (database,webserver), PIDs, and children of PID 1. - Built-in (
guardrails.builtin_protection, on by default):- terminal multiplexers (tmux, zellij, screen, wezterm/frankenterm mux servers), SSH ControlMasters (e.g. rch's shared connections), session infrastructure (sshd sessions,
systemd --user, dbus, pipewire, agents), the display-manager / session-manager process that holds a graphical login (sddm-helper,gdm-session-worker,lightdm --session-child,greetd,uwsm start,gnome-session-binary,ksmserver, …), interactive shells, and what is on someone's screen: terminal emulators, display servers/compositors (including kioskcage) and live monitors such ashtop/btop(headlessXvfbstays a candidate); ptitself and every process that invoked it;- database / web / message servers by name, even under rewritten titles (
postgres: … io worker,nginx: worker process; also mysqld/mariadbd, redis/valkey, mongod, memcached, httpd/apache2, caddy, haproxy, traefik, php-fpm, clickhouse, etcd, rabbitmq, mattermost, minio, elasticsearch), and every descendant of one (workers, plugins), wherever they run: systemd, docker or a plain shell.pt agent planreports the per-rule counts insummary.protected_by_rule; - on Linux, anything supervised by systemd (
system.slice/*.service, user units) or a container runtime, which covers postgres/nginx/mysql workers, docker containers and the like; - AI agent CLIs (claude, codex, gemini/agy, …) are never pre-selected or robot-killed; they are shown for manual review.
- terminal multiplexers (tmux, zellij, screen, wezterm/frankenterm mux servers), SSH ControlMasters (e.g. rch's shared connections), session infrastructure (sshd sessions,
- On macOS (no cgroups), placement comes from owner and executable:
rootand system role accounts (_windowserver, …), Apple platform binaries (/System,/usr/libexec,/usr/sbin,/sbin,/Library/Apple) and anything inside a.appbundle (GUI apps and their helpers) are protected (builtin.macos_system). A real user's other processes are evaluated even after being reparented to launchd (PID 1), which is how a dev server orphaned by a closed terminal looks there. - On Linux, a workload started inside a login session (for example a build running as root over SSH on a build worker, or an orphan reparented to PID 1) is not covered by the root-user / PID-1 rules, because it is a candidate rather than a system service.
- Where placement is unknown (Linux without systemd cgroups: cgroup v1 hosts, a container's own root namespace), the root-user and PID-1 rules apply unchanged: root's processes and children of PID 1 stay protected there, so such hosts see fewer candidates. The scan filter and the policy enforcer behind
agent planuse this one placement rule, so a process the scan evaluates is not downgraded to review afterwards because of where it runs (before, every macOS orphan was).
A terminal pane can inherit its multiplexer's user-service cgroup. On Linux, pt evaluates that pane's workloads like a transient scope when it can verify a same-owner ancestry chain with a controlling terminal below the live mux executable. Scan, plan and apply use this shared classification, so a pane workload is not given advice to restart the mux service. The mux itself, agent-mail and rchd servers, NTM session monitors and their service children stay protected. Missing or changed evidence retains service protection; a pane adopted by the user manager after losing its mux ancestry also retains protection.
- Desktop applications are evaluated, not protected, but scored as what they are: a process without a terminal in an XDG application unit of the user's systemd manager (
app-*.scope/app-*.service, which is how GNOME, KDE and uwsm launch apps) gets desktop-app ownership evidence toward useful, and its missing TTY is not counted against it. An idle app left open for days is not a candidate; a runaway one still can be. Commands typed into a terminal emulator share its unit but have a TTY, so they are judged on their own evidence. A process in such a unit whose matched signature expects it to be left behind (a jest or pytest that an editor extension started, say) gets no desktop-app credit; plan and explain report this asdesktop_app_credited: false.
Staged Kill Signals
- SIGTERM — graceful shutdown request
- Wait — configurable timeout for cleanup
- SIGKILL — forced termination if SIGTERM fails
Provenance-Aware Blast Radius
On Linux, pt agent plan builds a shared-resource graph mapping which processes share lockfiles, sockets, listeners, and pidfiles, and estimates each candidate's direct impact (co-holders of shared resources, supervised processes, children). A high estimated blast radius lowers the abandonment posterior; it is evidence, not a hard block. Plans also report each candidate's RSS, CPU and number of direct children. Separately, a process-tree pass never recommends killing a process whose live children would not also be killed, and caps anything under a live agent session at review.
Robot/Agent Safety Gates
All of these apply in pt agent apply (robot mode is off by default: robot_mode.enabled):
| Gate | Default | Purpose |
|---|---|---|
robot_mode.min_posterior |
0.95 | P(abandoned or zombie) for kill/restart, 1 − P(useful) for other actions |
robot_mode.max_blast_radius_mb |
4096 | Per-action RSS limit (--max-total-blast-radius for the run) |
robot_mode.max_kills |
5 | Per-run kill limit |
robot_mode.require_human_for_supervised |
true | Processes under an agent/IDE/CI need a human (fails closed if unknown) |
| protection rules | on | Built-in + guardrails.protected_*, re-checked live before each action |
| live pre-checks | always | Identity, protection, session safety, data-loss gate, supervisor; a plan cannot opt out |
Fleet plans additionally pool kill decisions across hosts, keeping the posterior expected false-discovery proportion of the pooled kill set within --max-fdr; single-host plans report the expected false-discovery rate of their kill set.
Architecture
pt (Bash wrapper)
 └─ pt-core (Rust binary, 8 crates, 100+ modules)
     ├─ Collect ─────── ps + exact /proc (Linux) / proc_pidinfo (macOS)
     │                  timing, cgroup placement, lineage, shared-resource
     │                  graph (Linux), deep /proc probes via io_uring
     │
     ├─ Infer ──────── 4-class naive-Bayes posterior (log-domain, clipped
     │                  and tempered terms), signature + learned priors,
     │                  provenance terms (Linux)
     │
     ├─ Decide ─────── Expected-loss minimization, protection and policy
     │                  enforcement, process-tree safety, Value of
     │                  Information (deep-scan hint), goal optimizer,
     │                  fleet expected-FDR pooling
     │
     ├─ Act ────────── identity-pinned signals (pidfd on Linux),
     │                  SIGTERM → SIGKILL, renice, pause/resume,
     │                  cgroup freeze/throttle/quarantine (Linux), live
     │                  pre-checks
     │
     └─ Report ─────── JSON/TOON/Markdown/HTML output, evidence ledger,
                        Galaxy-Brain cards, session bundles

 Library-only (tested, not wired into commands yet): BOCPD, HSMM, IMM,
 Kalman, CTW, Hawkes, EVT, conformal, martingales, CVaR, DRO, Gittins,
 causal snapshots, recovery trees, user-intent, workspace and GPU
 collectors, incremental scanning, OPE, contextual bandits.
Workspace Structure
process_triage/
├── Cargo.toml              # Workspace root
├── pt                      # Bash wrapper
├── install.sh              # Installer + ECDSA verification
├── crates/
│   ├── pt-core/            # Main engine (41 inference + 40 decision + 25 collect modules)
│   ├── pt-common/          # Shared types, evidence schemas, provenance IDs
│   ├── pt-config/          # Configuration loading, priors, policy validation
│   ├── pt-math/            # Log-domain arithmetic, numerical stability
│   ├── pt-bundle/          # Session bundles (ZIP + ChaCha20-Poly1305 encryption)
│   ├── pt-redact/          # HMAC hashing, PII scrubbing, redaction profiles
│   ├── pt-telemetry/       # Arrow schemas, Parquet writer, LMAX disruptor
│   └── pt-report/          # HTML report templating (Askama + minify-html)
├── test/                   # BATS test suite
├── docs/                   # User + architecture documentation
│   └── math/PROOFS.md      # Formal mathematical guarantees
├── examples/configs/       # Scenario configurations
├── fuzz/                   # Fuzz testing targets
└── crates/pt-core/benches/ # Criterion benchmarks
Configuration
Directory Layout
~/.config/process_triage/
├── decisions.json      # Learned kill/spare verdicts per command pattern
├── signatures.json     # User signatures (`pt-core signature add/import`)
├── priors.json         # Bayesian hyperparameters (optional)
└── policy.json         # Safety policy (optional)

~/.local/share/process_triage/
└── sessions/
    └── pt-20260115-143022-a7xq/
        ├── manifest.json            # Session metadata and state
        ├── context.json             # Host / run context
        ├── scan/inventory.json      # Process identities and commands
        ├── inference/results.json   # Four-class posteriors
        ├── decision/plan.json       # Executable plan and recorded evidence
        ├── action/outcomes.jsonl    # Action outcomes
        └── logs/session.jsonl       # Session event log
The config directory is $XDG_CONFIG_HOME/process_triage (default ~/.config/process_triage) on every platform; --config / PT_CONFIG_DIR, then PROCESS_TRIAGE_CONFIG, override it, and every file above (signatures included) follows the override. (Earlier releases kept signatures.json, pattern_stats.json and the patterns/ files in ~/Library/Application Support/process_triage on macOS; without an override pt still reads each one from there until the config directory has its own copy, and the next signature change or agent fleet transfer import saves the full contents to the config directory.) The data directory defaults to ~/.local/share/process_triage on Linux and ~/Library/Application Support/process_triage on macOS; PROCESS_TRIAGE_DATA or XDG_DATA_HOME override it.
Fleet configuration transfer supports validated JSON and encrypted .ptb export,
import and diff. An intact .ptb transfer requires explicit --export-profile forensic;
Safe and Minimal are redacted sharing profiles and cannot activate configuration.
Import refuses detected credentials and invalid priors or matchers. Import dry runs
show the selected strategy's merged values for the reported prior fields. Baseline
normalization remains unavailable: --normalize-baseline refuses until comparable
measured learning observations are wired. A current process count cannot establish
the evidence supporting transferred priors. Multi-file activation is not yet atomic.
Environment Variables
| Variable | Default | Description |
|---|---|---|
PROCESS_TRIAGE_CONFIG |
~/.config/process_triage |
Config directory |
PROCESS_TRIAGE_DATA |
~/.local/share/process_triage |
Data/session directory |
PT_OUTPUT_FORMAT |
(unset) | Default output format (json, toon) |
NO_COLOR |
(unset) | Disable colored output |
PROCESS_TRIAGE_RETENTION |
7 |
Session retention in days (off disables the automatic cleanup) |
PT_BUNDLE_PASSPHRASE |
(unset) | Default bundle encryption passphrase |
Priors Configuration (priors.json)
{
  "schema_version": "1.0.0",
  "classes": {
    "useful":    { "prior_prob": 0.70, "cpu_beta": {"alpha": 5.0, "beta": 3.0} },
    "useful_bad":{ "prior_prob": 0.05, "cpu_beta": {"alpha": 2.0, "beta": 4.0},
                   "queue_saturation_beta": {"alpha": 6.0, "beta": 1.0} },
    "abandoned": { "prior_prob": 0.15, "cpu_beta": {"alpha": 1.0, "beta": 5.0} },
    "zombie":    { "prior_prob": 0.10, "cpu_beta": {"alpha": 1.0, "beta": 9.0} }
  }
}
See docs/PRIORS_SCHEMA.md for the full specification.
Policy Configuration (policy.json)
A policy file is a complete document (schema_version, loss_matrix, guardrails, robot_mode, fdr_control, data_loss_gates); start from pt-core config show or a preset (pt-core config export-preset developer --output policy.json) and edit. The parts you usually change:
{
  "guardrails": {
    "protected_patterns": [{ "pattern": "my-daemon", "kind": "literal", "case_insensitive": true }],
    "min_process_age_seconds": 3600,
    "builtin_protection": true
  },
  "robot_mode": {
    "enabled": false,
    "min_posterior": 0.99,
    "max_blast_radius_mb": 2048,
    "max_kills": 5
  }
}
Check a file with pt-core config validate policy.json.
Telemetry and Data Governance
All data stays local. Nothing is sent anywhere.
| Data | Purpose | Retention |
|---|---|---|
| Process metadata | Classification input | Session lifetime |
| Evidence samples | Audit trail | Configurable (default: 7 days) |
| Kill/spare decisions | Learning | Indefinite (user-controlled) |
| Provenance graphs | Blast-radius estimation | Session lifetime |
| Session directories | Reproducibility | 7 days (PROCESS_TRIAGE_RETENTION), cleaned automatically; executing sessions are kept |
Redaction
Bundles and reports are redacted with one of three profiles: minimal, safe (default for sharing), forensic (full detail, local only).
See docs/PROVENANCE_PRIVACY_MODEL.md and docs/PROVENANCE_CONTROLS_AND_ROLLOUT.md.
Session Bundles and Reports
Encrypted Session Bundles (.ptb)
# Export a session
pt bundle create --session <id> --profile safe --output session.ptb

# With encryption (ChaCha20-Poly1305 + PBKDF2)
pt bundle create --session <id> --encrypt --passphrase "correct horse battery staple"
HTML Reports
pt report --session <id> --output report.html
pt report --session <id> --output report.html --include-ledger --embed-assets
Fleet Mode
pt can plan across several hosts over SSH (each host needs pt-core installed):
# Plan across hosts (inventory: TOML, YAML or JSON by extension)
pt-core agent fleet plan --inventory hosts.toml --parallel 10

# Or list hosts directly; kills pooled across hosts within an expected FDR of 5%
pt-core agent fleet plan --hosts trj,ts1,hz3 --max-fdr 0.05
Current status: fleet planning works: each host runs its own pt-core agent plan over SSH (so protection, cgroup placement and the posterior are evaluated on that host), and the fleet pools those decisions across hosts by Bayesian expected FDR (the largest kill set, most probable first, whose posterior expected share of wrong kills stays within --max-fdr). Hosts need pt-core on their PATH. Fleet apply only reports planned actions; remote execution is not implemented yet. The Chandy-Lamport consistent-snapshot coordinator exists as a library but is not wired into fleet planning yet, so cross-host dependencies are not considered today.
GPU and Container Awareness
GPU Process Detection
Status: library-only. The Linux GPU collector below is implemented and tested, but
pt deep, plans and blast radius do not call it yet.
The collector reads nvidia-smi (CUDA) and rocm-smi (AMD ROCm):
| Field Collected | NVIDIA | AMD |
|---|---|---|
| Device name, UUID, index | Yes | Yes |
| Total/used VRAM (MiB) | Yes | Yes |
| GPU utilization % | Yes | Yes |
| Temperature | Yes | Yes |
| Per-process GPU memory | Yes | Yes |
| Driver version | Yes | Yes |
If neither nvidia-smi nor rocm-smi is available, GPU detection degrades with a provenance warning.
Container and Kubernetes Detection
pt automatically detects containerized processes through three mechanisms (in priority order):
- Cgroup path patterns: Parses
/proc/[pid]/cgroupfor Docker (/docker/<64hex>), Podman (libpod-<id>), containerd, LXC, and CRI-O patterns - Marker files: Checks for
/.dockerenv(Docker) and/.containerenv(Podman) - Environment variables: Reads
KUBERNETES_SERVICE_HOST,POD_NAME,POD_NAMESPACE,POD_UIDfor Kubernetes metadata
For Kubernetes pods, pt extracts the QoS class (Guaranteed / Burstable / BestEffort), pod name, namespace, and container name. Processes whose cgroup places them in a container are protected (killing them is futile or harmful when an orchestrator restarts them); stop the container instead.
Daemon Mode (Background Monitoring)
pt can run as a persistent background monitor that watches system health and triggers triage when conditions deteriorate:
pt-core daemon start              # Start background monitor
pt-core daemon status             # Check daemon state
pt-core daemon stop               # Stop monitor
How It Works
The daemon runs a tick-based event loop (default: every 60 seconds) that evaluates trigger conditions:
| Trigger | Default Threshold | What It Detects |
|---|---|---|
| Load average | > 4.0 | CPU overload |
| Orphan count | > 20 | Process leak |
| Memory pressure | > 85% used | Memory exhaustion |
When a trigger fires for 3 consecutive ticks, the daemon escalates: it runs agent plan and posts the result to the inbox (pt-core agent inbox) and as a desktop notification. It never acts on its own.
Self-Limiting
The daemon enforces overhead budgets on itself:
- CPU cap: 2.0% by default (configurable)
- RSS cap: 64MB by default (configurable)
- Event audit ring: Circular buffer of 100 recent events for debugging
If the daemon itself exceeds its budget, it backs off automatically.
Process Signature Database
pt ships with a built-in database of known process signatures: command patterns that indicate specific process types (test runners, dev servers, build tools, agents).
pt-core signature list              # Show all signatures
pt-core signature add herdr-server \
  --category terminal \
  --pattern '^herdr$' \
  --arg-pattern '^server$' \
  --prior useful                    # "this is normal": matching processes score as useful
pt-core signature add stuck-jest \
  --category other \
  --pattern jest \
  --arg-pattern=--runInBand \
  --prior abandoned                 # "usually left behind"
pt-core signature test herdr --cmdline 'herdr server'   # Which signature matches?

pt-core signature export sigs.json  # Export for sharing
pt-core signature import sigs.json  # Import from file
Categories: agent, ide, ci, orchestrator, terminal, other. --pattern matches the process name, --arg-pattern the command line (repeat either; all arg patterns must match). User signatures live in signatures.json in the config directory.
Signatures are matched against the process name and command line. A matched signature with priors sets the class prior: --prior useful (about 90% useful) or --prior abandoned (about 80% abandoned). Built-in test-runner and build-tool signatures (jest, pytest, webpack, ...) lean toward "likely abandoned if old", dev-server signatures toward "likely useful"; their argument patterns match the tool as a command word (node_modules/.bin/jest, python -m pytest), not any path that contains the name. A signature added without --prior only labels its matches. Signature and learned priors apply the same way in pt agent plan, the TUI, pt agent explain, snapshot, watch and the MCP tools.
Supervision Detection
pt detects 8 types of process supervision to avoid killing managed processes (which would just respawn):
| Supervisor | Detection Method | Confidence |
|---|---|---|
| systemd | Cgroup path + NOTIFY_SOCKET env |
0.95 |
| launchd | XPC_SERVICE_NAME env |
0.95 |
| Docker/containerd | Cgroup path patterns, /.dockerenv |
0.95 |
| VS Code | VSCODE_PID, VSCODE_IPC_HOOK env |
0.95 |
| Claude/Codex | CLAUDECODE, CLAUDE_CODE_SESSION_ID, CODEX_SESSION_ID env |
0.95 |
| GitHub Actions | GITHUB_ACTIONS, GITHUB_WORKFLOW env |
0.95 |
| tmux/screen | TMUX or STY env |
0.30 |
Supervision is reported per candidate in the plan (supervisor); for a process supervised by a systemd service it gives the unit, the manager (system or user) and the systemctl [--user] restart <unit> command. Processes classified as systemd services or container workloads are protected outright, and robot mode requires a human for anything supervised by an agent, IDE or CI job (failing closed when it cannot tell). Verified terminal-pane ancestry is treated as a user workload even inside the mux service's cgroup. A nohup/disown detector (SIGHUP in SigIgn, nohup.out) exists in the library but is not used in scoring yet.
User Intent Detection
Status: library-only. The collector below exists and is tested, but no command uses its score yet. Today, live-use protection comes from the built-in rules (interactive shells, multiplexers, agent sessions) and from session safety at apply time.
The intended design: before flagging a process, check whether a human is actively using it. Nine signal types contribute to a "user intent score" that suppresses false positives:
| Signal | Weight | What It Checks |
|---|---|---|
| Foreground job | 0.95 | Process group ID matches TTY foreground group |
| Editor focus | 0.90 | Attached to IDE (VS Code, etc.) |
| tmux session | 0.85 | Running inside tmux |
| screen session | 0.85 | Running inside screen |
| Recent TTY activity | 0.80 | Terminal FD touched within 5 minutes |
| Active repo context | 0.75 | CWD in a git repo with recent activity |
| Active TTY | 0.70 | Has controlling terminal |
| Recent shell activity | 0.65 | Shell parent recently active |
| SSH session | 0.60 | Connected via SSH |
The final score is computed as 1 - product(1 - w_i) across all detected signals (probabilistic combination). A high intent score suppresses the abandonment posterior; even an old, idle process is safe if someone just switched to its tmux pane.
Incremental Scanning
Status: library-only. Every command currently re-scans and re-scores all processes (a full plan takes about a second on a typical host).
Full re-scans are wasteful when most processes haven't changed. The incremental engine tracks a process inventory across sessions and only re-infers processes with material state changes:
| Change Type | Triggers Re-inference? | Detection |
|---|---|---|
| New process | Yes | Not in previous inventory |
| Process exited | Yes (record departure) | In previous but not current |
| CPU spike (> 5pp) | Yes | |current - previous| > threshold |
| RSS spike (> 20%) | Yes | |delta| / previous > fraction |
| Process state change | Yes | State enum comparison |
| Stale entry (> 10 min) | Yes | Forced re-scan |
| Unchanged | No (age-only update) | No material change detected |
Process identity is tracked via a SHA-256 hash of (pid, uid, comm, cmd), producing a stable 16-character hex fingerprint. The inventory supports up to 100,000 entries with LRU eviction.
Respawn Loop Detection
Status:
pt agent verify --check-respawnreports whether killed processes came back. The loop tracker and utility discount described below are library-only.
Killing a supervised process that immediately restarts is pointless. pt tracks kill-respawn cycles and adjusts its recommendations:
Kill → respawn in 2s → Kill → respawn in 2s → Kill → respawn in 2s
                     ↓
         "Respawn loop detected (3 cycles in 60s)"
         Recommendation: systemctl stop <unit> instead
After detecting a loop (2+ respawns within 30 seconds of each kill, within a 1-hour window), pt discounts the kill action's utility:
utility_multiplier = 1.0 - 0.8 * min(loop_count / 5, 1.0)
At 5+ loops, kill utility drops to 20% of baseline. The recommendation escalates from "kill" to "stop supervisor" to "disable supervisor" as the loop count increases.
Memory Pressure Response
Status: library-only. The shipped daemon uses one memory trigger (≥ 85% used for 3 ticks, see Daemon); the graded modes below are implemented in
mem_pressure.rsbut not wired into the daemon yet.
The designed behavior: monitor system memory and escalate scan cadence when pressure rises:
| Mode | Threshold | Scan Interval | Action |
|---|---|---|---|
| Normal | < 80% used | 300s | Continue monitoring |
| Warning | >= 80% used | 60s | Generate triage plan |
| Emergency | >= 95% used | 15s | Urgent plan, prioritize high-RSS candidates |
Transitions require 2 consecutive signals at the new level (prevents flapping on momentary spikes). De-escalation also requires 2 consecutive normal readings.
On Linux, pt reads Pressure Stall Information (/proc/pressure/memory) when available, using memory.some as a more accurate signal than raw utilization. PSI thresholds: 20% for warning, 60% for emergency.
Host Hygiene Audit (pt doctor)
Many incidents come from host configuration, not from any one process. pt doctor (Linux) reads the machine's settings and reports findings as ok / info / warn / crit, each with the observed values, a recommendation, the reason it matters, and the exact commands a person could run. It is read-only: nothing is written and no command is executed (--fix-script prints them as a commented shell script for review).
| Check | Flags |
|---|---|
| Current pressure regimes | the same PSI / load / memory / file-handle reading as agent plan |
vm.vfs_cache_pressure |
below 100 (critical on large-RAM btrfs hosts, where it let caches grow to 388 GB and systemd-oomd killed every session); when caches are bloated now, says that dropping caches only treats the symptom |
vm.min_free_kbytes |
below the reserve for the machine's RAM (≈256 MB at 16 GB, 512 MB at 32–64 GB, 1 GB at 256 GB, 2 GB at 512 GB) |
vm.dirty_ratio |
percentage limits that allow tens of GB of dirty cache |
| Swap | no swap; swap nearly full; zram active but not recreated at boot; swap paradox (swapped pages while available RAM is more than twice the swapped amount) |
| systemd-oomd | whether it runs; a later MemoryMax=infinity (or reset) drop-in that negates an earlier user-.slice / [email protected] limit |
| journald | volatile storage or retention under a day (OOM post-mortems lost) |
| File handles / inotify | system file table above 75% (with the largest descriptor holders); max_user_watches below 524288 |
| Process table | zombies grouped by parent (a parent with 5+ unreaped children), D-state count |
| Deleted but open files | disk space held by files deleted while a process still has them open (1 GiB or more), with the holder |
| pt itself | PSI unavailable (regimes fall back to load and memory); session store past 1000 sessions or 1 GiB, or growing with retention switched off |
Exit code: 0 when nothing needs attention, 1 when there is a warning or critical finding (the severity is in worst). Not yet covered: multiplexer hygiene, a policy section for thresholds, macOS.
Goal-Based Kill Set Selection
Instead of ranking processes individually, pt can optimize kill sets to achieve resource goals:
pt agent plan --goal "free 4GB memory" --format json
pt agent plan --goal "release port 8080" --format json
The optimizer evaluates which combination of kills achieves the goal with minimum collateral damage: exact branch-and-bound for a single goal, greedy for combined goals. Only candidates whose own recommendation is kill enter the kill set; goal-selected processes with a milder recommendation are listed for review.
Each candidate's "efficiency" is contribution / expected_loss, measuring how much resource it frees per unit of risk. The optimizer selects the minimum-cost set that meets the target.
Off-Policy Evaluation
Status: library-only. No command exposes these estimators yet.
Before deploying a new triage policy (different thresholds, different priors), pt can evaluate it against historical decisions without running it live:
| Estimator | Bias | Variance | When to Use |
|---|---|---|---|
| IPS (Inverse Propensity Scoring) | Unbiased | High | Baseline, sufficient data |
| Doubly Robust | Unbiased if either model correct | Lower | Preferred when available |
The doubly-robust estimator combines importance weighting with a direct reward model:
V_DR = (1/n) * sum[ r_hat(s, pi) + w_i * (r_i - r_hat(s, a_i)) ]
where w_i = min(pi_new(a|s) / pi_old(a|s), 10.0) is the clipped importance ratio. The effective sample size ESS = (sum w_i)^2 / sum w_i^2 must exceed 100 for reliable estimates.
Recommendations: Deploy if the 95% CI lower bound exceeds the current policy's value. Hold if inconclusive. Unreliable if ESS is too low.
Wait-Free /proc Probing
Some processes are in D-state (uninterruptible sleep), and reading their /proc files can block the entire scan. The prober uses Linux io_uring for non-blocking reads:
- Submit all
/proc/[pid]/*reads as async I/O operations - Add a global timeout entry (100ms default)
- Process completions as they arrive
- Mark timed-out probes (the process is likely stuck on I/O)
This keeps a single hung NFS mount or frozen block device from stalling pt deep and the TUI's deep collection (reads still in flight at the timeout are leaked, never freed, so the kernel can't write into reused memory). Separately, plans give D-state processes low-confidence actions with D-state diagnostics.
The Evidence Ledger
The evidence ledger is the core explainability tool. Every triage candidate gets a detailed breakdown showing exactly how each piece of evidence shifted the posterior:
PID 84721 (bun test) — Score: 87 — Classification: Abandoned

  Evidence Ledger:
  🎲 prior         Bayes factor: 1.00   (baseline)
  💻 cpu           Bayes factor: 8.42   decisive → supports abandoned
  ⏱  runtime       Bayes factor: 5.23   strong   → supports abandoned
  👻 orphan        Bayes factor: 3.71   strong   → supports abandoned
  🖥  tty           Bayes factor: 0.89   weak     → supports useful
  🚩 state_flag    Bayes factor: 1.34   weak     → supports abandoned

  Posterior: P(abandoned)=0.87  P(useful)=0.06  P(useful_bad)=0.04  P(zombie)=0.03
  Log-odds (abandoned vs useful): 2.67 bits
(net, io_active and queue_sat terms appear in the TUI when it has deep evidence for the process.)
Each evidence term has a glyph, a Bayes factor (ratio of likelihoods), a strength label (decisive/strong/substantial/weak), and a direction (which class it supports). The strength thresholds follow standard Bayesian interpretation: decisive = |delta_bits| > 3.3 (>10:1 odds), strong = > 2.0 (>4:1), substantial = > 1.0 (>2:1).
Access this via pt agent explain --session <id> --pids <pid> --galaxy-brain, the TUI detail pane, or pt report --include-ledger.
Plan Format and Example Output
When you run pt agent plan --format json, the output is a deterministic, resumable plan:
{
  "plan_id": "plan-a7c92e3f1b2d4e5f",
  "session_id": "pt-20260317-150000-a7xq",
  "generated_at": "2026-03-17T15:00:00Z",
  "actions": [
    {
      "action_id": "act-1234567890abcdef",
      "target": {
        "pid": 84721,
        "start_id": "boot-abc123:1234567890:84721"
      },
      "action": "kill",
      "order": 0,
      "stage": 0,
      "timeouts": {
        "preflight_ms": 2000,
        "execute_ms": 10000,
        "verify_ms": 5000
      },
      "pre_checks": [
        "verify_identity",
        "check_not_protected",
        "check_data_loss_gate"
      ],
      "rationale": {
        "expected_loss": 0.05,
        "expected_recovery": 0.95,
        "posterior": {
          "abandoned": 0.87,
          "useful": 0.06,
          "useful_bad": 0.04,
          "zombie": 0.03
        },
        "memory_mb": 1024.5,
        "category": "test_runner"
      },
      "routing": "direct",
      "confidence": "normal"
    }
  ],
  "gates_summary": {
    "total_candidates": 47,
    "blocked_candidates": 8,
    "pre_toggled_actions": 1
  }
}
Key design choices:
- IDs are deterministic (FNV-1a 64-bit hashes, not UUIDs); the same inputs always produce the same plan
- Zombie routing: Z-state processes are routed to their parent for
restart(forcing reap), not killed directly (restart is not executable yet, so apply reports these as failed) - D-state handling: Processes in uninterruptible sleep get
confidence: "low"with diagnostic fields (wchan, I/O counters, D-state duration) - Pre-checks: Every action lists safety checks that must pass before execution (identity verification, protection check, session safety, data-loss gate, supervisor check);
agent applyalways runs at least the checks pt generates for that action type, whatever the plan file says
Session Lifecycle
Commands track session state at runtime (manifest.json). A type-state API that would enforce the transitions below at compile time exists in the library but the commands do not use it yet:
Created ──→ Scanning ──→ Planned ──→ Executing ──→ Completed
   │          │            │          │
   └─→ Failed ←┴────────────┴──────────┘
   └─→ Cancelled
Each state is a zero-sized marker type. The method TypedSession<Scanning>::finish_scan() returns a TypedSession<Planned>. You cannot call start_execution() on a session that hasn't been planned yet, because the method doesn't exist on that type. Invalid transitions are caught by the compiler, not by runtime checks.
The Bash Wrapper
The pt script is a thin Bash wrapper that locates and execs pt-core:
Binary discovery (checked in order):
$PT_CORE_PATH(explicit override)./pt-core(same directory)./target/release/pt-core(cargo build artifact)~/.local/bin/pt-core/usr/local/bin/pt-core- PATH lookup via
which
UI mode: bare pt runs the TUI when it has a terminal; without one (or in robot mode) pt run exits 11 and points you to pt agent plan. Use pt scan or pt agent plan for noninteractive output.
Built-in commands:
pt update— Fetches the latest version and runs its installer with--verify(fails closed on unsigned releases;--no-verifyoverrides);pt update rollback|list-backups|show-backup|verify-backup|prune-backupsmanage pt-core backupspt history— Shows learned kill/spare verdicts per pattern (requiresjq)pt clear [TEXT]— Forgets learned verdicts (only patterns containing TEXT) after confirmationpt deep— Alias fordeep-scanpt --version— Wrapper version plus the pt-core engine it will run
The wrapper is deliberately small (under 500 lines of shellcheck-clean Bash) so the Rust engine can be updated independently.
Shell Completions
Generate completions for your installed version (they cover all subcommands, options and value choices such as --format and --theme):
pt-core completions bash > ~/.local/share/bash-completion/completions/pt-core
pt-core completions zsh  > ~/.zfunc/_pt-core
pt-core completions fish > ~/.config/fish/completions/pt-core.fish
The checked-in files under completions/ are snapshots and may lag behind the CLI.
How pt Learns From Your Decisions
pt remembers human verdicts, per command pattern, in decisions.json in your config directory:
- Kills you confirm in the TUI are recorded once they succeed (dry-run, shadow, failed and blocked actions are not).
- Explicit labels:
pt agent label --pid 1234 --killorpt agent label --cmd "python3 -m http.server 8000" --spare. - Robot/agent applies are never recorded, so the model cannot teach itself its own mistakes.
Each verdict is stored at three specificity levels:
| Level | What's Preserved | Example |
|---|---|---|
| Exact | Full command with specific args | node /home/user/project/.bin/jest --watch tests/ |
| Standard | Generalized paths, preserved flags | node .*/jest --watch .* |
| Broad | Base command only | node .*jest.* |
Normalization rules applied automatically:
- Home paths (
/home/user/...) →.* - Temp paths (
/tmp/...) →.* - Port numbers (
--port 8080) →\d+ - UUIDs →
[0-9a-f-]+ - Long numbers (4+ digits) →
\d+ - Versioned interpreters (
python3.11) →python.*
When a process matches a learned pattern (most specific level with any verdicts wins), its class prior is replaced by a Beta-Binomial estimate, P(abandoned) = (kills + 2·g) / (kills + spares + 2), where g is the global abandoned+zombie prior, clamped to [0.02, 0.95] so live evidence can still overturn it. One kill moves a default 0.25 prior to about 0.5; one spare moves it to about 0.17. Counts fade with a 180-day half-life since the pattern was last labeled. This applies in pt agent plan (candidates show inference.learned_prior), the TUI and pt agent explain, and it takes precedence over the signature fast path. pt history lists the patterns and counts; pt clear resets them, and pt clear TEXT forgets only patterns containing TEXT.
Critical File Detection
Before killing any process, pt checks what files it has open. 20+ detection rules across 9 categories identify files that indicate active work in progress:
| Category | Examples | Strength | Kill Impact |
|---|---|---|---|
| SQLite WAL/Journal | .sqlite-wal, .db-journal |
Hard | Blocks kill — active transaction |
| Git Locks | .git/index.lock, packed-refs.lock |
Hard | Blocks kill — repository corruption risk |
| Git Rebase/Merge | rebase-merge/, MERGE_HEAD, CHERRY_PICK_HEAD |
Hard | Blocks kill — interactive operation |
| System Package Locks | /var/lib/dpkg/lock, .rpm.lock, pacman/db.lck |
Hard | Blocks kill — package manager transaction |
| Node Package Locks | .package-lock.json, .pnpm-lock.yaml |
Hard | Blocks kill — npm/pnpm/yarn install |
| Cargo Locks | .cargo/registry/.package-cache-lock |
Hard | Blocks kill — cargo registry operation |
| Database Files | .db, .sqlite3, .ldb, .mdb |
Soft | Warns — possible data loss |
| Application Locks | .lock, .lck, /lock/ patterns |
Soft | Warns — process may hold coordination lock |
| Generic Writes | Any file open for writing | Soft | Noted — contextual evaluation |
These categories are implemented in the collector and policy enforcer, but plans do not attach critical files to candidates yet, so the category rules do not fire. What does run: agent apply's data-loss gate blocks any target holding a regular file open for writing (on macOS via lsof, failing closed if it can't inspect) or holding a file lock.
Workspace Detection
Status: library-only. The resolver is implemented and tested but not used by plans or scoring yet.
The design: pt determines which git repository and worktree each process belongs to, providing project context for triage decisions:
- Reads
/proc/[pid]/cwdto get the process's working directory - Walks up the directory tree looking for
.git - If
.gitis a file (git worktree), parses thegitdir:pointer and resolves back to the main repository root viacommondir - Reads
HEADto determine branch status (on branch, detached HEAD, or corrupted)
This means pt can tell you "this stuck cargo build is in your feature/auth worktree of the backend repo," instead of just "PID 12345 is running cargo."
A process with a deleted CWD (the directory was removed while the process was running) gets an elevated suspicion score, since it's likely orphaned from a branch that was cleaned up.
cgroup Integration
CPU Throttling (Instead of Killing)
For processes classified as Useful-Bad (misbehaving but needed), pt can throttle CPU usage via cgroup controllers instead of killing:
Throttle formula: quota_us = max(target_fraction × period_us, 1000)

Example: 25% throttle = 25,000 µs quota per 100,000 µs period
         2 cores max  = 200,000 µs quota per 100,000 µs period
         Minimum      = 1,000 µs (prevents complete starvation)
| Aspect | cgroup v1 | cgroup v2 |
|---|---|---|
| Quota file | cpu.cfs_quota_us + cpu.cfs_period_us |
cpu.max (single file: "quota period") |
| Weight | cpu.shares (relative) |
cpu.weight (1-10000) |
| Memory | memory.limit_in_bytes |
memory.max + memory.high |
| Write order | Period must be set before quota | Single atomic write |
| Detection | Hierarchy ID != 0 in /proc/[pid]/cgroup |
Hierarchy ID = 0 |
pt detects cgroup v1, v2 and hybrid hierarchies. Mutation currently requires a
readable unified v2 hierarchy, a full matching process identity, the caller's
owner, and an exclusive leaf with no descendants. Direct runners also refuse
PID 1, invoking processes and protected infrastructure. Hybrid v1 fallbacks check
their own controller's leaf separately; pure v1 mutation is refused. Most
shell-launched dev processes share a cgroup and cannot be changed safely here.
These checks are snapshots; automatic creation of a dedicated target leaf is
not implemented.
The library can capture prior CPU limits and CPU sets for explicit reversal, bound to the original process identity and controller path. Unknown prior settings are refused. A bare Unquarantine action cannot restore a prior CPU set and is refused; durable reversal wiring into the CLI remains incomplete.
cpuset Quarantine
For extreme cases, pt can pin a process to a limited set of CPU cores via the cpuset controller, isolating it from the rest of the system without killing it.
Action Recovery Trees
Status: library-only.
agent applyreports failed actions with their status; it does not consult these trees or retry automatically yet.
The design: when an action fails, consult a structured recovery tree with diagnosis and fallback options:
Kill action failed (Timeout)
 ├─ Diagnosis: "Process did not terminate within grace period"
 ├─ Alternative 1: Escalate to SIGKILL (requirements: process exists)
 ├─ Alternative 2: Investigate D-state (requirements: process in uninterruptible sleep)
 ├─ Alternative 3: Stop supervisor first, then retry kill
 └─ Alternative 4: Escalate to user for manual intervention
Failure categories with specific recovery strategies:
| Failure | Primary Recovery | Fallback |
|---|---|---|
| Permission denied | Retry with elevated privileges | Escalate to user |
| Process not found | Verify goal achieved (may have exited) | Skip |
| Timeout | Escalate signal (SIGTERM → SIGKILL) | Investigate D-state |
| Supervisor conflict | Stop supervisor, mask unit, retry | Check for respawn |
| Identity mismatch | Abort (PID reused; wrong process) | Re-scan and re-plan |
| Resource conflict | Wait and retry with backoff | Skip |
Recovery is always forward (escalate to more forceful actions), never backward (no automatic undo). Reversal metadata is captured so a human can manually undo if needed.
Telemetry: Lock-Free Event Recording
Status: library-only. The
pt-telemetrycrate contains the disruptor below; shipped commands record sessions as JSON/JSONL files and shadow observations through shadow storage, not through this ring buffer.
The design uses an LMAX Disruptor, a lock-free, wait-free ring buffer designed for ultra-low-latency event recording:
Producer (triage loop) ──→ [Ring Buffer] ──→ Consumer (Parquet writer)
                               ↑
                        Pre-allocated, fixed-size
                        Cache-line aligned (64 bytes)
                        Power-of-2 capacity
                        Bitmask indexing (no modulo)
Why a disruptor instead of a channel?
- Zero allocation: All event slots are pre-allocated at startup. No heap allocation during triage.
- No contention: Producer and consumer sequences are on separate cache lines (64-byte alignment via
#[repr(align(64))]), eliminating false sharing. - Wait-free: Producer never blocks. If the buffer is full, the event is simply dropped. Telemetry should never slow down triage decisions.
- Bitmask indexing: Capacity is always a power of 2, so
index = sequence & (capacity - 1)avoids expensive modulo operations.
Events are fixed-size structs (timestamp + event type + PID + 128-byte detail buffer) written to Apache Parquet via Arrow schemas for efficient columnar analytics.
Bundle Format Internals
A .ptb file is a ZIP archive (optionally encrypted) containing a manifest and session artifacts:
session.ptb (ZIP or encrypted envelope)
├── manifest.json       # Bundle metadata + file checksums
├── session/manifest.json       # Session metadata
├── session/context.json        # Host / run context
├── scan/inventory.json         # Redacted process state
├── inference/results.json      # Four-class posteriors
├── plan.json                   # Executable plan and recorded evidence
├── scan/provenance.json        # Process provenance graph, when recorded
├── scan/provenance_audit.json  # Provenance export audit, when recorded
├── logs/outcomes.jsonl         # Recorded action outcomes
└── logs/session.jsonl          # Session event log
Safe exports sanitize JSON and JSONL before checksums are computed. Minimal exports
contain only available aggregate counts in summary.json. Opaque telemetry and
process dumps require an explicit forensic export until a format-specific sanitizer
is available; safe exports refuse them before creating the destination file.
Encryption Envelope
When encrypted, the ZIP payload is wrapped in a PTBENC01 envelope:
[8 bytes:  "PTBENC01"]        Magic header
[4 bytes:  KDF iterations]    PBKDF2 iteration count (default 100,000)
[16 bytes: salt]              Random salt for key derivation
[12 bytes: nonce]             Random nonce for ChaCha20
[rest:     ciphertext]        ChaCha20-Poly1305 authenticated ciphertext
Key derivation uses PBKDF2-HMAC-SHA256 with 100,000 iterations. The resulting 256-bit key feeds ChaCha20-Poly1305 for authenticated encryption. The 16-byte Poly1305 tag provides tamper detection.
Integrity Verification
Every file in the bundle has a SHA-256 checksum in the manifest. The reader verifies checksums on load and rejects bundles with mismatched hashes. Maximum bundle size for in-memory reading is 100MB (prevents OOM on malicious files).
Numerical Stability
All Bayesian computation happens in log-domain to prevent the floating-point catastrophes that plague naive probability implementations:
The problem: Multiplying many small probabilities (e.g., 0.001 * 0.002 * 0.0003 * ...) underflows to zero in IEEE 754 double precision. Dividing by the sum of such products for normalization produces 0/0 = NaN.
The solution: Work with log-probabilities throughout:
- Multiplication becomes addition:
log(a * b) = log(a) + log(b) - Normalization uses log-sum-exp:
log(sum(exp(x_i))) = max(x) + log(sum(exp(x_i - max(x)))) - The max-subtraction trick ensures the largest exponent is
exp(0) = 1, preventing overflow
The pt-math crate provides log_sum_exp, log_beta_pdf, log_gamma, gamma_log_pdf, and normalize_log_probs, all numerically stable. The implementation has been validated with 21 stress tests covering 1000+ parameter combinations with zero panics.
Mathematical Foundations
The inference engine is backed by formal mathematical guarantees documented in docs/math/PROOFS.md:
| Guarantee | Method | Invariant |
|---|---|---|
| Posterior sums to 1 | Log-sum-exp normalization | sum P(C|x) = 1 |
| FDR control (fleet plans) | Bayesian expected FDR | E[FDP | x] <= alpha (as good as the posterior's calibration) |
| Numerical stability | Log-domain arithmetic | No overflow/underflow |
Library-only (not applied by any command yet): Mondrian conformal coverage, M/M/1 stall probabilities, Chandy-Lamport consistent cuts.
Decision Theory Deep Dive
The decision engine goes far beyond simple threshold-based kill/spare. It implements a full decision-theoretic framework:
Expected Loss Minimization
For each candidate, pt computes the expected loss for all 8 possible actions under the current posterior:
E[L(action)] = sum_c P(c | evidence) * L(action, c)
The loss matrix encodes domain knowledge. With the defaults, killing a useful process costs 500, keeping an abandoned one costs 5, and killing an abandoned one costs 0.1. Reversible actions (renice/pause/throttle) on an abandoned process cost 3.5–4.5, because they leave its memory, ports and locks held. So Kill wins only when P(useful) is below roughly 0.7%. The action with minimum expected loss wins.
The displayed score is 100 × P(abandoned or zombie). It measures how suspicious a process is, not how confident the model is about some class.
Value of Information
Before committing to an action, pt evaluates whether gathering more evidence would change the decision. Commands currently weigh one probe, a deep scan: the TUI runs it for candidates where it is worth it, and agent plan reports it as a hint. The library framework models 9 probe types:
| Probe | Cost | What It Reveals |
|---|---|---|
| Wait 5 min | ~5 min | Whether CPU/IO patterns change |
| Wait 15 min | ~15 min | Longer behavioral observation |
| Quick scan | ~1 sec | Basic process state |
| Deep scan | ~30 sec | Full /proc inspection |
| Stack sample | ~2 sec | Thread backtraces |
| Strace | ~5 sec | System call activity |
| Network snapshot | ~3 sec | Socket states and queue depths |
| I/O snapshot | ~2 sec | Read/write rates |
| Cgroup inspect | ~1 sec | Resource limits and usage |
A probe is only worth taking if its expected information gain exceeds its cost: VoI(m) = E[loss_reduction(m)] - cost(m). Probes are ranked by a Whittle-style index (-VoI) / cost for budget-constrained scheduling.
FDR Control for Multiple Kill Decisions
When triaging many processes at once, killing the top-N by score without correction inflates the false discovery rate. Single-host plans report the expected false-discovery rate of their kill set (kill_set_fdr_estimate, the mean of 1 − P(abandoned or zombie) over it); fleet plans pool kill decisions across hosts and keep the largest kill set, most probable first, whose posterior expected false-discovery proportion is at most --max-fdr. This bound is only as good as the posterior's calibration (see Limitations). e-value procedures (eBH, and eBY for arbitrary dependence) are applied when candidates carry genuine e-values; a posterior probability is not one.
Contextual Bandits for Action Selection (library-only)
Not used by any command yet. The design: for processes where the optimal action is uncertain, use a LinUCB contextual bandit with ridge regression per-action models. This balances exploitation (take the action with best historical outcomes) against exploration (try actions we're uncertain about to gather data).
Gittins Index for Probe Scheduling (library-only)
Not used by any command yet. The Wonham filter (continuous-time Bayesian filter using matrix exponential exp(Q * dt)) estimates the current regime, and the Gittins index computes the optimal probe order under discounted rewards. This determines whether to invest time in a deeper scan or commit to an action now.
Fuzz Testing
13 fuzz targets exercise every parser that touches external input:
# Run a fuzz target (requires cargo-fuzz)
cargo fuzz run fuzz_proc_stat
| Target | What It Fuzzes |
|---|---|
fuzz_proc_stat |
/proc/[pid]/stat parser |
fuzz_proc_io |
/proc/[pid]/io parser |
fuzz_proc_sched |
/proc/[pid]/sched parser |
fuzz_proc_schedstat |
/proc/[pid]/schedstat parser |
fuzz_proc_statm |
/proc/[pid]/statm parser |
fuzz_proc_cgroup |
/proc/[pid]/cgroup parser |
fuzz_proc_environ |
/proc/[pid]/environ parser |
fuzz_network_tcp |
/proc/net/tcp parser |
fuzz_network_udp |
/proc/net/udp parser |
fuzz_network_unix |
/proc/net/unix parser |
fuzz_bundle_reader |
.ptb bundle format parser |
fuzz_config_policy |
policy.json deserializer |
fuzz_config_priors |
priors.json deserializer |
Every /proc parser must handle arbitrary garbage input without panicking or corrupting state.
Scenario Configurations
Ready-to-use profiles in examples/configs/:
| Profile | Use Case | Min Age | Robot Mode | Robot max kills / per-run limit |
|---|---|---|---|---|
developer.json |
Dev-machine cleanup | 30 min | Off | 15 / 20 |
server.json |
Conservative production | 4 hours | Off | 3 / 5 |
ci.json |
CI/CD automation | 1 hour | On | 10 / 10 |
fleet.json and fleet.inventory.json are fleet host-discovery configs, not policies.
pt-core config validate examples/configs/developer.json --format summary
Troubleshooting
"No candidates found"
Expected on clean systems! pt won't invent problems. Check: minimum age threshold is 1 hour by default. To lower it:
pt agent plan --min-age 60 # 1 minute instead of 1 hour
Permission errors
sudo setcap cap_sys_ptrace=ep $(which pt-core)  # Grant /proc access
sudo pt deep                                      # Or run elevated
"pt-core not found"
curl -fsSL https://raw.githubusercontent.com/Dicklesworthstone/process_triage/main/install.sh | bash
ls -la ~/.local/bin/pt-core
TUI won't run
The TUI needs an interactive terminal; in scripts, CI or agent sessions pt run
exits with code 11 and points to pt agent plan. It also needs the ui feature,
which is on by default (only --no-default-features builds lack it):
cargo run -p pt-core -- run
Limitations
- Linux-first: Deep scan features (
/procparsing, cgroup limits, io_uring probes) require Linux. macOS has basic collection viaps/lsof/proc_pidinfo. Actions on macOS: kill, pause/resume and renice run (identity is revalidated to the microsecond immediately before each signal; there is no pidfd, so a tiny PID-reuse window remains), while freeze/throttle/quarantine need cgroups and are Linux-only. Session safety (same session, session leader, parent shell, SSH chain), the macOS protection model and the data-loss gate (vialsof, failing closed) all apply on macOS. - No Windows native: Windows support is via WSL2 only.
- Uncalibrated posterior: the posterior is deliberately conservative and not yet calibrated against labeled outcomes, so
killrecommendations are rare; most candidates come back aspauseorreview. Robot mode gates on the posterior only (no conformal gate is applied yet). - Single-machine focus: Fleet mode plans across hosts over SSH; fleet apply does not execute remotely yet.
- No automatic recovery or restart:
ptreports failed actions but does not retry or roll back, and therestartaction is not executable yet. Supervised services are protected; stop them through their supervisor. - Library-only modules: many advanced models and collectors in the workspace (see Experimental Library Models) are tested but not wired into commands yet.
FAQ
Q: Will pt ever kill something it shouldn't?
It is built to avoid that. Interactive mode always asks for confirmation. Robot mode is off by default and, when enabled, needs --yes, 95%+ posterior for the event that justifies the action, RSS and kill-count limits, and live pre-checks (identity, protection, session safety, data-loss gate) immediately before each action. Protected processes are never candidates. It is still software: start with pt agent plan and review what it proposes.
Q: How does it learn from my decisions?
Kills you confirm in the TUI and verdicts you give with pt agent label --kill|--spare are saved to decisions.json. When pt sees a similar command pattern again, it replaces the prior with one learned from those counts (see "How pt Learns From Your Decisions"). Robot/agent applies are not learned from.
Q: Does it phone home?
No. All data stays on your machine. No telemetry, no analytics, no network calls except install.sh/pt update downloading releases and SSH to your own hosts in fleet mode.
Q: Can I use it in CI/CD?
Yes. pt agent plan --format json produces structured output with exit codes. Set robot_mode.enabled = true in policy.json and configure safety gates appropriately.
Q: What's the "Galaxy-Brain" mode?
The evidence ledger's detailed view that shows every Bayes factor, every evidence term contribution, and the full posterior computation. Available via pt agent explain --session <id> --pids <pid> --galaxy-brain and in the TUI.
Q: How is this different from kill -9?
pt tells you what to kill and why, with confidence scores and impact estimates. It also uses staged signals (SIGTERM first), validates process identity to prevent PID-reuse mistakes, and logs everything for audit.
Q: Why a Bayesian posterior instead of a simple heuristic? Simple heuristics work for obvious cases (zombie processes, 0% CPU for hours). The interesting cases are ambiguous: a process using 2% CPU might be doing useful background work or might be a stuck event loop. A posterior combines weak signals consistently, says how uncertain it is, and lets the action choice weigh the cost of being wrong. Richer models (change points, regime switching, queueing) exist in the library and will be wired in only where they measurably improve decisions.
Q: What happens if pt kills a supervised process?
It won't in normal use: processes classified as systemd services or container workloads are protected, and database/web servers and their workers are protected by name and ancestry. A verified terminal-pane workload inside a mux service is evaluated separately from its protected server. pt agent verify --check-respawn reports whether a killed process came back.
Q: How does provenance-aware blast radius differ from just counting child processes? On Linux it also traces shared resources: two processes that share a lockfile, a TCP listener on the same port, or a pidfile are connected even without a parent-child relationship, and a large shared footprint lowers the abandonment posterior. Plans also report each candidate's direct child count.
Q: Can I tune the Bayesian priors?
Yes. Edit ~/.config/process_triage/priors.json. Each of the four classes (Useful, Useful-Bad, Abandoned, Zombie) has configurable Beta distribution parameters for CPU, orphan status, TTY, network activity, I/O activity, queue saturation, and runtime (Gamma distribution). The defaults work well for development machines; production servers may want higher useful.prior_prob.
Q: What's TOON output format?
TOON is a token-optimized structured output format designed for AI agents. It's more compact than JSON (fewer tokens for the same information), making it cheaper to consume in LLM contexts. Use pt agent plan --format toon or set PT_OUTPUT_FORMAT=toon.
Q: Does pt detect stalled sockets?
In the TUI, when it collects deep evidence for a candidate: a socket backlog with a high estimated stall probability, more than 4 KB queued, or no I/O becomes a queue_saturated evidence term favoring Useful-Bad. agent plan does not use it yet. A fuller M/M/1 + EWMA model exists in the library only.
About Contributions
Please don't take this the wrong way, but I do not accept outside contributions for any of my projects. I simply don't have the mental bandwidth to review anything, and it's my name on the thing, so I'm responsible for any problems it causes; thus, the risk-reward is highly asymmetric from my perspective. I'd also have to worry about other "stakeholders," which seems unwise for tools I mostly make for myself for free. Feel free to submit issues, and even PRs if you want to illustrate a proposed fix, but know I won't merge them directly. Instead, I'll have Claude or Codex review submissions via gh and independently decide whether and how to address them. Bug reports in particular are welcome. Sorry if this offends, but I want to avoid wasted time and hurt feelings. I understand this isn't in sync with the prevailing open-source ethos that seeks community contributions, but it's the only way I can move at this velocity and keep my sanity.
Origins
Created by Jeffrey Emanuel after a session where 23 stuck bun test workers and a 31GB Hyprland instance brought a 64-core workstation to its knees. Manual process hunting is tedious; statistical inference should do the work.
License
MIT License (with OpenAI/Anthropic Rider) — see LICENSE for details.
Built with Rust, Bash, and hard-won frustration.
Documentation · Tutorials · Architecture · ADRs · Demos · Agent Guide · Math Proofs · Issues