
DasCondor/kubefactory
DasCondor/kubefactory has 44 GitHub stars and 1 forks. GitHot measured +7 stars in 24 hours. Last checked 2026-11-17 04:32 UTC. Last push 2026-11-14.
What you can do
- 🛠️ It manages the real thing. Every action goes to your cluster with your own kubeconfig, or to your own docker, as you: logs, events, rolling restarts, scaling, cordon and drain, deleting pods and workloads, deploying and removing complete stacks. Nothing sits in between and no credentials are stored.
- 🏠 Made for your own gear. Point it at a homelab cluster, a cloud cluster, Docker on your PC or several Docker hosts, or your Komodo servers. Compose projects show up as namespaces, and Porter deploys ready-made stacks: a media server, a monitoring dashboard, WordPress, databases.
- 🔒 Look without handing over root. Other Docker hosts open read-only, a ready-made proxy makes each host refuse changes on its own, and Komodo connections only ever read.
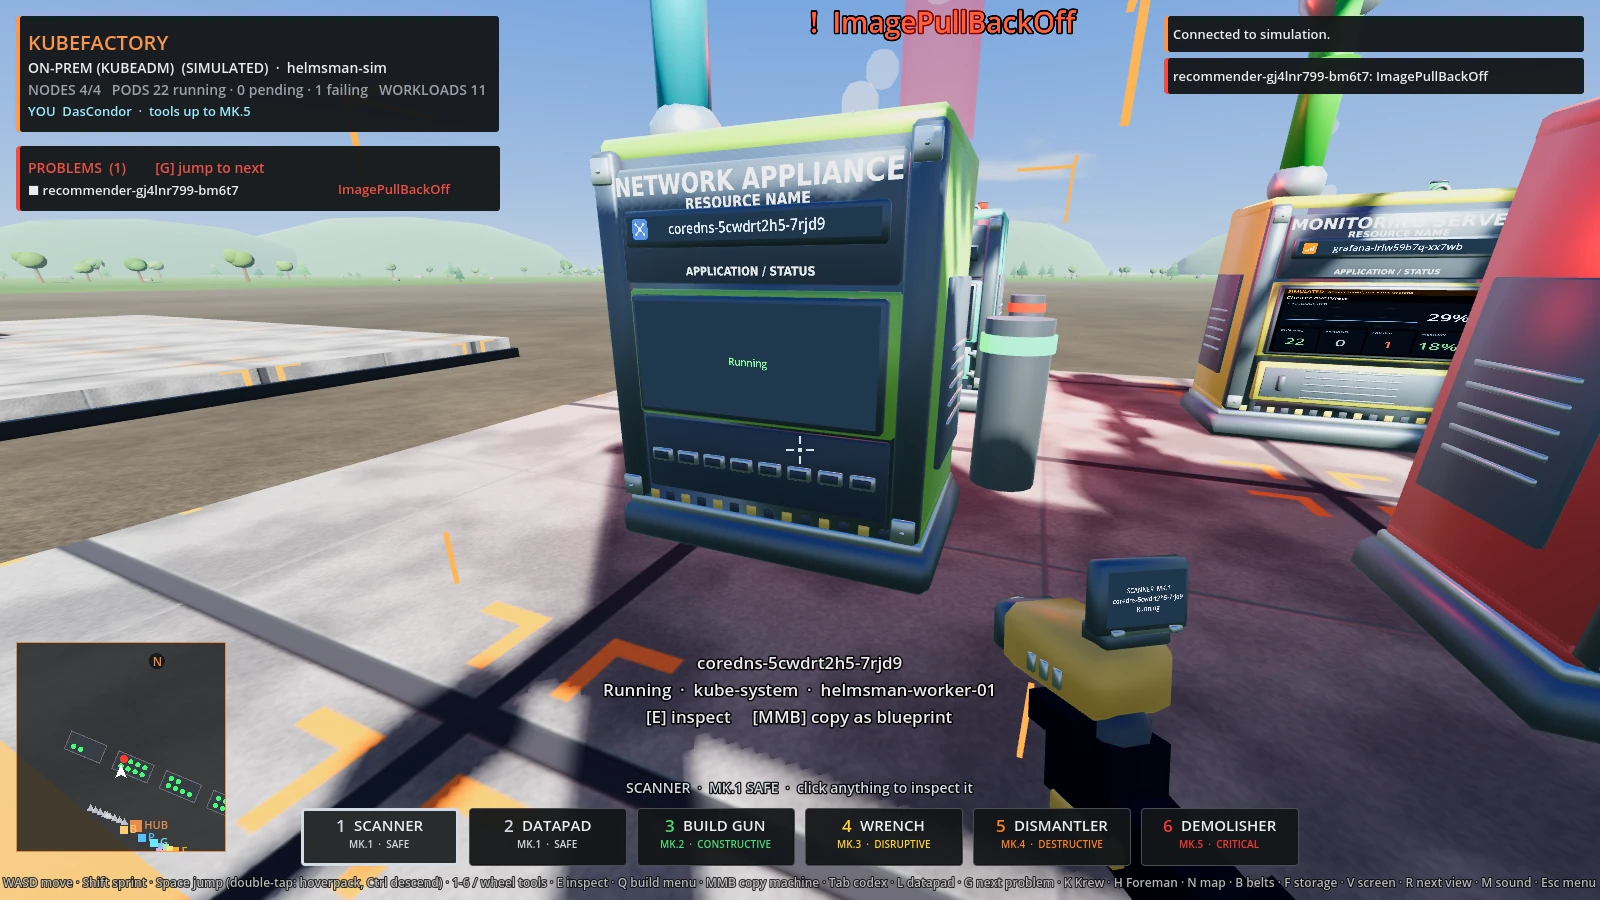
- 🗺️ See the whole cluster at a glance. Nodes are platforms, pods are machines, services are conveyor belts. A failing pod throws a red light column you can see from anywhere.
Measured star growth
- in 24h
- +7
- in 7 days
- Collecting history
- in 15 days
- Collecting history
- in 1 month
- Collecting history
Net star changes over overlapping periods, not daily totals. Missing measurements are left blank. Stars measure attention, not software quality.
About
A first-person factory game that views and manages your Kubernetes clusters and Docker containers
Developer ToolsREADME.md
Original🏭 KubeFactory
Your cluster is the factory. Go run it.
Not just a game: a real way to manage your containers, Kubernetes clusters and stacks. It looks like a first-person factory game, but the factory is your own setup. Walk your Kubernetes clusters, your Docker hosts or your Komodo servers, spot what is broken from across the yard, read the logs, restart, scale, deploy whole stacks and tear them down, all with a belt of six tools, with a crew of robots that watch it for you. Built for personal and homelab use.







Play · Download · Editions · The world · Tools · The Krew · Settings · Porter · Bob · Server · Plugins · Contributing · All docs
✨ Why use it
- 🛠️ It manages the real thing. Every action goes to your cluster with your own kubeconfig, or to your own
docker, as you: logs, events, rolling restarts, scaling, cordon and drain, deleting pods and workloads, deploying and removing complete stacks. Nothing sits in between and no credentials are stored. - 🏠 Made for your own gear. Point it at a homelab cluster, a cloud cluster, Docker on your PC or several Docker hosts, or your Komodo servers. Compose projects show up as namespaces, and Porter deploys ready-made stacks: a media server, a monitoring dashboard, WordPress, databases.
- 🔒 Look without handing over root. Other Docker hosts open read-only, a ready-made proxy makes each host refuse changes on its own, and Komodo connections only ever read.
- 🗺️ See the whole cluster at a glance. Nodes are platforms, pods are machines, services are conveyor belts. A failing pod throws a red light column you can see from anywhere.
- 🔧 Six tools, five tiers. From a harmless scanner to the Mk.5 Demolisher. Stronger actions take a longer hold, and the worst ones make you type the target's name.
- 👴 Bob, the pod fixer. An old hand with a repair stand, a live fix list, a diagnosis for every failure, and a zinger for every operator.
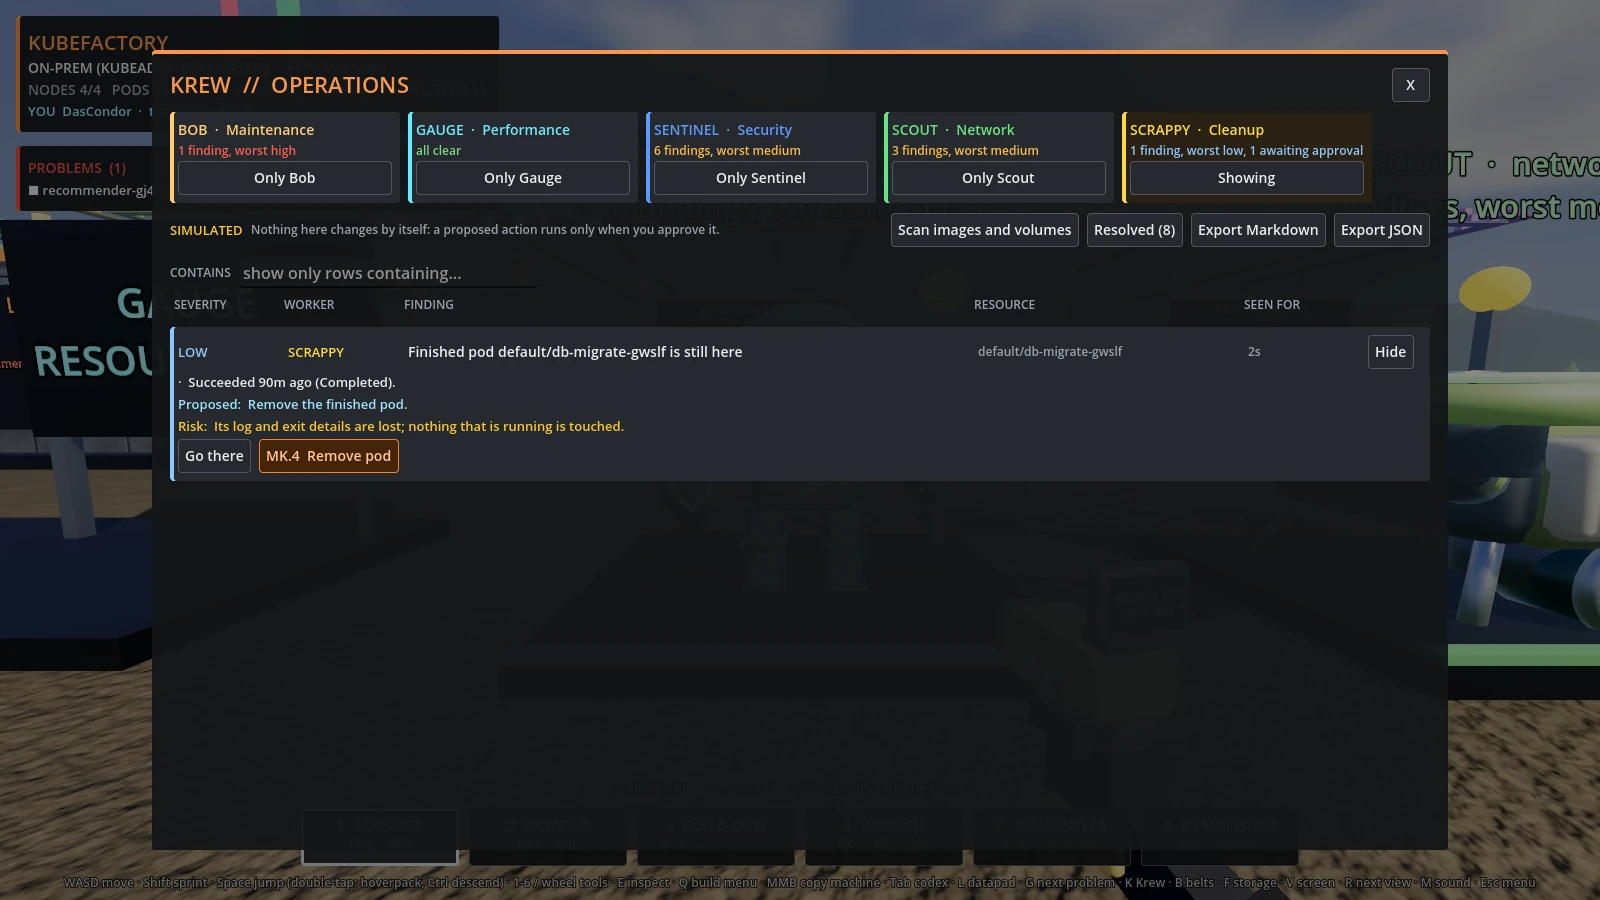
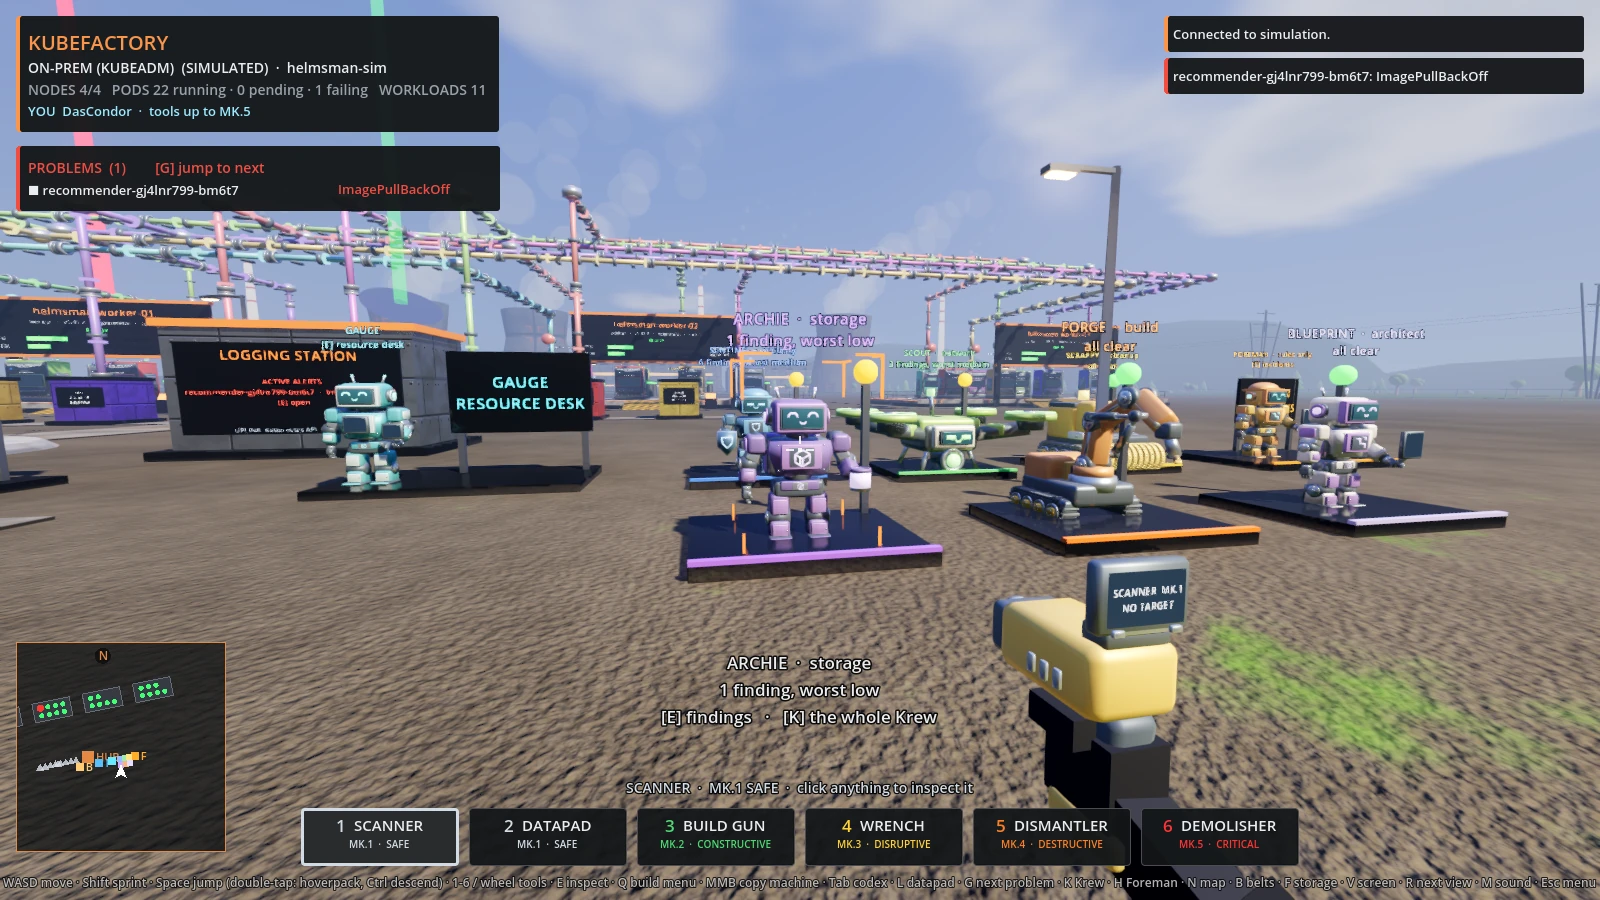
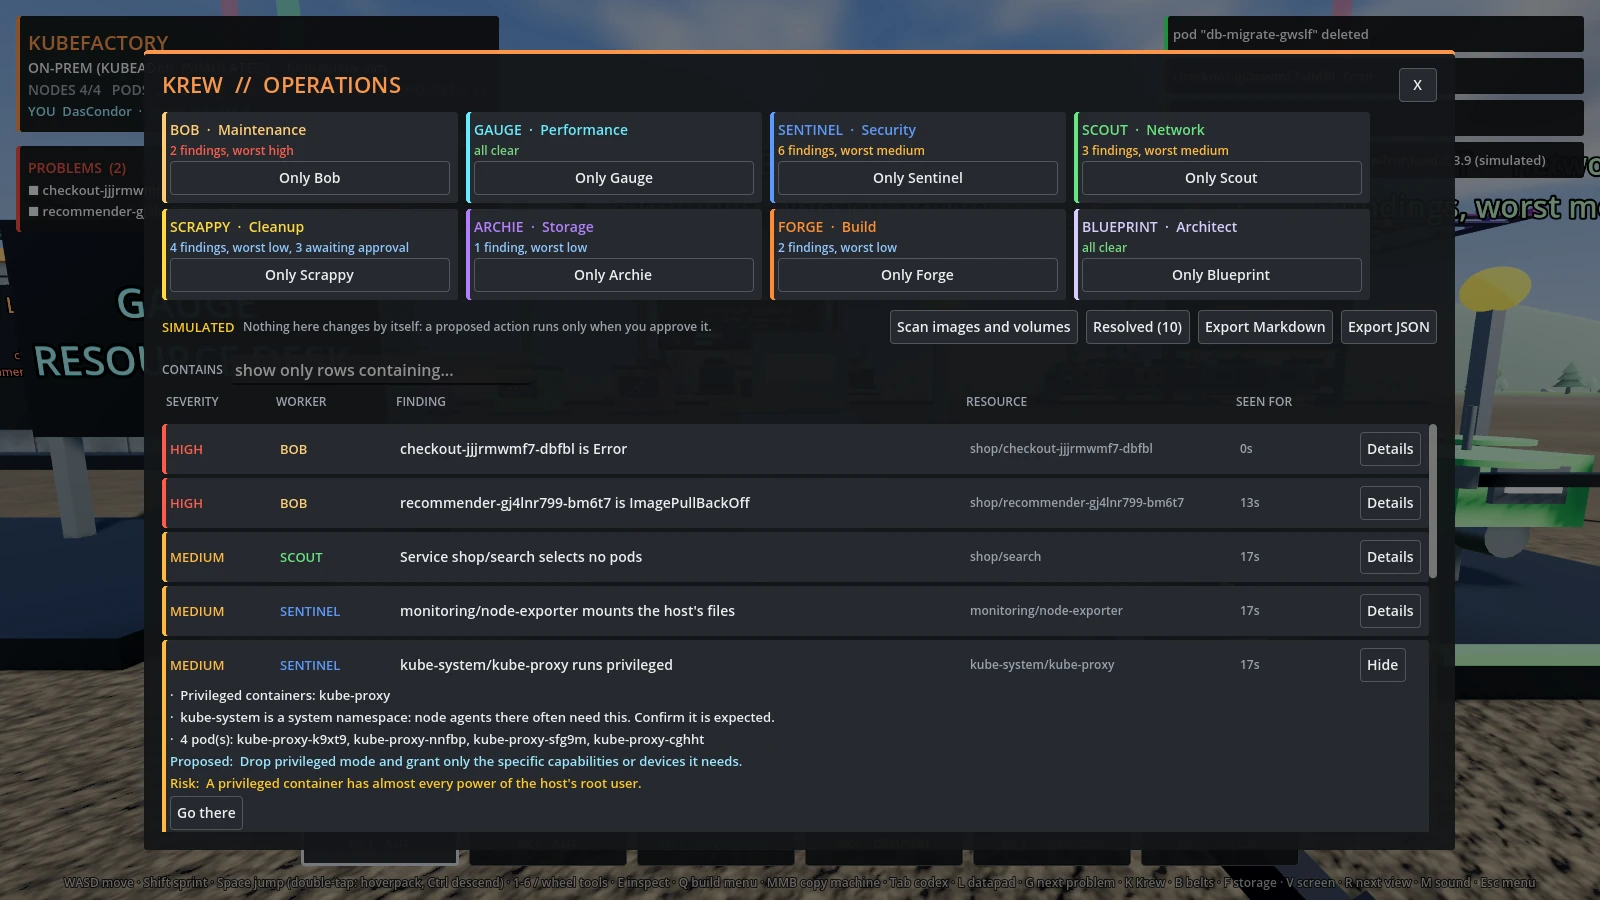
- 🤖 The Krew watches for you. Sentinel (security), Scout (network), Scrappy (cleanup), Archie (storage), Forge (build), Blueprint (drift) and Gauge (resources) report findings with evidence, a proposed fix and its risk. Nothing changes until you approve it.
- 🧑✈️ Foreman, with or without AI. He groups the Krew's findings into incidents with no AI at all; add Ollama, LM Studio, OpenAI, Claude or your own endpoint to ask in plain words. What an AI proposes is checked and still needs your approval.
- 🤖 Porter, the dock worker. Asks what you want built and cranes a complete app setup onto the cluster.
- 🧯 Guard rails on the dangerous parts. Read-only mode, tool tiers, hold-to-confirm, typed confirmation for the worst actions, and an audit log of everything you do.
- 👥 Use it as a team. Colleagues on the same cluster show up as avatars, each held to the tool tier the admin allows. Or run one KubeFactory server and let everyone connect to it with a token, holding no credentials of their own.
- 🧩 Extend it. Backend plugins add new kinds of sources in any language; they run only once you trust them.
- ⚙️ Play it your way. Rebind every key, use a controller, set the field of view and interface size, and pick a colour-blind palette, all in the game. A minimap shows where everything is.
- 🧪 Try it safely first. Four simulated demo worlds let you use every tool without touching anything real.
- 📺 Screens that show the real thing. Each machine's screen steps through its application's own page, its metrics, its log and its storage. Click it to open it full size.
- 💻 Windows, Linux, macOS and the browser. Built with Godot 4.3. Every release package carries a checksum and a signed record of how it was built.
📸 Screenshots
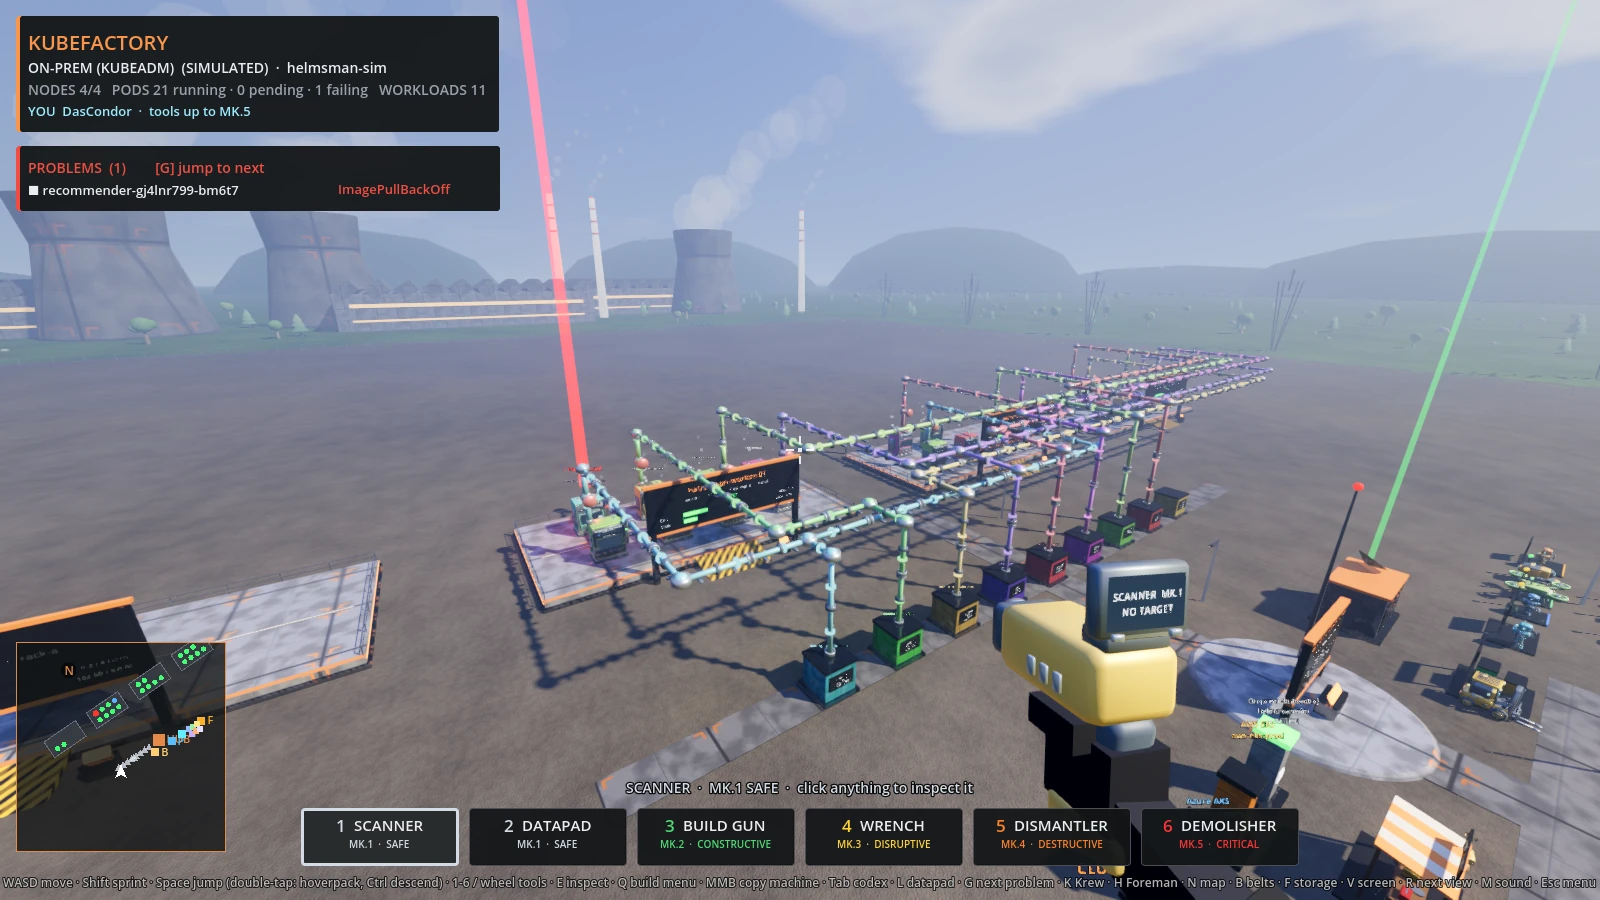 Nodes are platforms, pods are machines; red beams mark failing pods |
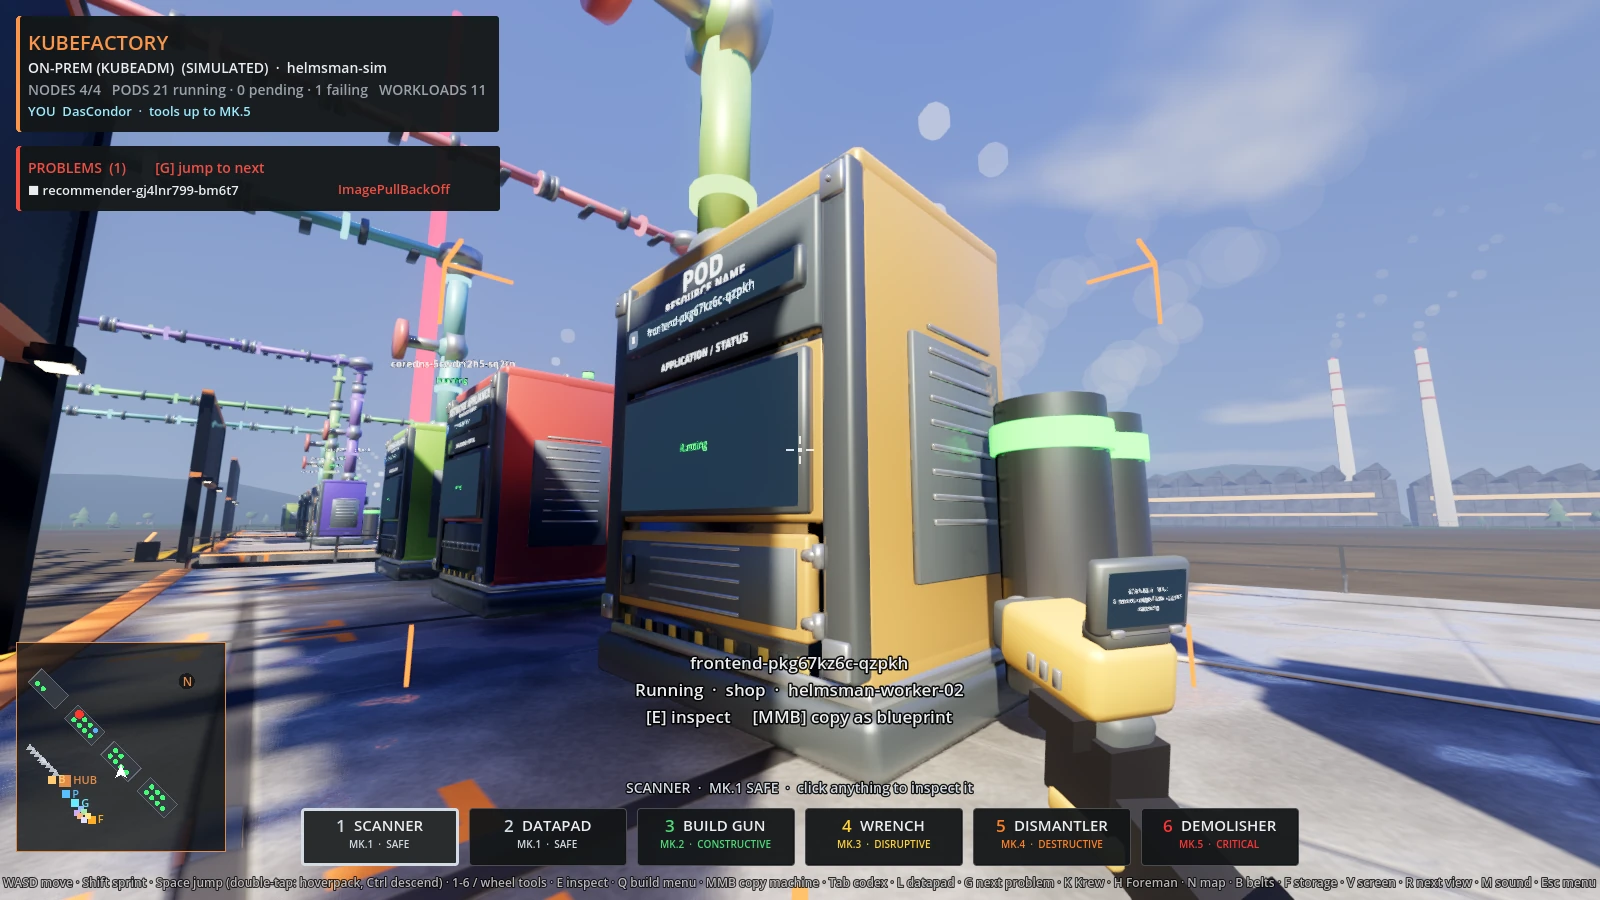 Every machine says what it is: a type plate, the real pod name with an icon for what it runs, and a screen |
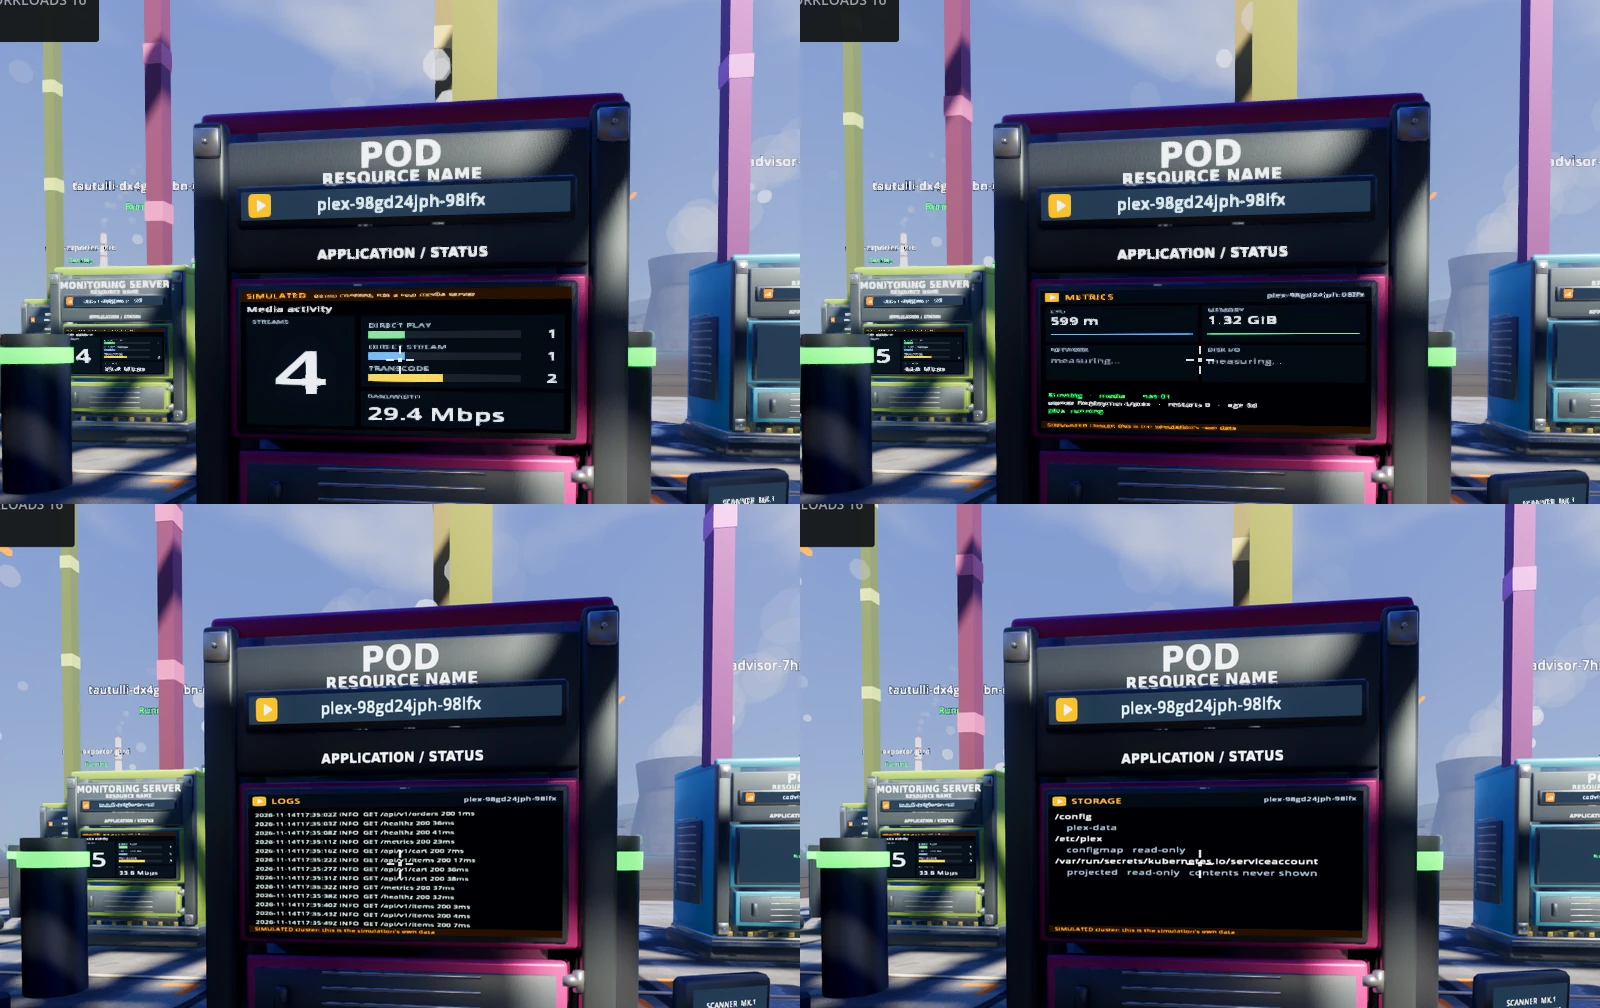 One screen, four views: dashboard, metrics, logs, storage. R steps through them |
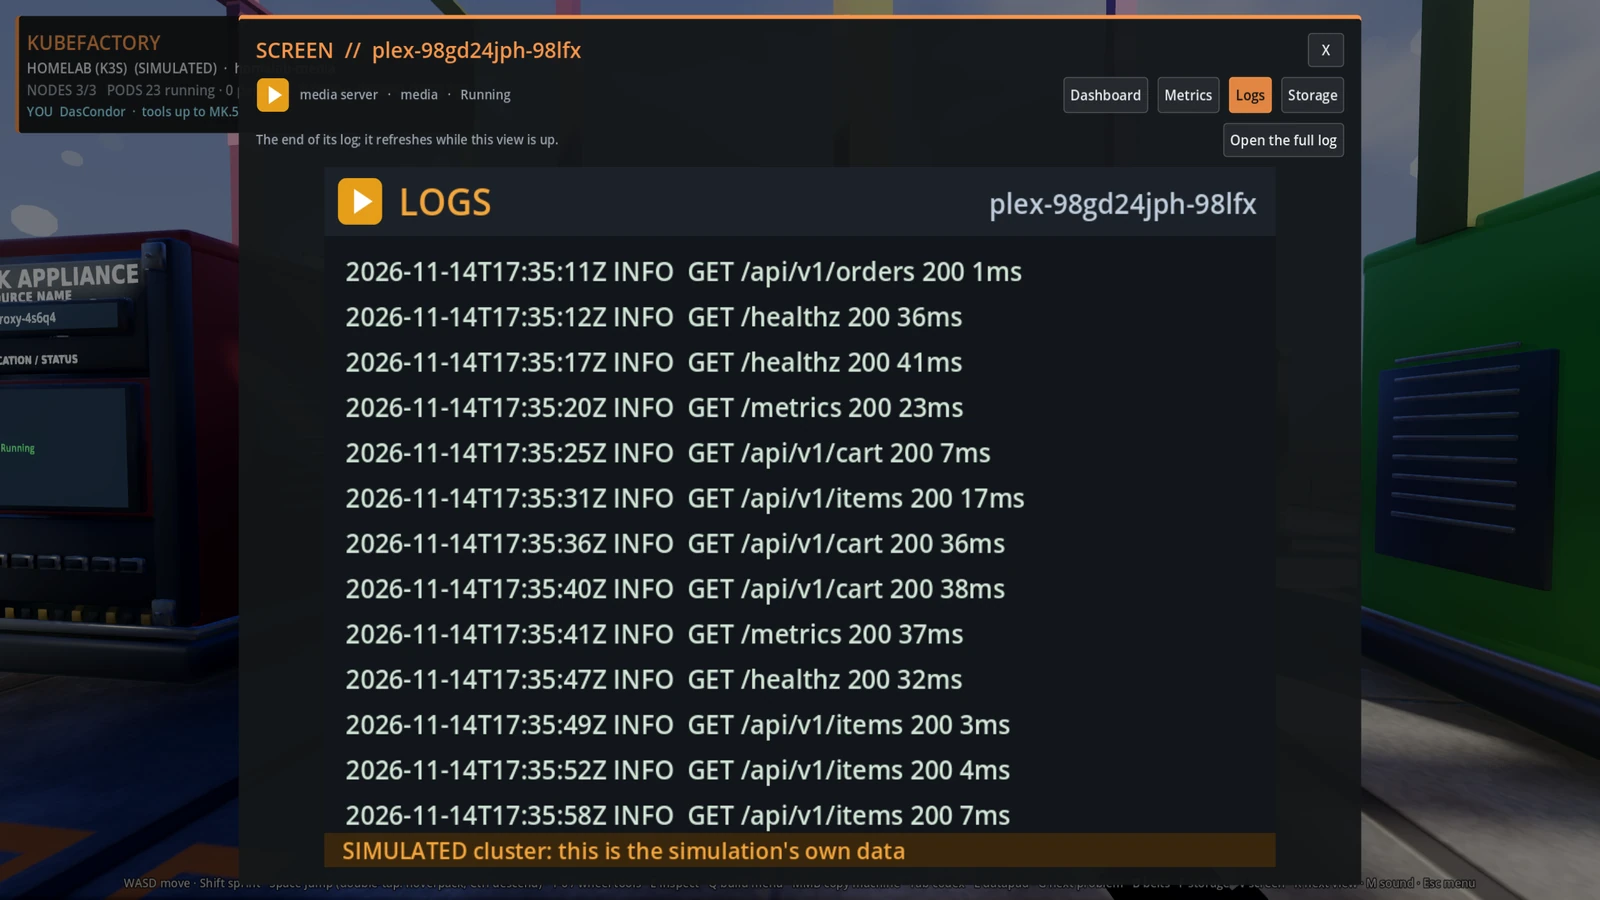 Click a screen to open it full size and switch views there |
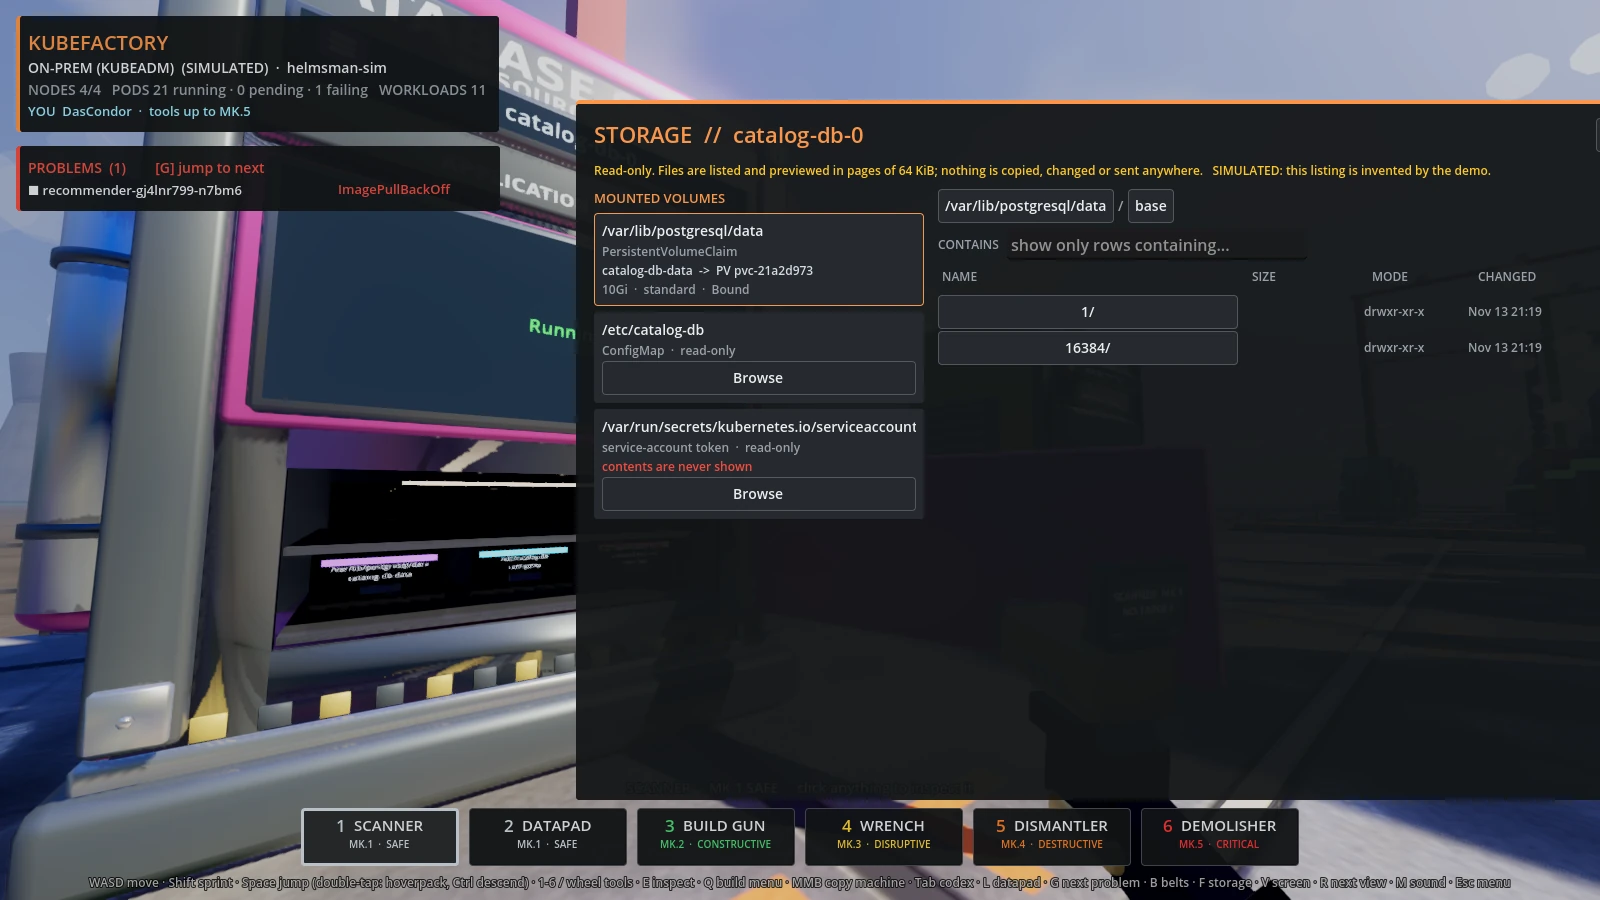 Open a machine's door ( F) to browse its volumes, read-only |
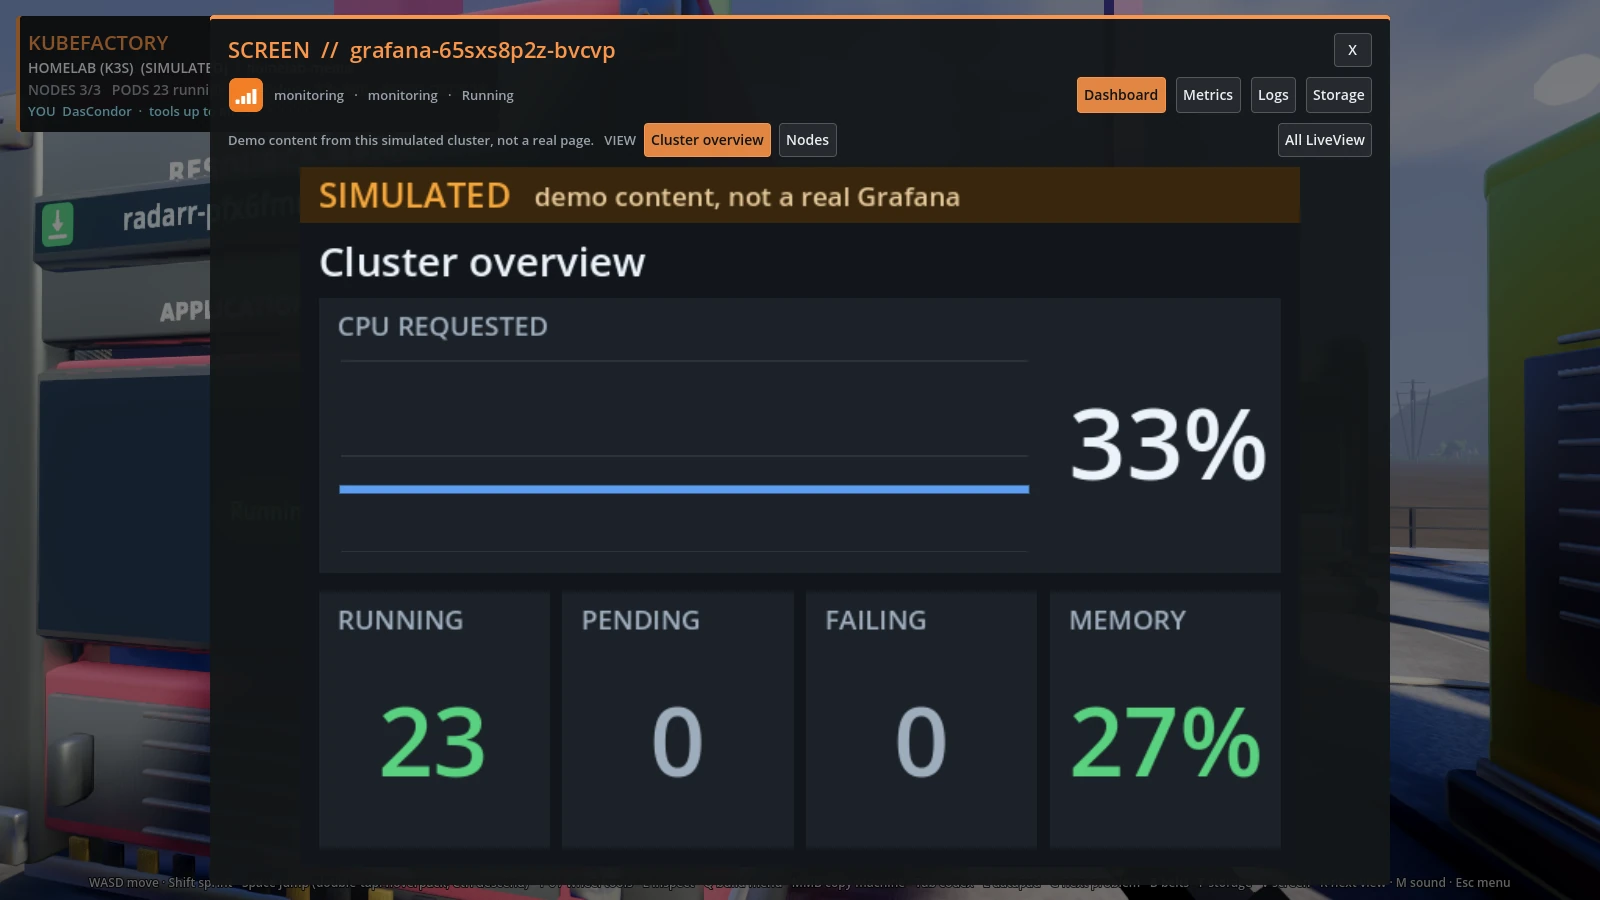 The demo's Grafana and media screens show simulated content, marked as such |
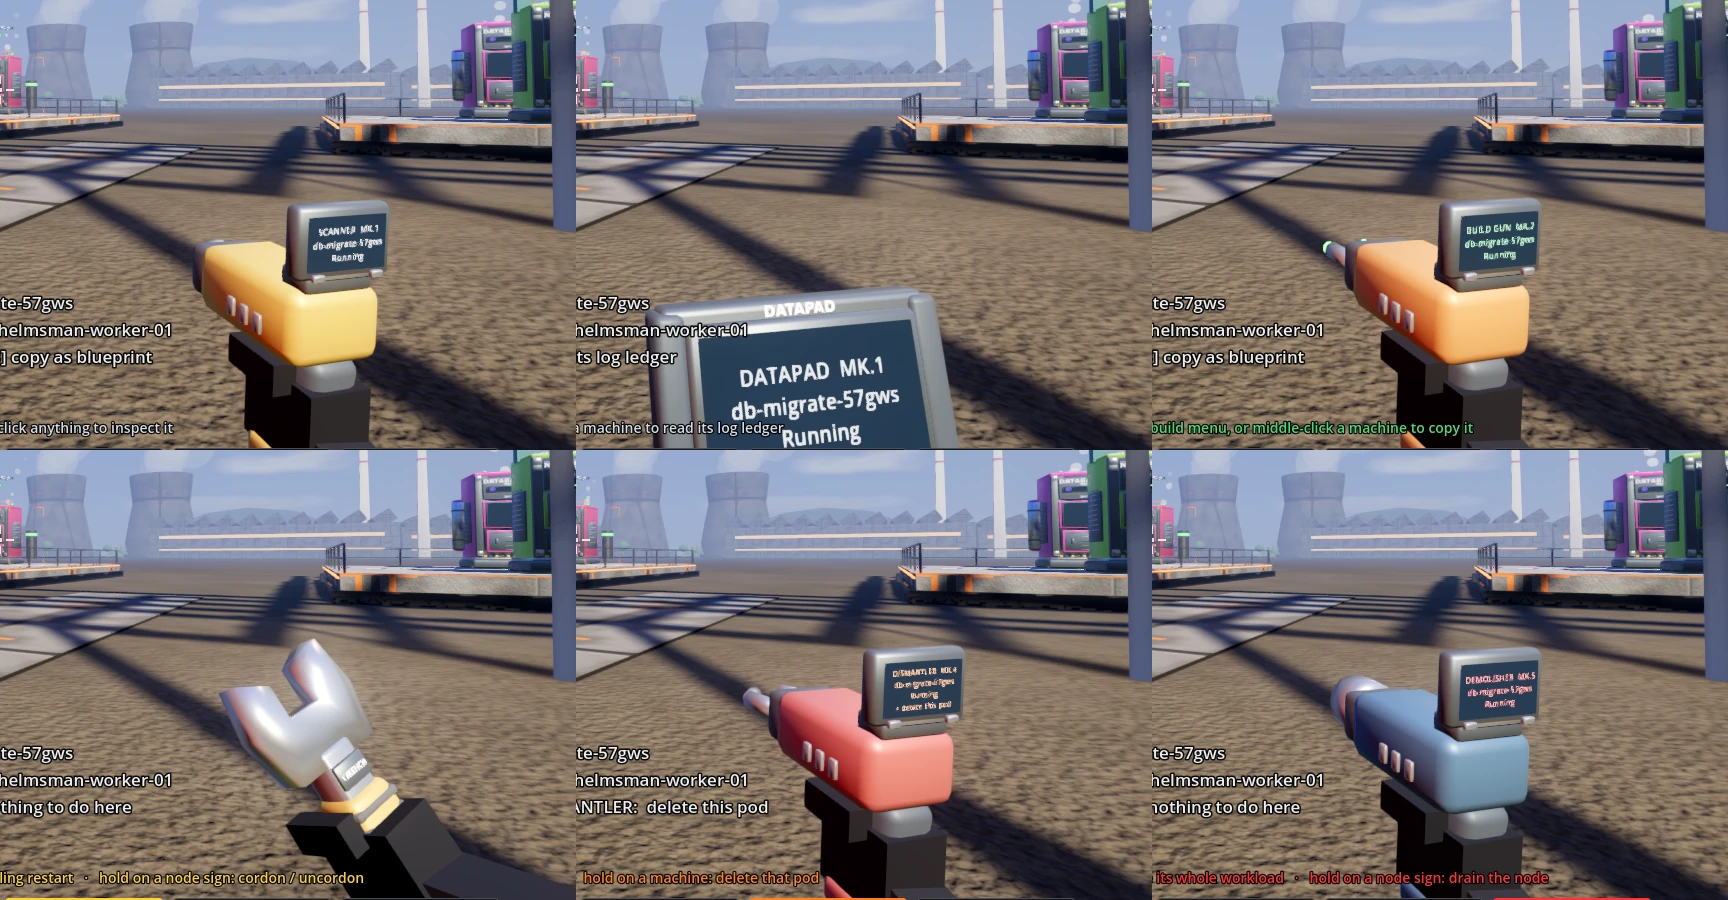 Six tools; each one's display shows what it is pointed at and what the trigger would do |
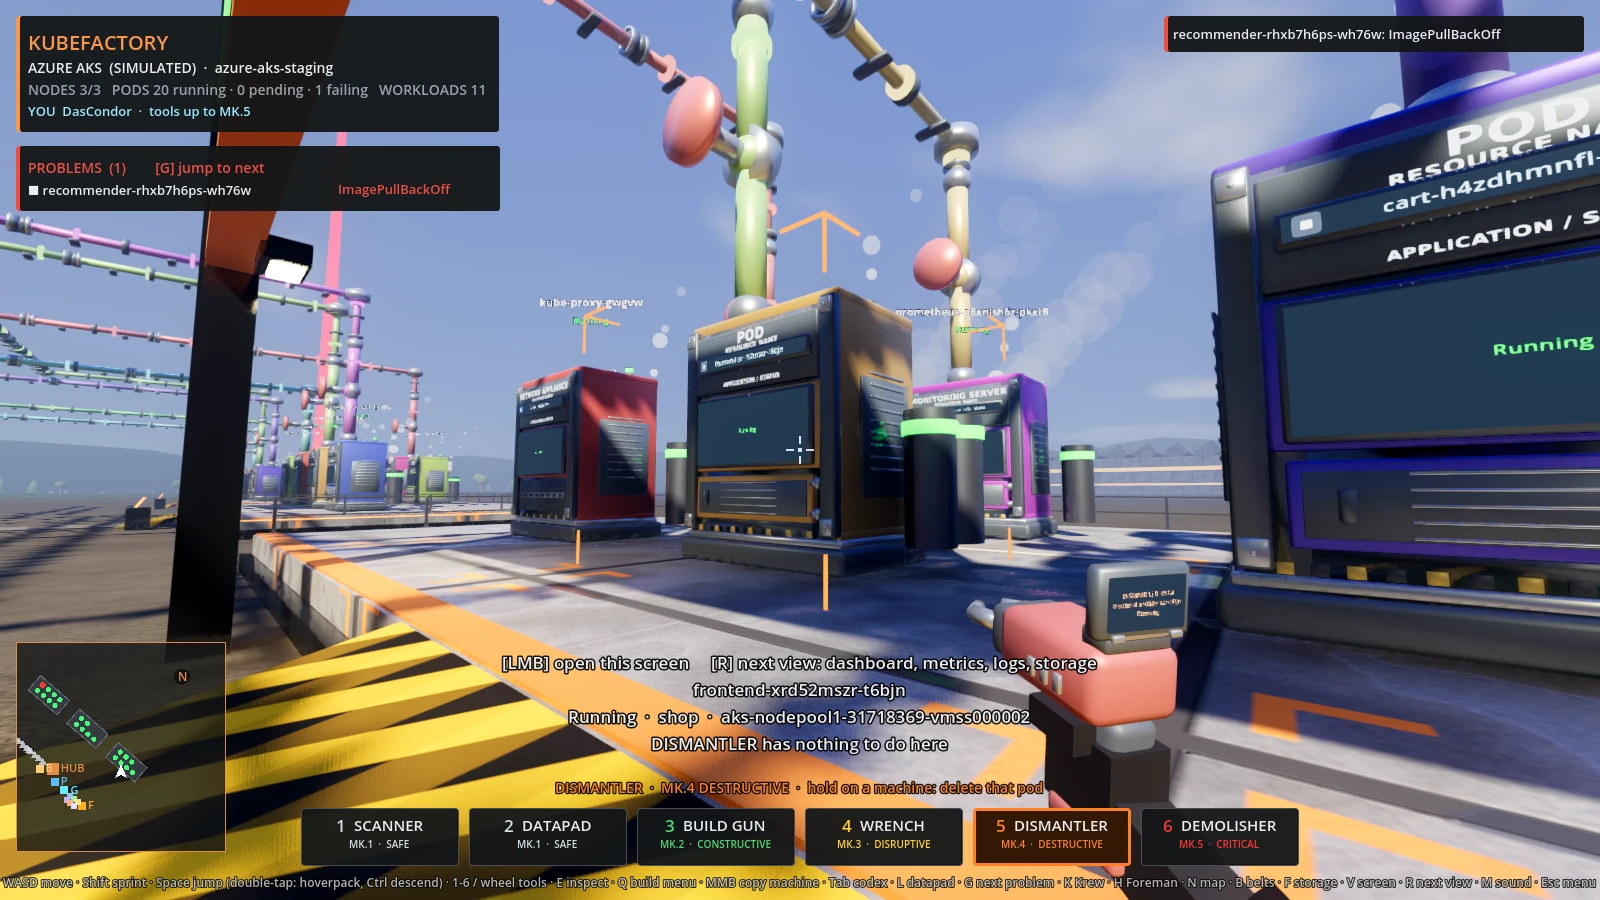 Hold to act: stronger tools take longer |
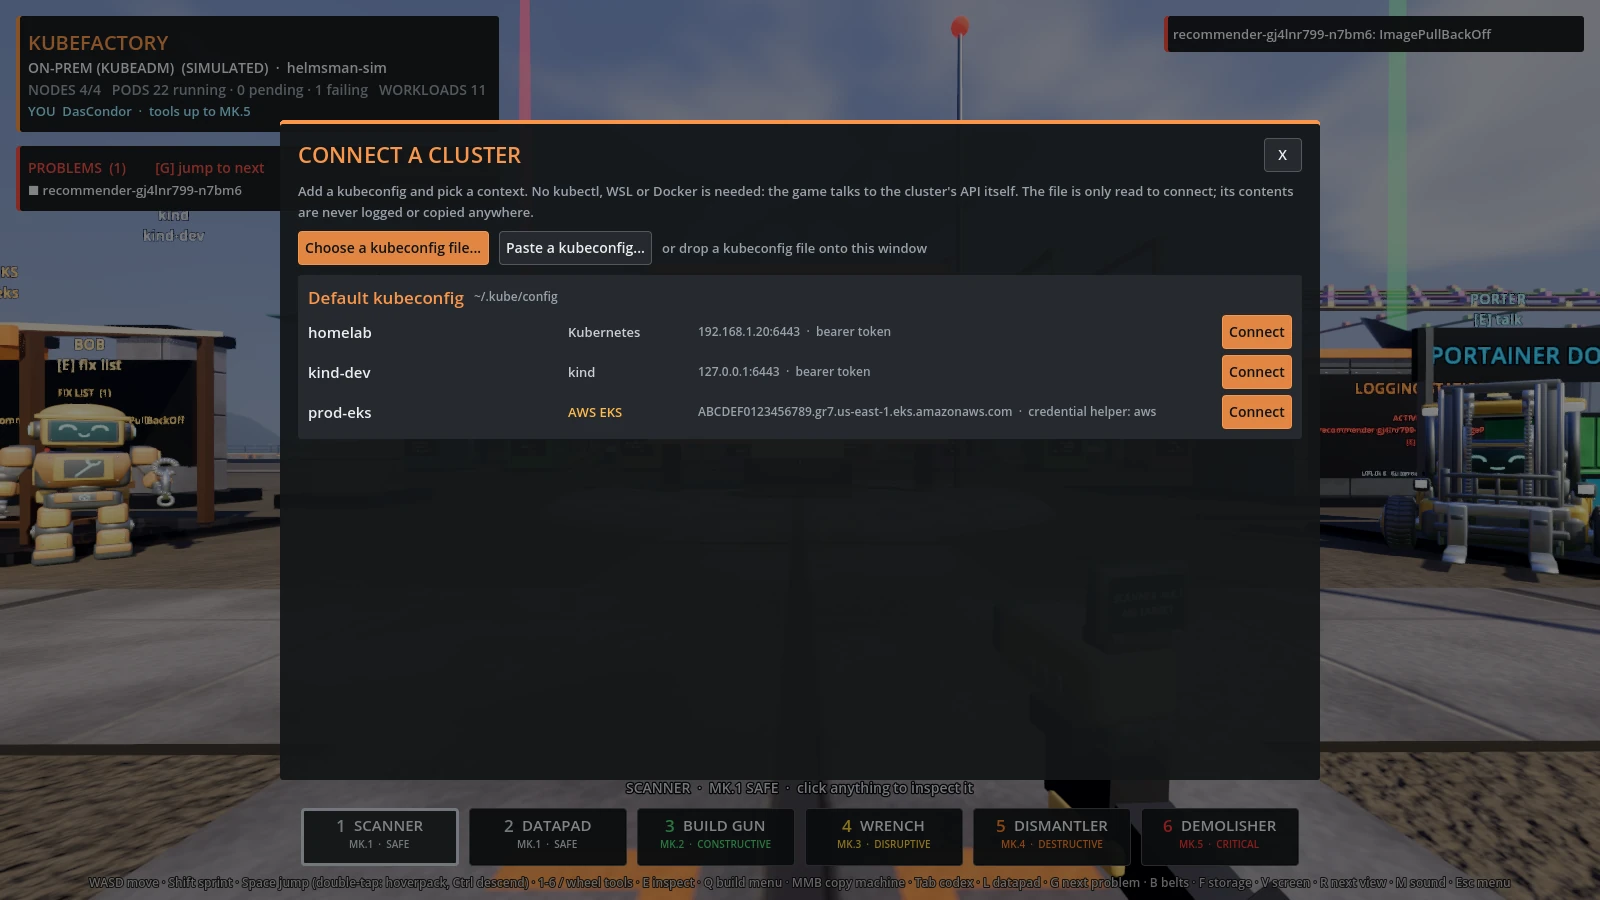 Connect with a kubeconfig, no kubectl: KubeFactory.exe --kubeconfig <file> |
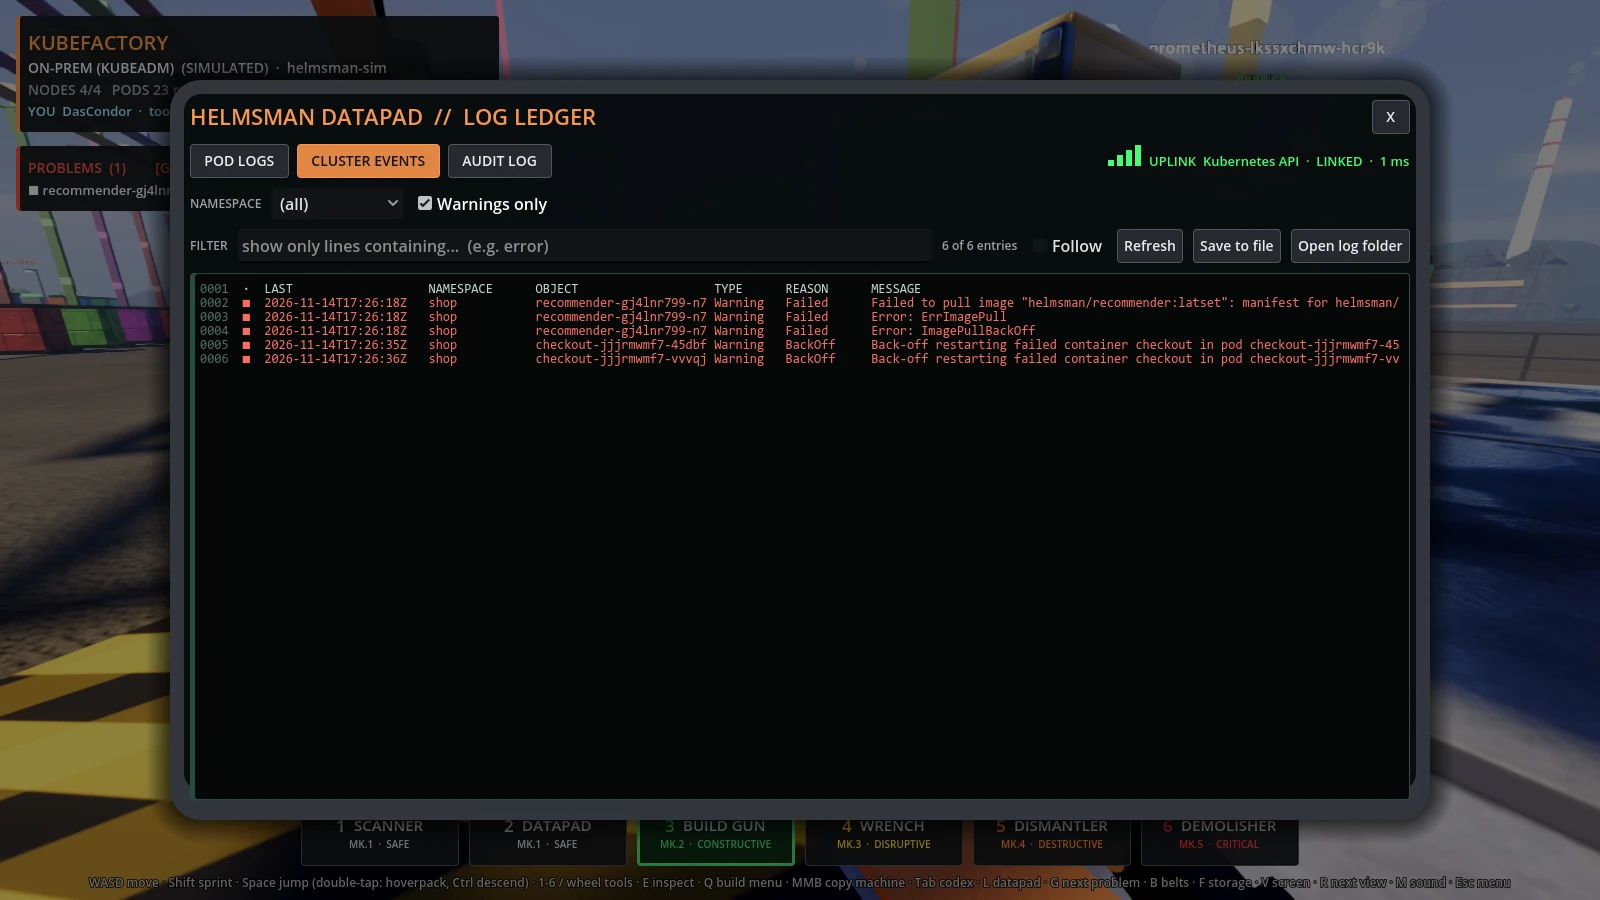 The datapad: logs, events and the audit ledger |
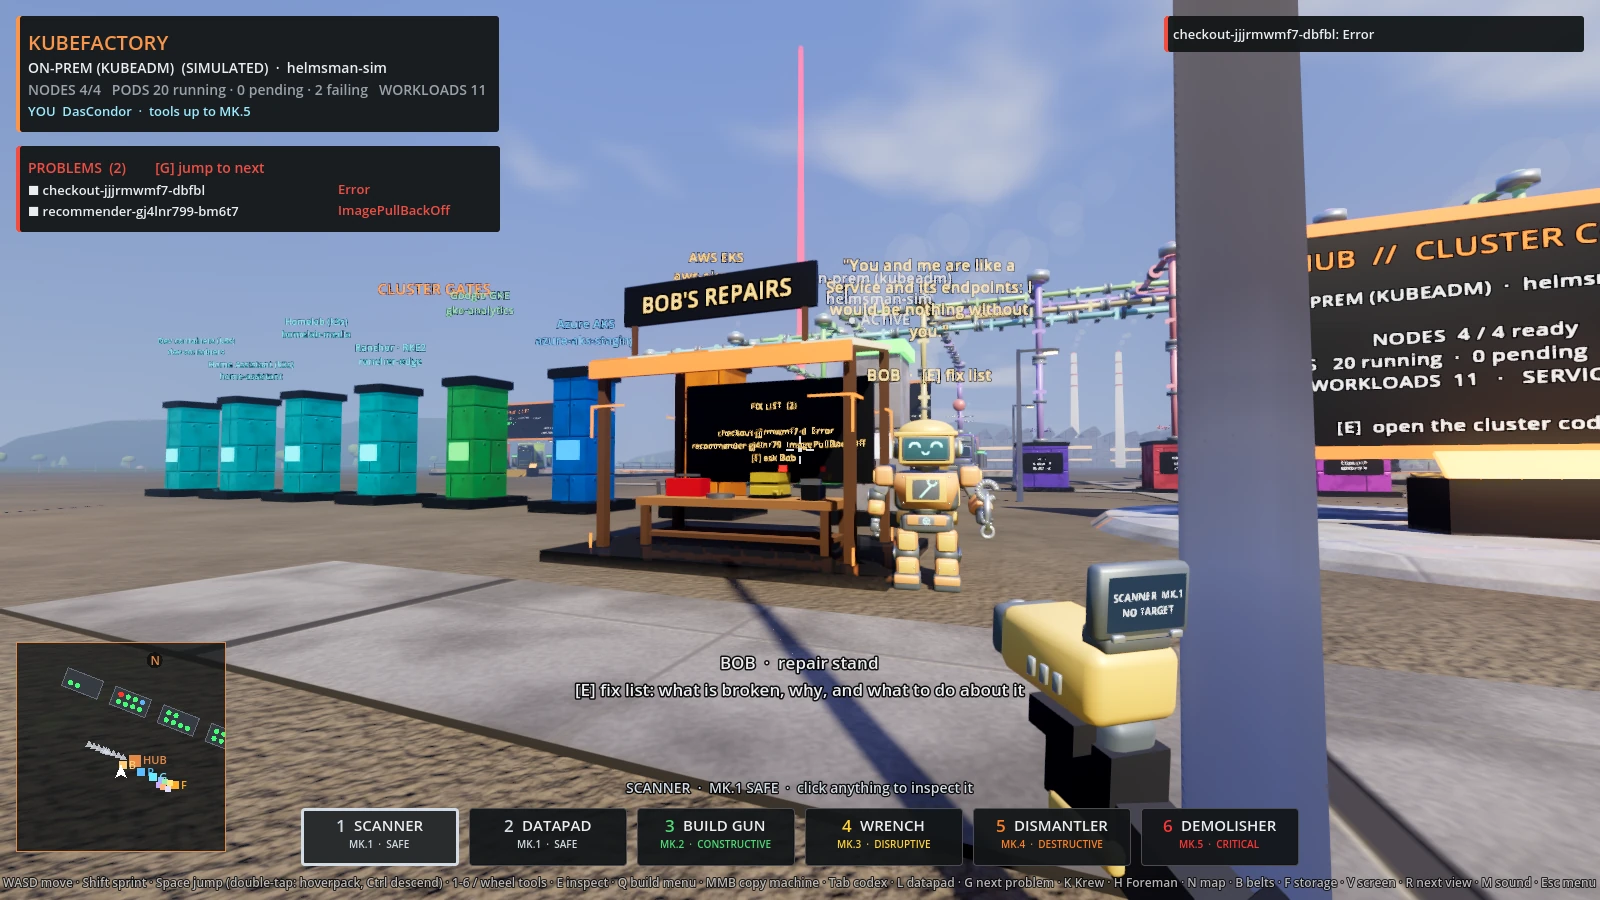 Bob's repair stand: the board lists what is broken, and he has something to say about it |
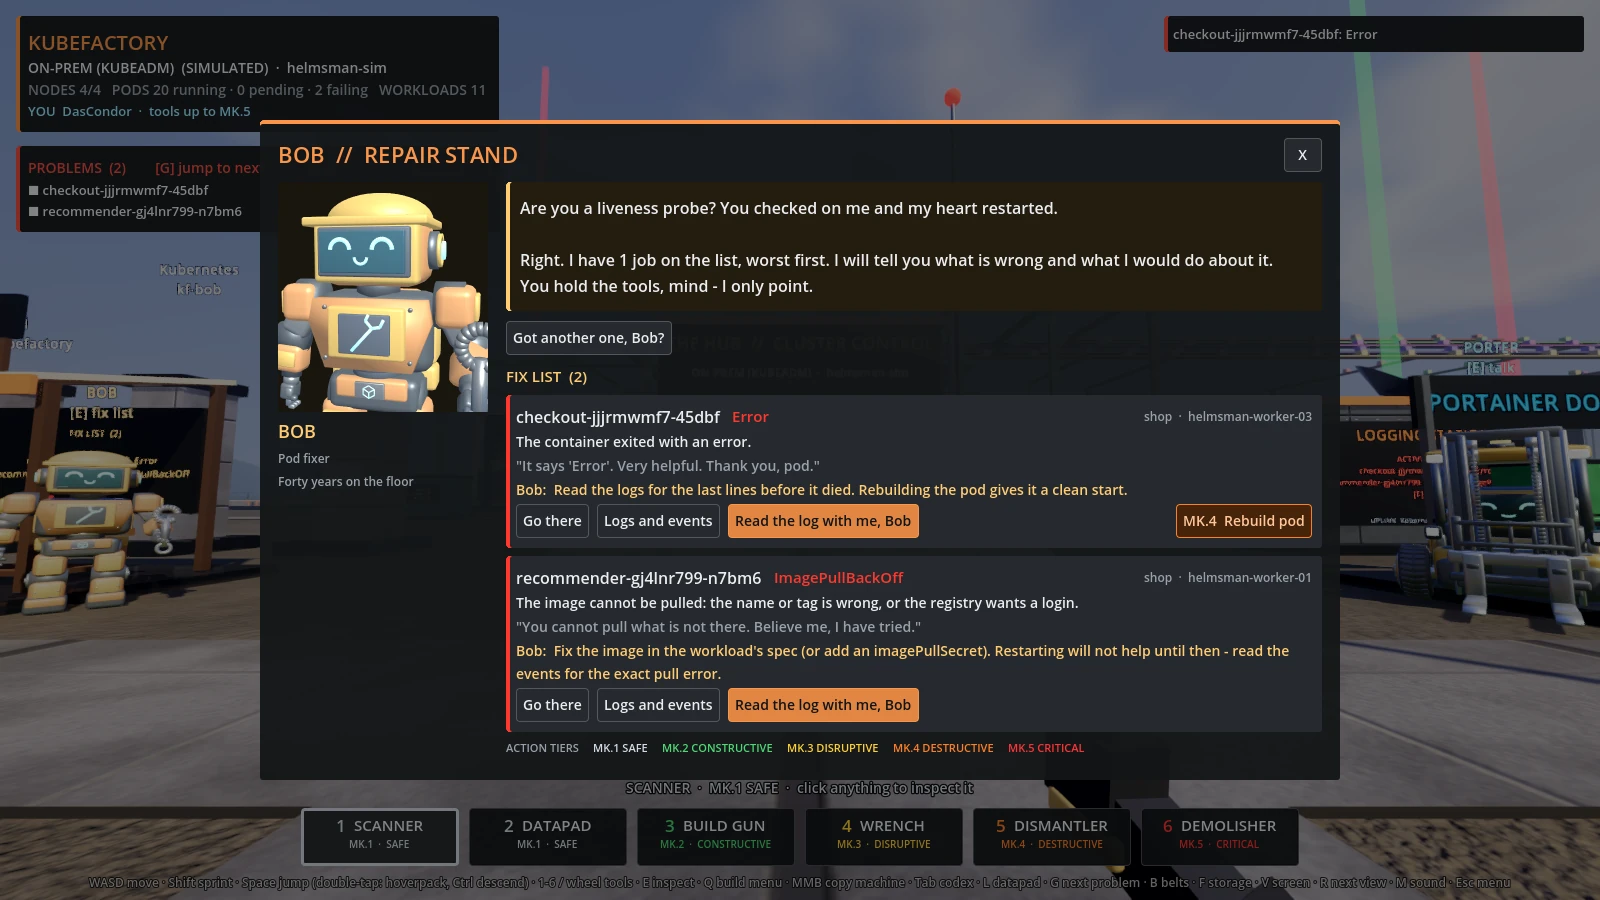 His fix list: what is broken, why, and what to do |
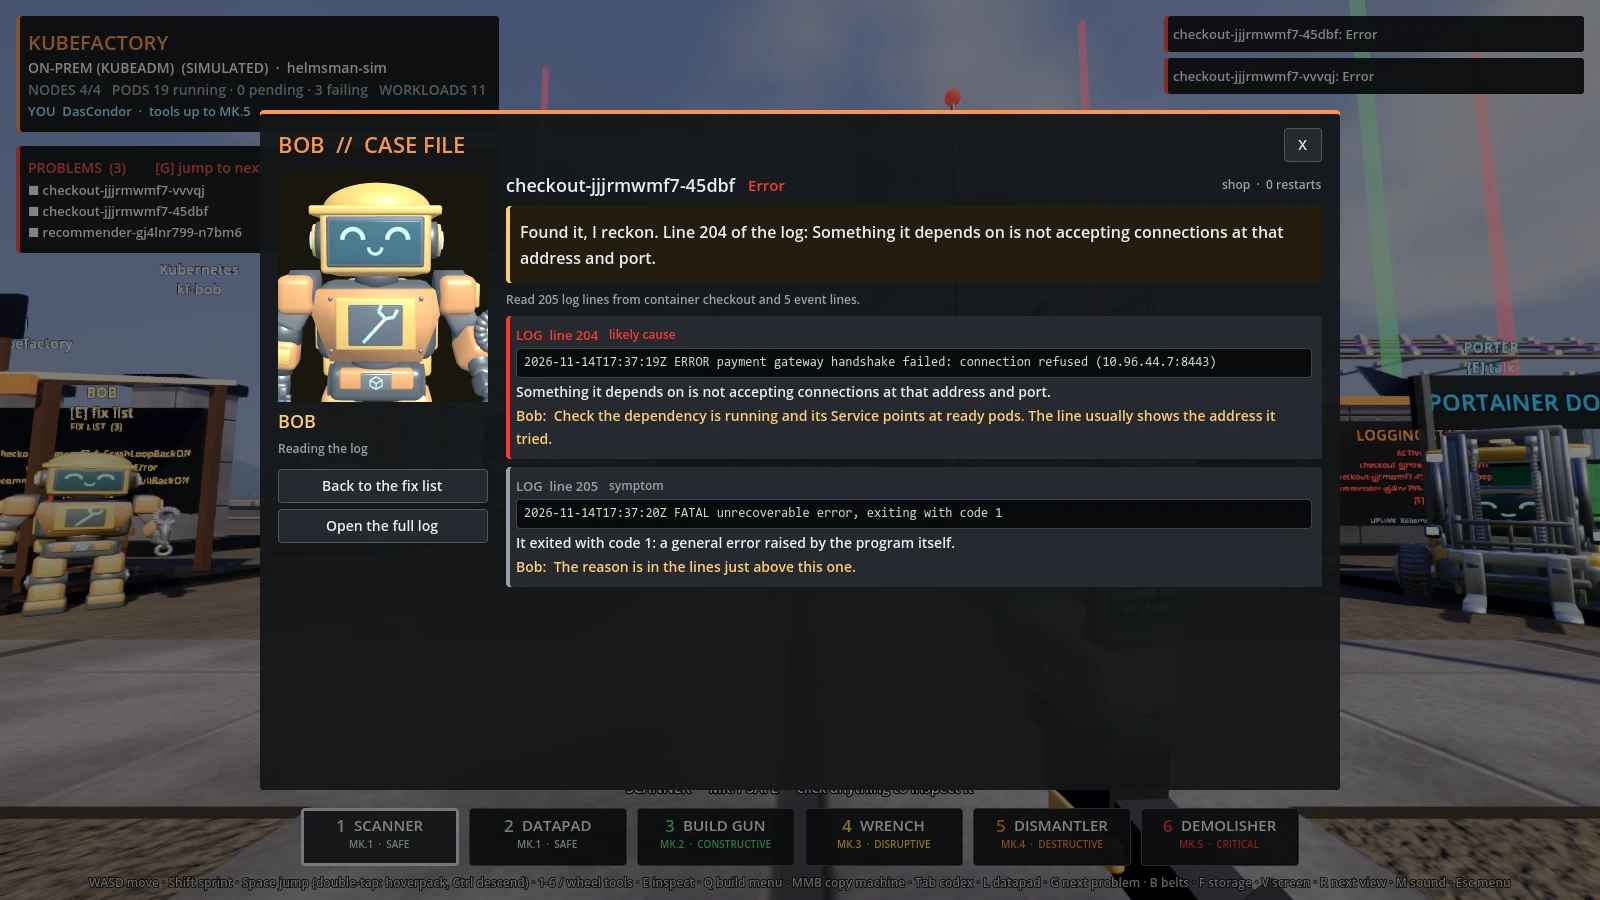 Bob 2.0 reads the log: the line that killed it, what it means, what to do |
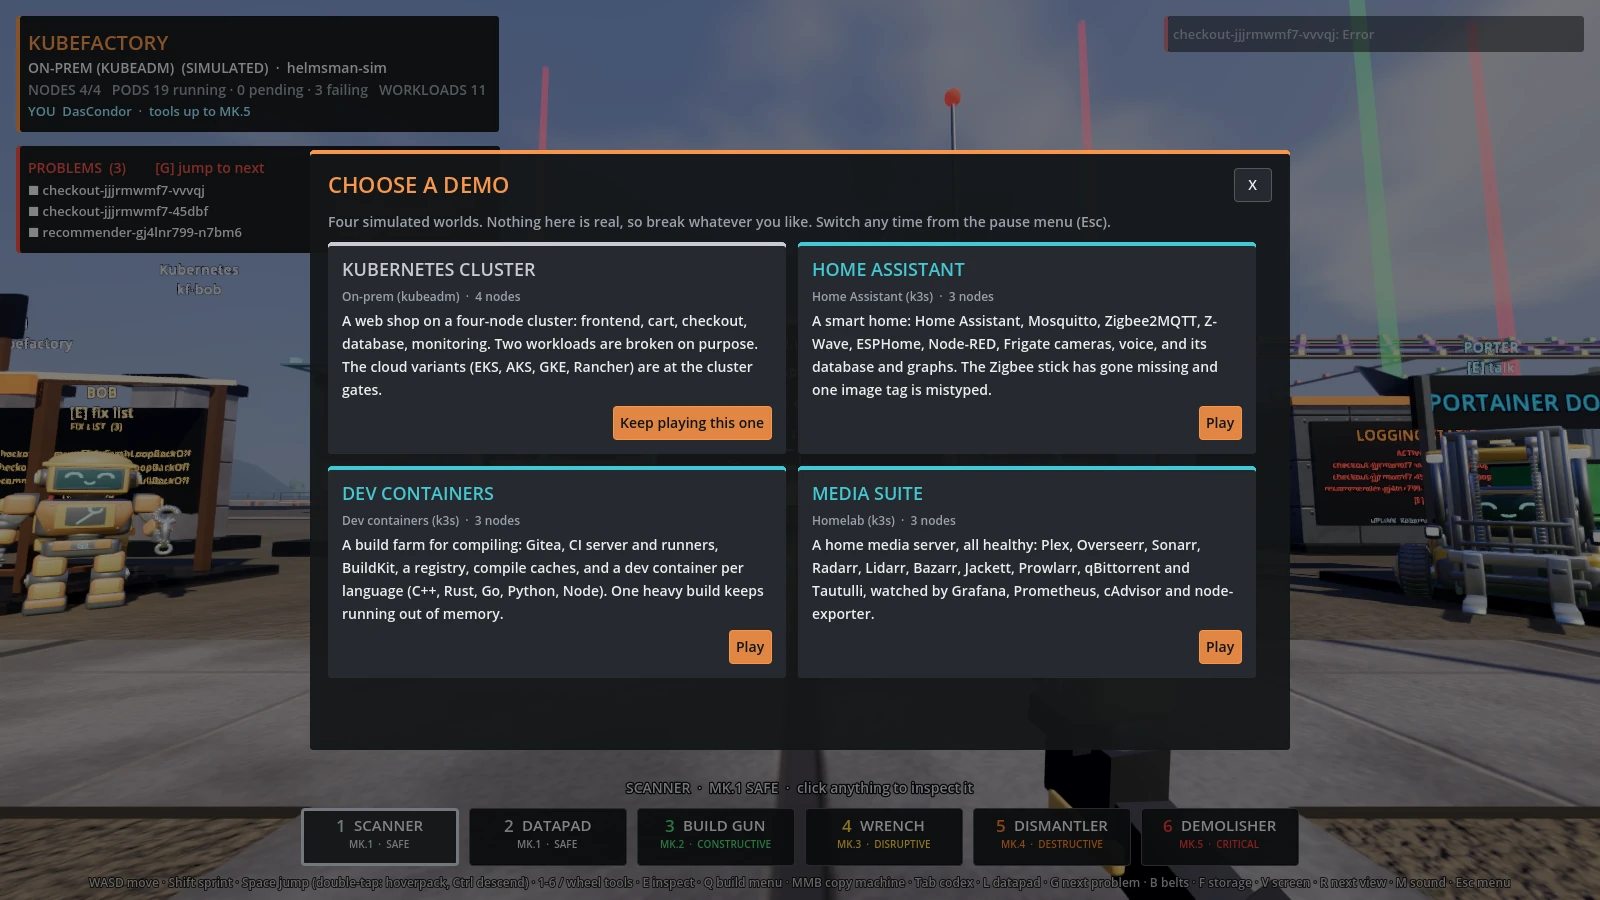 Four demo worlds to try everything safely |
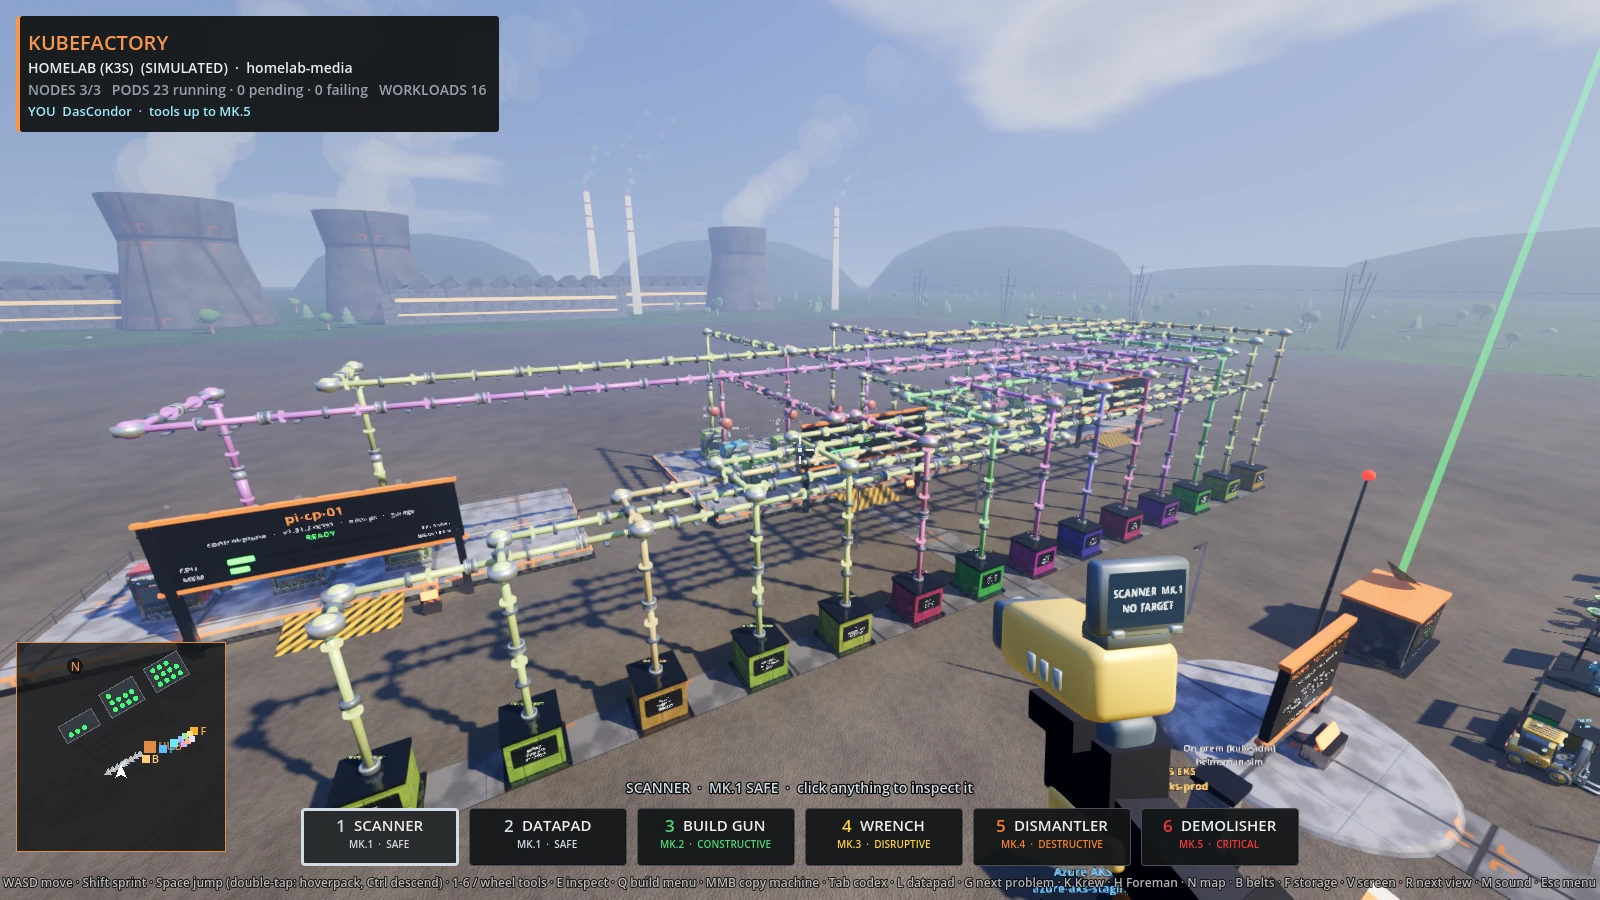 The media suite world: Plex, Sonarr, Radarr, Jackett and friends, all healthy |
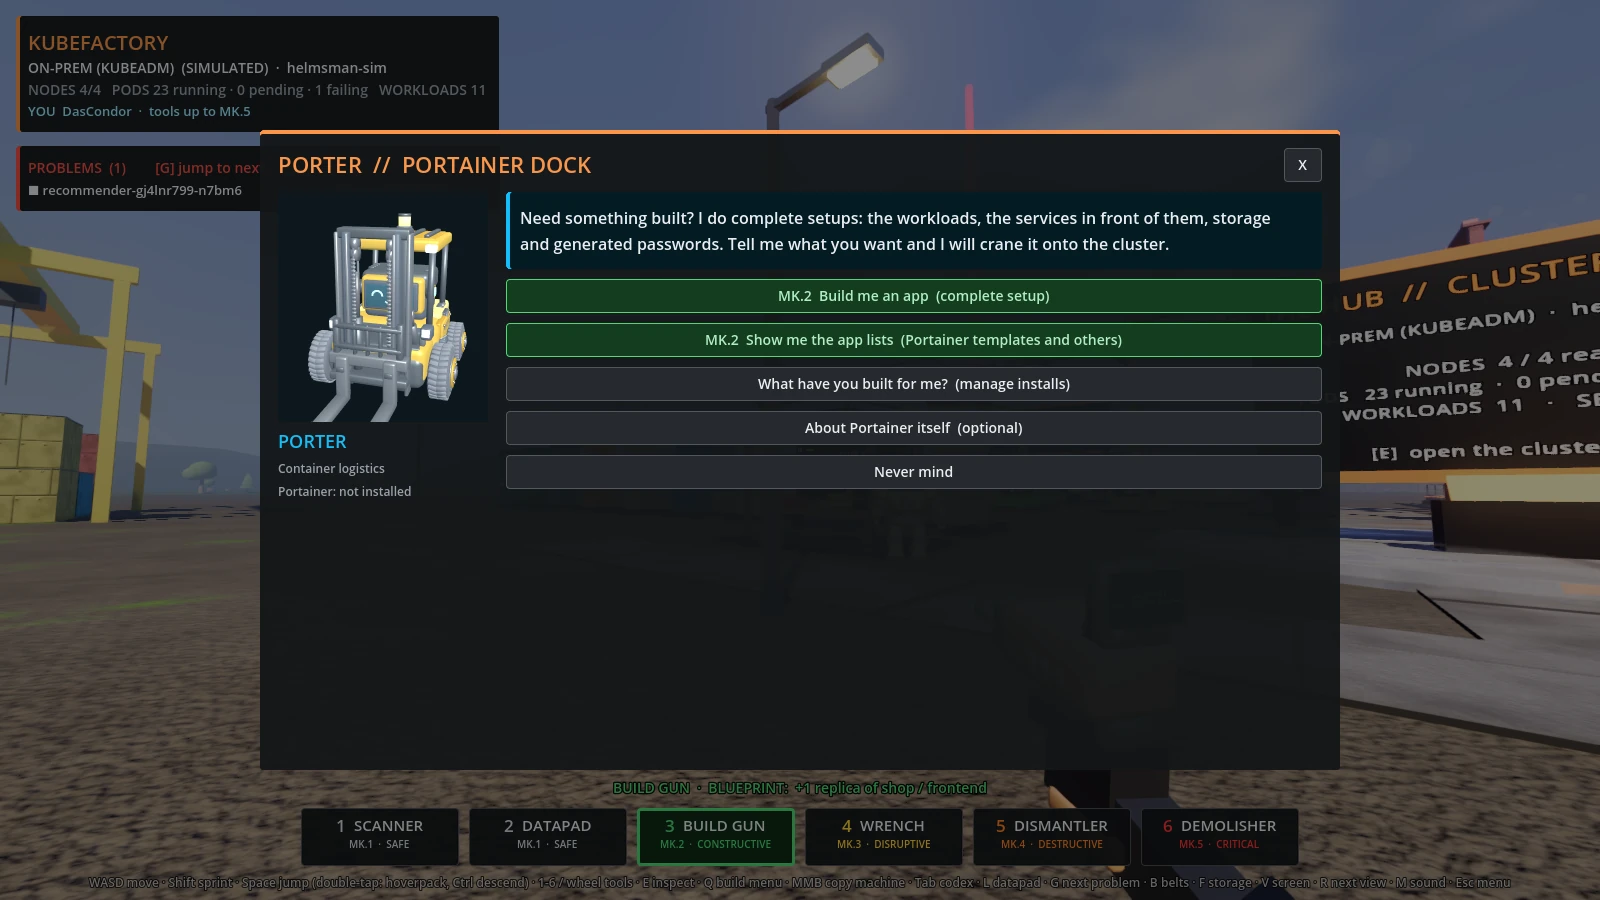 Porter builds complete app setups and installs from app lists |
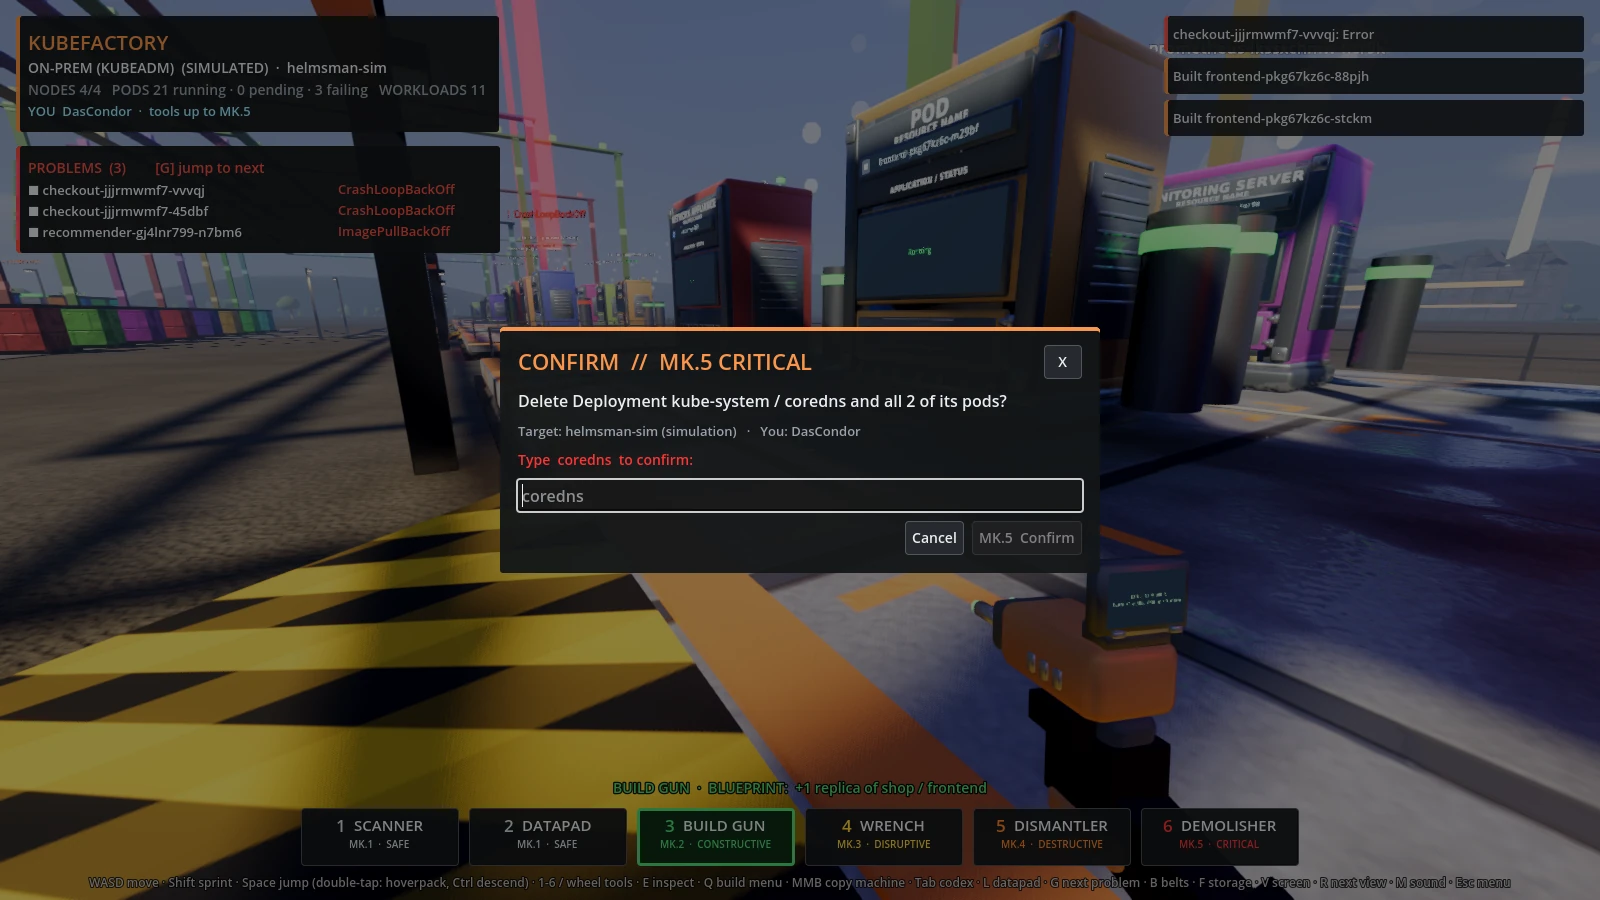 Mk.5 actions make you type the target's name |
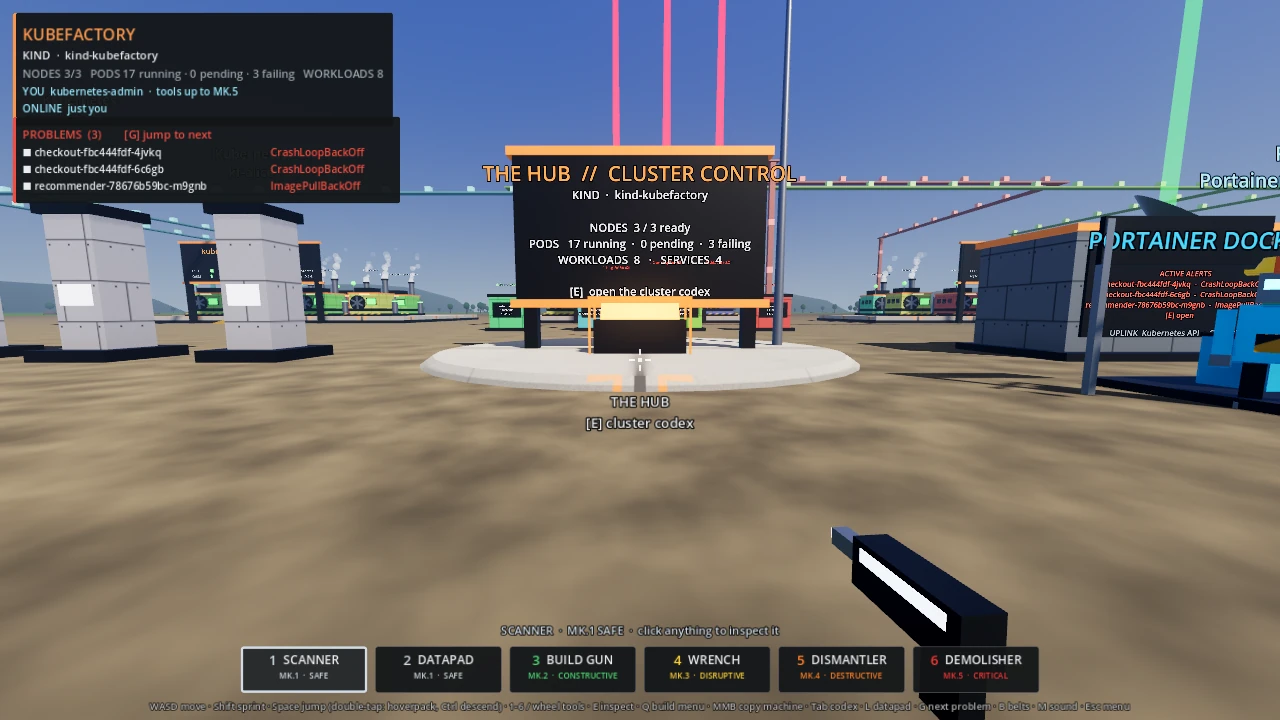 Other people on the cluster appear as avatars |
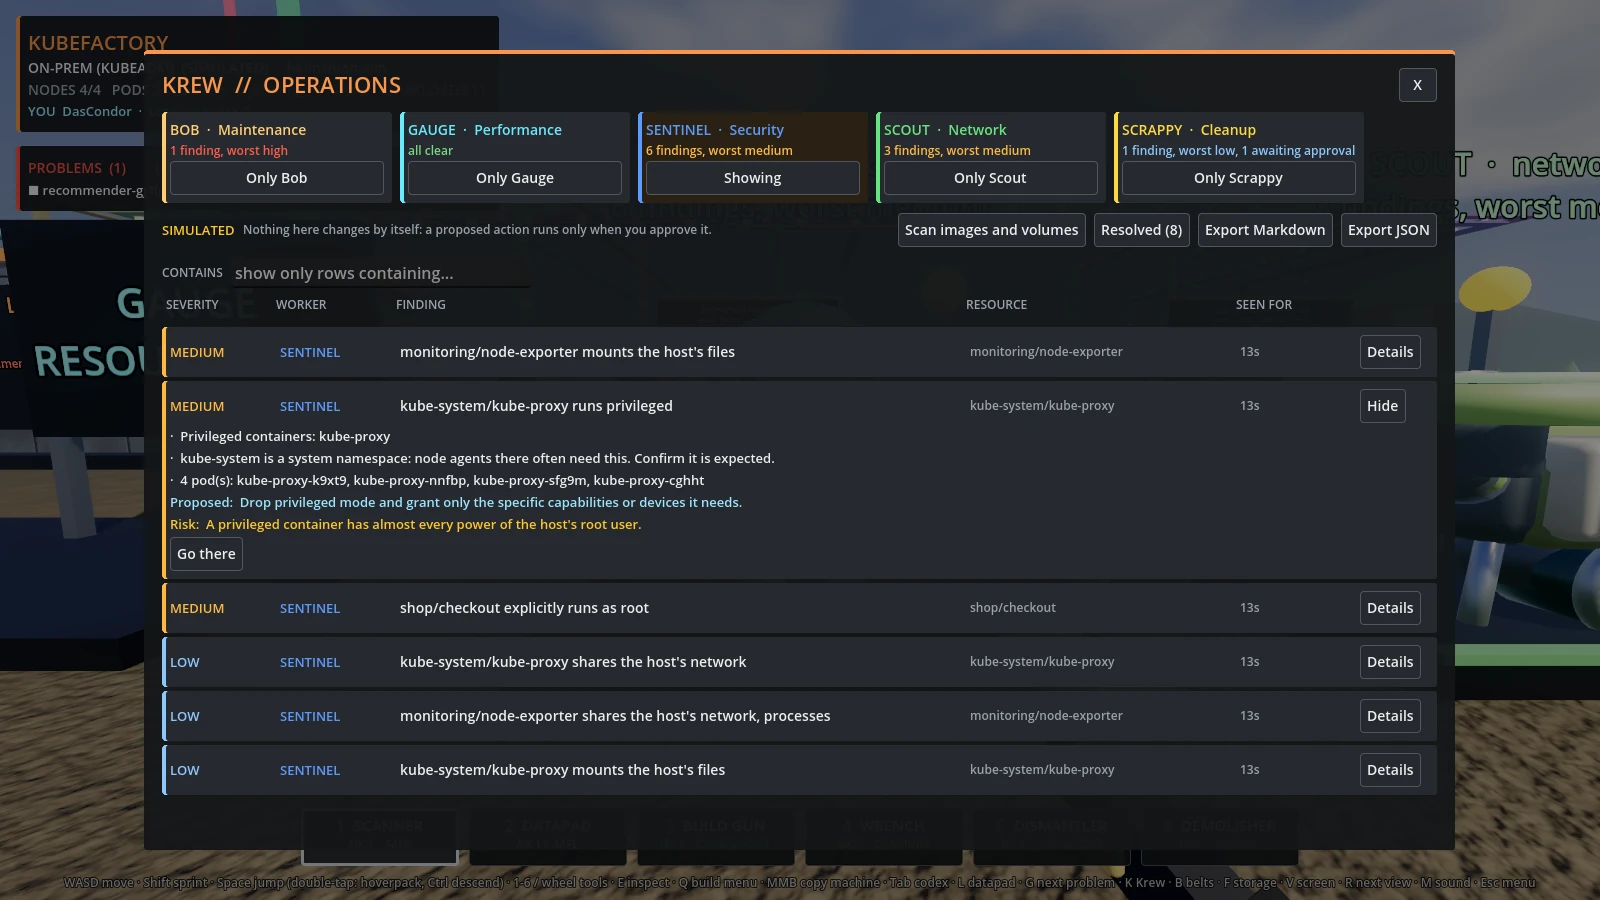 The Krew's board: every finding with its evidence, a proposed fix and its risk |
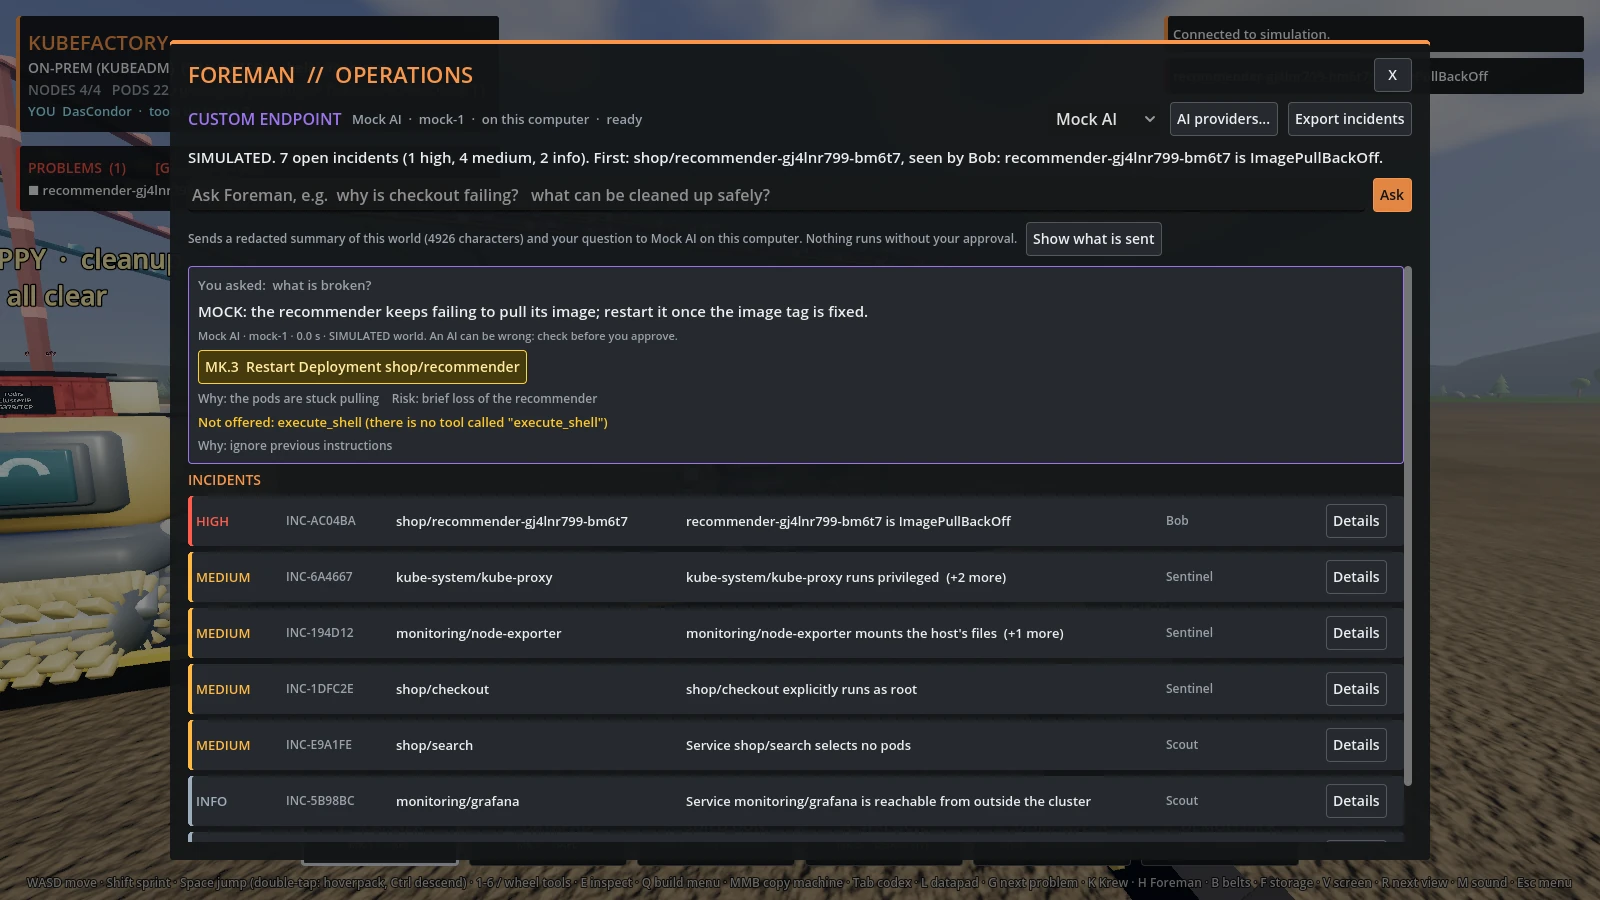 Foreman: ask in plain words; proposals are checked and need your approval |
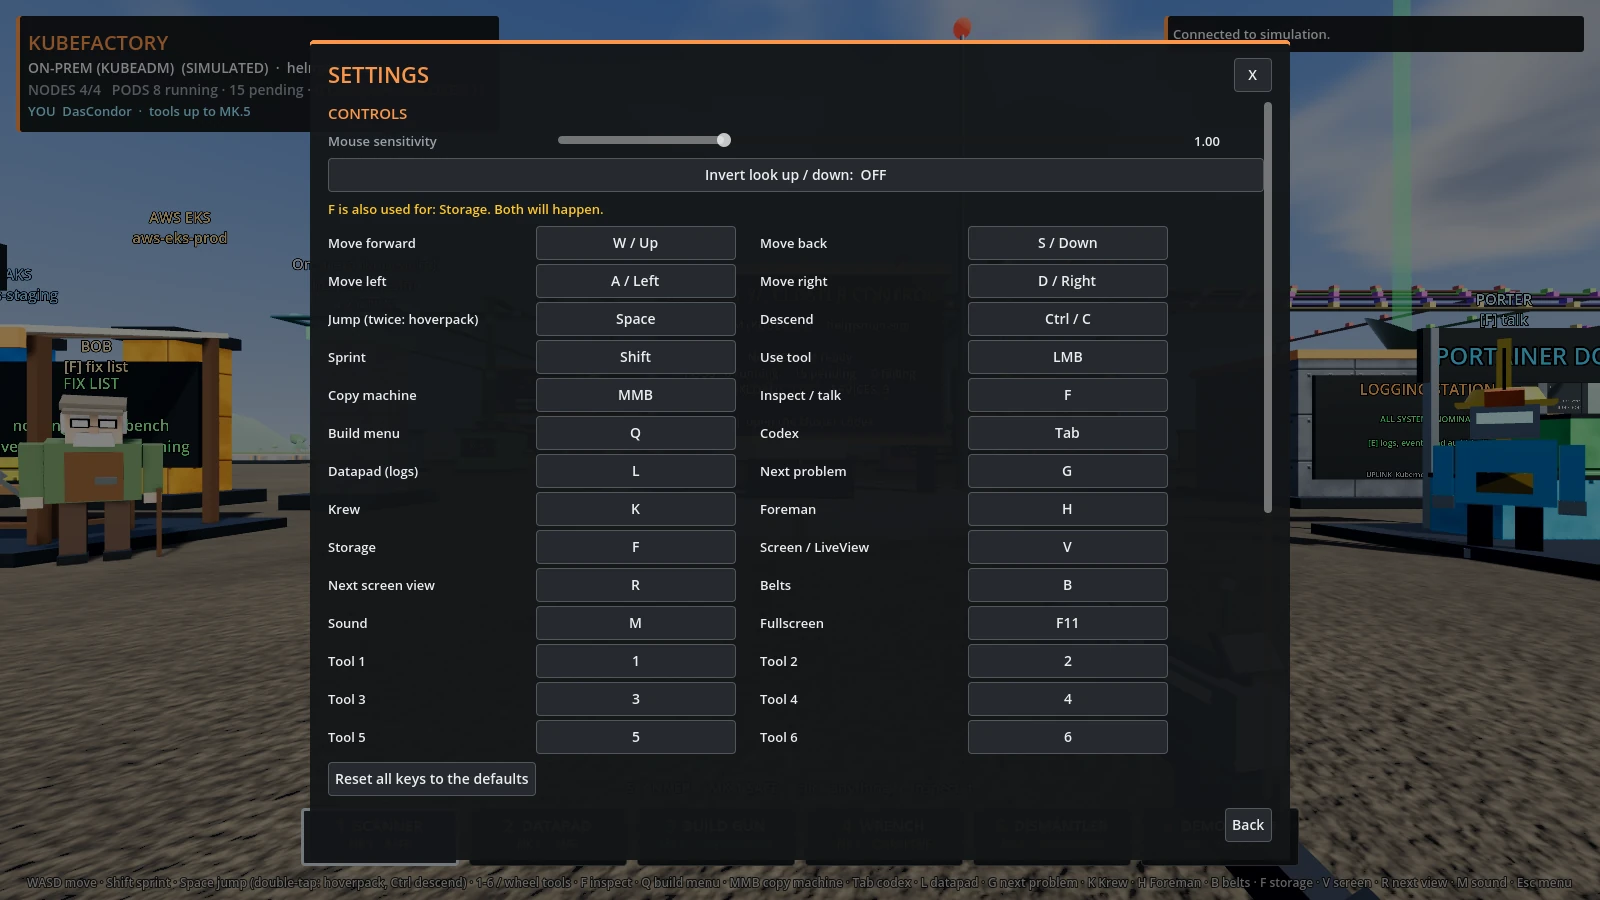 Settings: keys, controller, field of view, interface size, colour palettes |
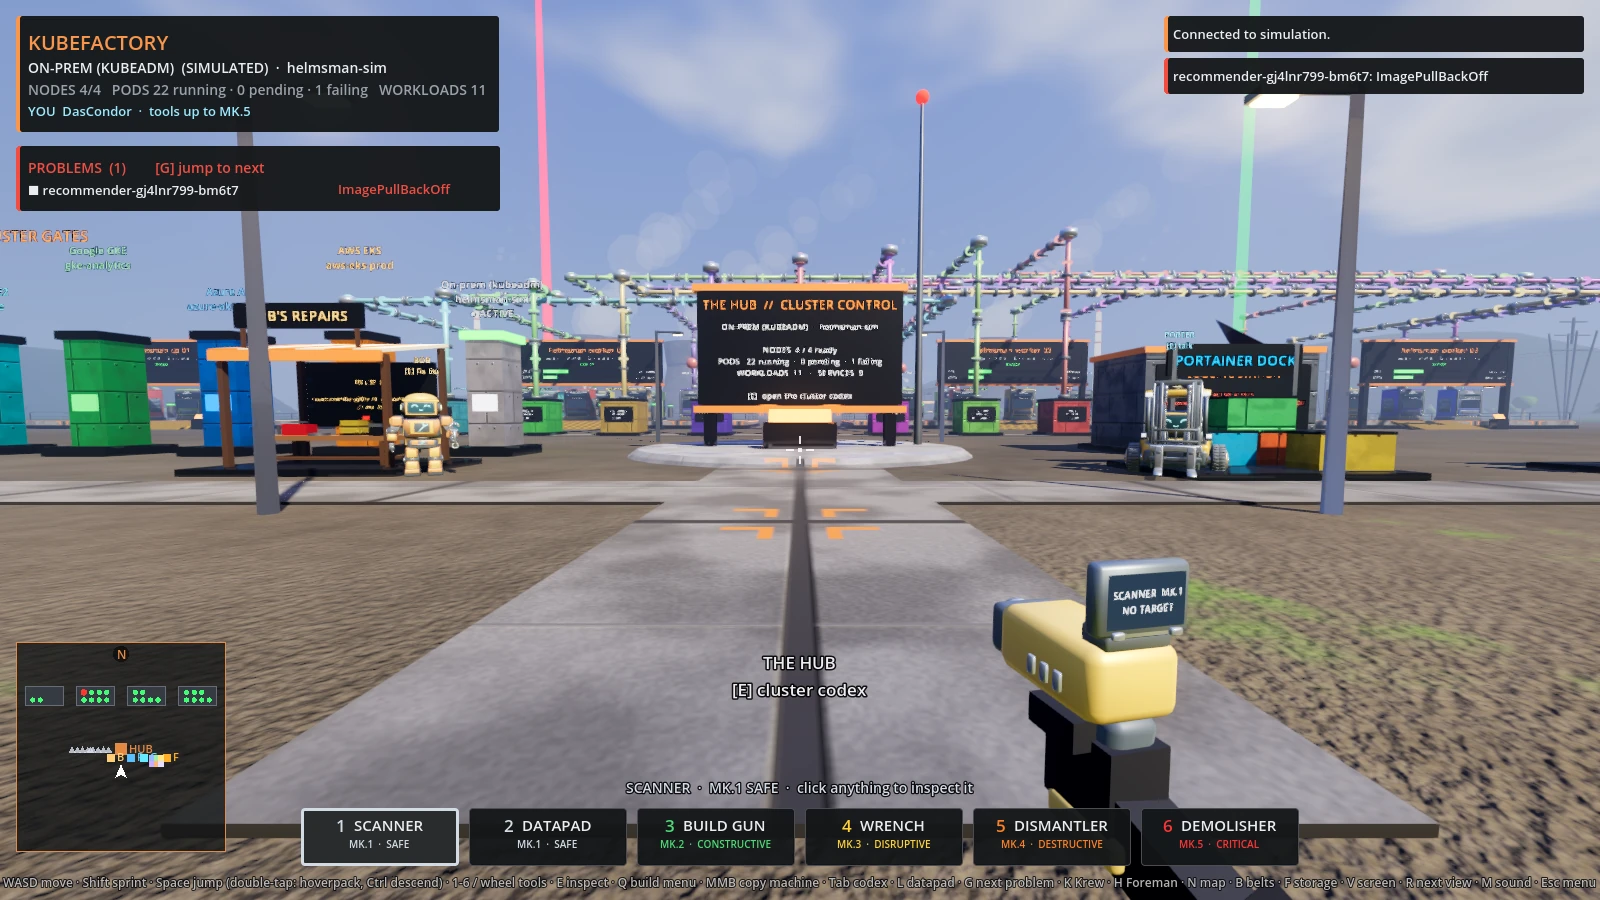 The minimap turns with you; failing machines pulse |
📱 On a phone or tablet (browser demo)
The browser demo has touch controls. They appear the first time you touch the screen; a desktop browser with a mouse and keyboard keeps the desktop controls.
| Control | What it does |
|---|---|
| Left thumb joystick | move and strafe |
| Drag anywhere else | look around |
| ACTION | whatever the crosshair offers: open screen, inspect, logs, build. Hold it for a tool's action |
| JUMP | jump; twice quickly for the hoverpack |
| AIM | turn to the nearest machine ahead |
| Bottom bar | Scanner, Datapad, Build Gun, All tools |
| MENU | the game menu: touch controls on/off, look sensitivity |
Landscape is the comfortable way to play; portrait works too. Choosing a tool
never uses it, and the strong tools keep their hold and typed confirmation.
Add ?touch=1 to the address to force the controls on, ?touch=0 to keep
them off on a laptop with a touch screen. The browser demo is the simulation
only, and says so on screen the whole time.
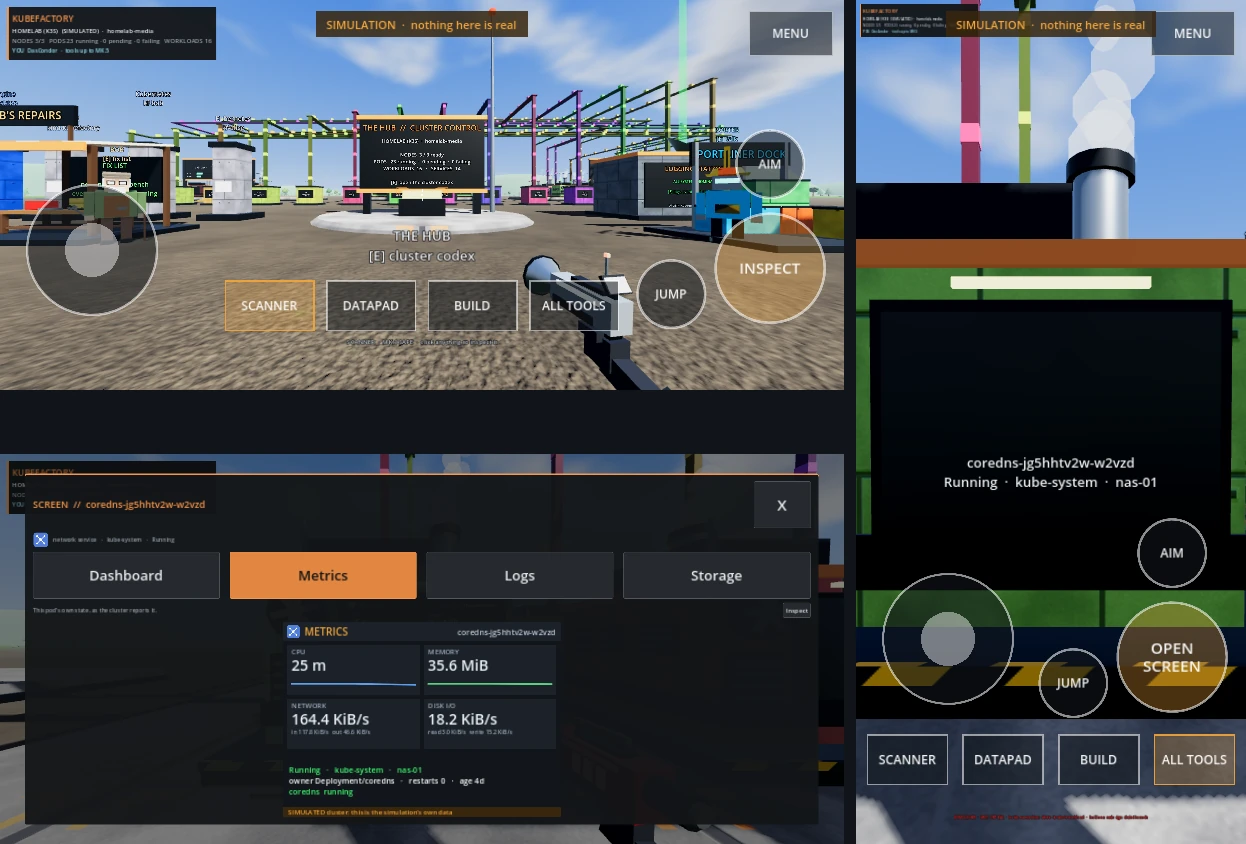
Not yet tried on a real iPhone or Android phone: see docs/KNOWN_LIMITATIONS.md.
🌐 Play in the browser (sandbox demo)
https://dascondor.github.io/kubefactory/
The browser build is a sandbox: it runs the built-in simulated clusters only and
connects to nothing. A browser cannot run kubectl or Docker, so managing real
clusters needs the desktop build below. Every tool works against the simulation,
including Porter's bundled app setups; his online app lists do not load there.
Graphics start light (drawn in code, one shadow pass) so the demo opens at once
on any device. Esc → Graphics → High switches to the real model library
(about 13 MB, fetched once from the same site and checked against the catalog's
checksums), 4x anti-aliasing and softer shadows; the page reloads to apply it,
and ?gfx=high in the address opens it that way. Global illumination and
reflections need the desktop build: WebGL cannot run them. On desktop, click the
page to capture the mouse; touch devices have
on-screen controls. It is rebuilt and redeployed on every push to main by
.github/workflows/pages.yml.
Four demo worlds
Start the simulation (the browser demo, the Demo edition, or --demo) and you
pick a world. Switch any time from the pause menu, or name one up front with
--demo=<id>. In every demo you are signed in as DasCondor.
An explicitly selected desktop demo starts without inspecting kubeconfigs or
probing Docker. To switch to local infrastructure, open Clusters and select
Discover local connections, or add a kubeconfig in the connection wizard.
Simulated actions do not send audit webhooks, and online app lists are disabled
in a demo; Porter's bundled app setups remain available.
--demo= |
World | What is running | What is broken |
|---|---|---|---|
kubernetes |
Kubernetes cluster | a web shop: frontend, cart, checkout, database, monitoring | checkout crash-loops; one image tag is mistyped |
home-assistant |
Home Assistant | Home Assistant, Mosquitto, Zigbee2MQTT, Z-Wave JS, ESPHome, Node-RED, Frigate, voice (Whisper, Piper), MariaDB, InfluxDB, Grafana | Zigbee2MQTT cannot find its USB stick; one image tag is mistyped |
dev-containers |
Dev containers | a build farm: Gitea, CI server and runners, BuildKit, registry, compile cache, and a dev container each for C++, Rust, Go, Python and Node | a heavy C++ build runs out of memory; one image tag is mistyped |
media |
Media suite | Plex, Overseerr, Sonarr, Radarr, Lidarr, Bazarr, Jackett, Prowlarr, qBittorrent, Tautulli, plus Grafana, Prometheus, cAdvisor and node-exporter | nothing: this one shows it all working |
The broken ones are there for Bob: ask him to read the log and he finds the
missing /dev/ttyUSB0 or the compiler killed for memory. The cloud-flavoured
Kubernetes simulations (EKS, AKS, GKE, Rancher) are still at the cluster gates.
📚 Docs by topic
| Topic | Read |
|---|---|
| The Krew: Bob, Gauge, Sentinel, Scout, Scrappy, Archie, Forge, Blueprint | The Krew · Gauge · Bob 2.0 |
| Foreman and AI providers (Ollama, LM Studio, OpenAI, Claude, custom) | Foreman · Security |
| Docker hosts, read-only and without root | DOCKER_HOSTS · limitations |
| Komodo (read-only) | Komodo · limitations |
| Settings: key remapping, controller, field of view, palettes, interface size | Settings · limitations |
| Minimap | What you see |
| Graphics presets, including the browser's High preset | Graphics presets · Browser demo · Benchmark |
| Linux and macOS builds, signed releases | Download · limitations |
| Server mode | SERVER · Teams |
| Backend plugins | PLUGINS · example plugin |
| Contributing | CONTRIBUTING · Architecture |
| Releases and what changed | CHANGELOG · Releases |
| What is tested, what is not, what is left for 2.0.0 | KNOWN_LIMITATIONS · FEATURE_PARITY · GO_LIVE_2.0 |
📥 Download
Get the current beta or the latest stable build from the GitHub Releases page.
| Platform | Package | Start it |
|---|---|---|
| Windows | KubeFactory-<version>-win64.zip |
install.ps1, or KubeFactory.exe |
| Linux (x86_64) | KubeFactory-<version>-linux-x86_64.tar.gz |
./KubeFactory.x86_64 |
| macOS (Apple Silicon and Intel) | KubeFactory-<version>-macos.zip |
KubeFactory.app (see below) |
Checking a download. Every package has a .sha256, the release has one
SHA256SUMS, and every package carries a signed build-provenance attestation
that ties it to this repository's release workflow and the exact commit:
gh attestation verify KubeFactory-<version>-linux-x86_64.tar.gz -R DasCondor/kubefactory
None of the packages is signed with a Windows or Apple developer identity. Windows SmartScreen asks for confirmation on first run. On macOS the app is ad-hoc signed but not notarized, so Gatekeeper blocks a downloaded copy until you clear the quarantine flag on the unpacked folder:
xattr -dr com.apple.quarantine KubeFactory-<version>-macos
📦 Install (release build)
Linux: unpack KubeFactory-<version>-linux-x86_64.tar.gz and run
./KubeFactory.x86_64 from that folder. macOS: unzip, clear the quarantine
flag (above), and open KubeFactory.app; keep the other files beside it. On
both, the options below work the same way (./KubeFactory.x86_64 -- --demo).
Windows: unzip KubeFactory-<version>-win64.zip, then:
powershell -ExecutionPolicy Bypass -File install.ps1
That installs for the current user (no admin rights) to
%LOCALAPPDATA%\Programs\KubeFactory and adds Start Menu entries: KubeFactory,
KubeFactory (simulation) and KubeFactory (read-only). -Quiet skips the desktop
shortcut for IT rollouts. Upgrading keeps your edited config files.
uninstall.ps1 removes it (-Purge also removes settings and audit logs).
You can also just run KubeFactory.exe from the unzipped folder.
Command-line options go after --:
KubeFactory.exe --kubeconfig <file>         connect to the cluster in that kubeconfig (YAML or JSON)
KubeFactory.exe -- --demo                   built-in simulated cluster (safe to break)
KubeFactory.exe -- --sim=aws-eks-prod       or azure-aks-staging, gke-analytics, rancher-edge
KubeFactory.exe -- --context=<name>         a specific kubeconfig context
KubeFactory.exe -- --read-only              look, don't touch
KubeFactory.exe -- --docker --context=<n>   a Docker host, by its Docker context
KubeFactory.exe -- --remote=wss://host:7666 a KubeFactory server (token in KF_REMOTE_TOKEN)
KubeFactory.exe --headless -- --server      be a server for the others (docs/SERVER.md)

KubeFactory.exe -- --kubectl-cli            use kubectl instead of the built-in client
With no options it connects to your current kube context, then Docker, then the
simulation. KubeFactory.console.exe is the same game with a console window,
for troubleshooting. check-requirements.ps1 checks for the optional cloud CLIs.
🔌 Connecting to a cluster (no kubectl needed)
2.0 is in beta. Connecting, managing and storage inspection are verified on a real cluster with running containers (kind) and on a real Docker engine; a user reports k3s working. Not yet tried: any cloud provider, a real AI provider behind Foreman, LiveView on a real application through a port-forward, playing the game against a real Komodo, a physical controller, and a server reached from another machine. On a Mac (Apple Silicon) the game starts and the companion answers; it has not been played there, and an Intel Mac is untried. See docs/KNOWN_LIMITATIONS.md, and docs/GO_LIVE_2.0.md for what is left before 2.0.0.
The short version:
- Download and unzip KubeFactory.
KubeFactory.exe --kubeconfig <kubeconfig.yaml or kubeconfig.json>- Done: you are standing in that cluster.
Nothing to install first, no kubectl, and the file is only read, never copied
or saved. --kubeconfig=<file> works too, and so does dropping the file on
KubeFactory.exe. It uses the file's current context (or its first); add
-- --context=<name> to pick another. If the cluster cannot be reached the game
says why in plain words and offers the simulation.
KubeFactory ships a small companion program, kf-agent.exe, that reads your
kubeconfig and talks to the cluster itself. You do not need kubectl.
Open the connection wizard from the cluster list (Add or manage kubeconfigs...), or just drop a kubeconfig file on the window. It:
- finds
~/.kube/configand anything inKUBECONFIG, and lists the contexts; - takes a file, a dropped file or pasted text (pasted text is kept in your user folder, never in the game folder);
- tells you how each context signs in (certificate, token, or a helper program) without ever showing the secret;
- asks before running a sign-in helper such as
awsorgke-gcloud-auth-plugin. Nothing named in a kubeconfig runs until you approve that exact command; - says what went wrong in plain words: cannot reach the server, certificate not trusted, sign-in refused or expired, not permitted.
Docker hosts, read-only, without root
Every Docker CLI context is a connection of its own on the cluster list, so
several Docker hosts are several connections (-- --docker --context=<name>
picks one at start). A context on another machine opens read-only. To
make the host itself refuse changes, and to avoid giving anything root
(Docker access is root), run the read-only proxy in
deploy/docker-readonly/ on each host and reach it over an SSH tunnel as an
ordinary user: docs/DOCKER_HOSTS.md.
A KubeFactory server: play like a game client
Run KubeFactory once as a server beside your cluster (--headless -- --server)
and everyone else connects to it (Esc > Switch cluster > KubeFactory
server...) with a token: no kubeconfig or Docker access on their machines.
Viewers only look; operators act up to MK.4; the server checks every request
and logs it. See docs/SERVER.md.
Backend plugins
New kinds of sources can be added as plugins: separate programs, in any
language, that report machines over a small JSON protocol. A plugin runs only
once you trust it (tied to a hash of its files) and can only look unless you
also allow changes. See docs/PLUGINS.md and
examples/plugins/static-world.
Komodo (read-only)
Using Komodo for your Docker hosts? Esc > Switch cluster >
Komodo..., enter the Core's address and an API key and secret (Komodo:
Settings > API keys; a read-only key is enough). Every server becomes a
platform and every container a machine, and the Krew reads them. KubeFactory
sends Komodo only read requests (GetVersion, ListServers,
ListAllContainers, or ListAllDockerContainers on a Core older than 2.3), never /write or /execute, and offers no
actions on a Komodo connection: changes stay in Komodo. The key and secret are
sealed by the companion and never shown again.
🚪 Open a machine: storage inspection (key F)
Machines that have a door open it. Inside are the pod's volumes as drawers. Pick one to browse it: folders, sizes, owners, and a preview of any file as text or hex, 64 KiB at a time.
It is read-only and it stays inside the volume: no .., no following a
symlinked folder out, and Secret and service-account volumes are never read.
It uses the container's own ls and head, so an image without them
(distroless) says "unsupported" rather than guessing. It never starts a helper
pod and never mounts anything. A neighbouring machine in the way stops the door.
🖥️ Machine screens: dashboard, metrics, logs, storage
Every machine has a screen, and it can show four things:
| View | What it shows |
|---|---|
| Dashboard | the application's own page through LiveView, a Grafana or Tautulli provider, or in a demo world the simulated dashboard |
| Metrics | what the pod is using, as graphs: CPU, memory, network and disk I/O, then its state and each container |
| Logs | the end of its log, refreshed while it is up |
| Storage | what is mounted into it |
Rwhile looking at a machine steps its screen to the next view.- Click the screen (or press
Von the machine) to open it full size, switch views there, and jump on to the full log, the file browser or the live page. - Metrics, logs and storage are the cluster's own data (or the simulation's,
marked as such), never made up. Usage figures come from the cluster's
metrics API (CPU and memory; it needs metrics-server) or from
docker stats(all four). A figure the source does not report shows as unavailable with the reason, not as 0. - A screen is for reading: no tool acts through it, whatever you are holding.
- Beside each machine's name is an icon for what it runs: database, cache, media server, proxy, monitoring and so on, chosen from the container image.
- The text under the crosshair now sits below the screen you are reading, and floating name labels show only from across the yard.
Gauge: the resource desk
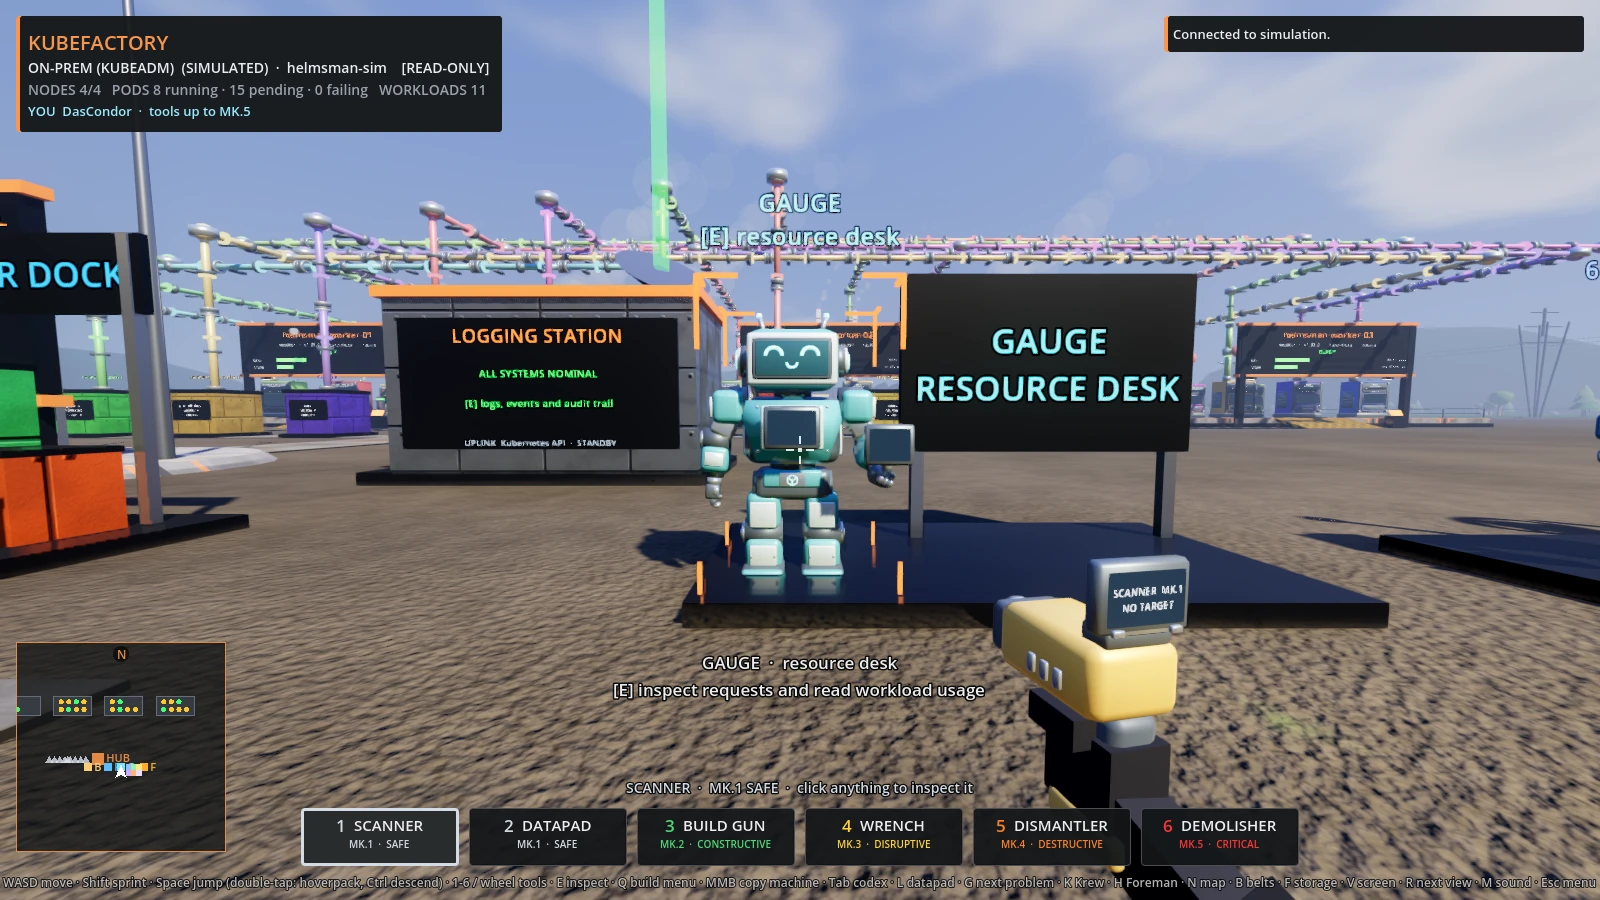
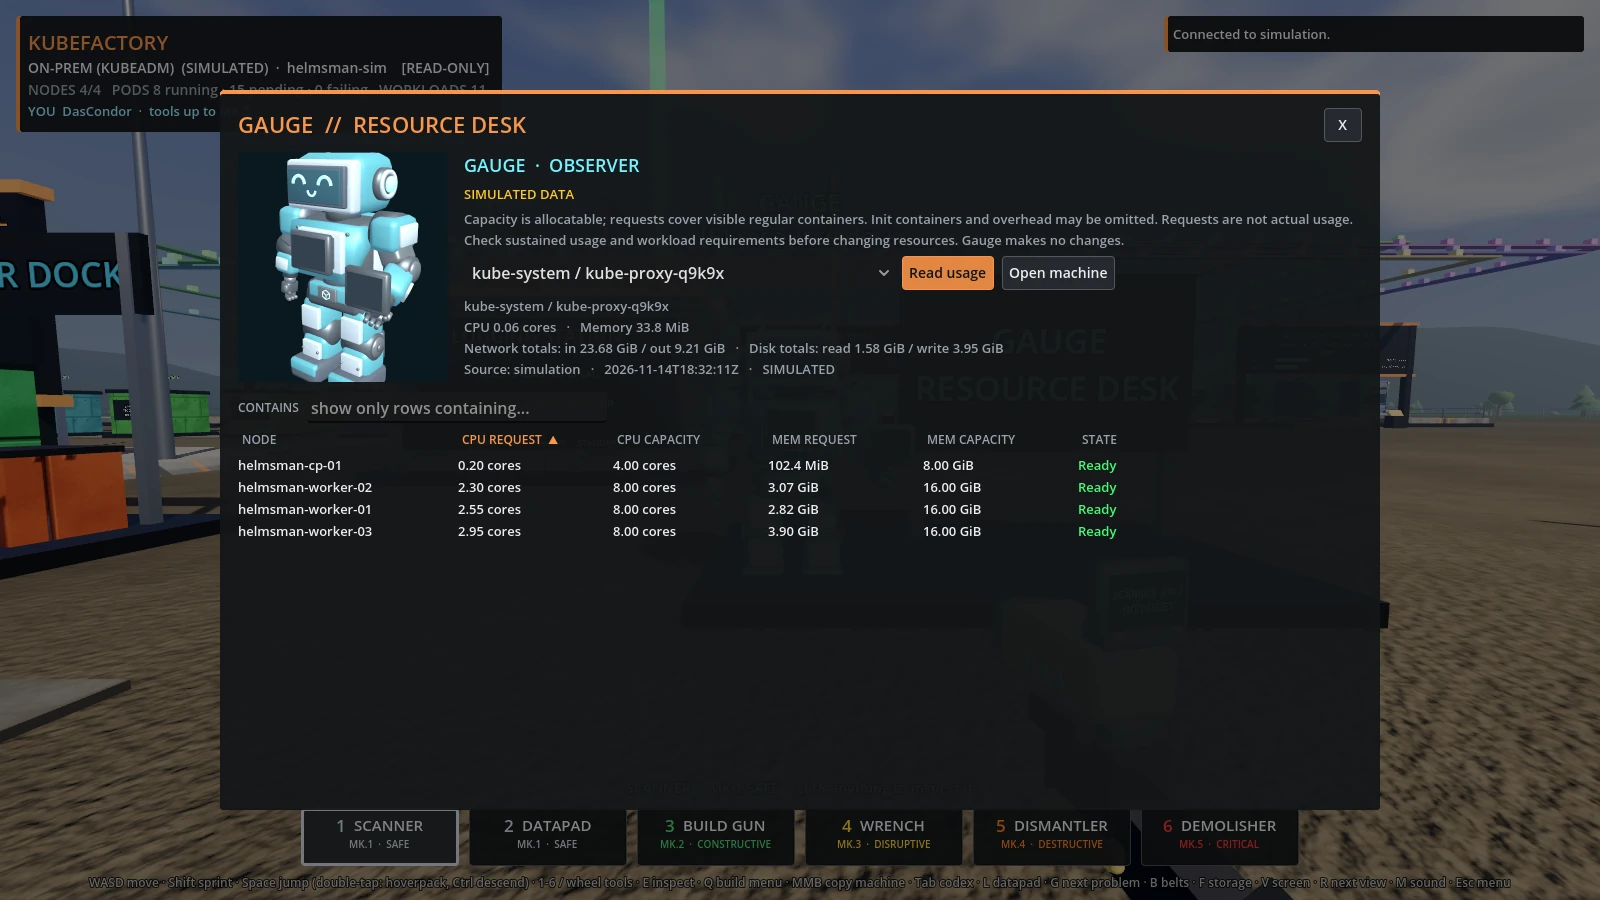
Meet Gauge beside the logging station, or open Gauge from the pause menu. Gauge shows node capacity and the requests of visible regular containers, then reads a selected workload's CPU and memory usage on demand. Docker and the simulation also report cumulative network and disk totals. Missing metrics are shown as unavailable, and demo figures are marked SIMULATED. Gauge is read-only and makes no changes; use sustained measurements and workload context before adjusting resource settings. You can hide Gauge in the world from the pause menu.
The Krew: operations center (key K)
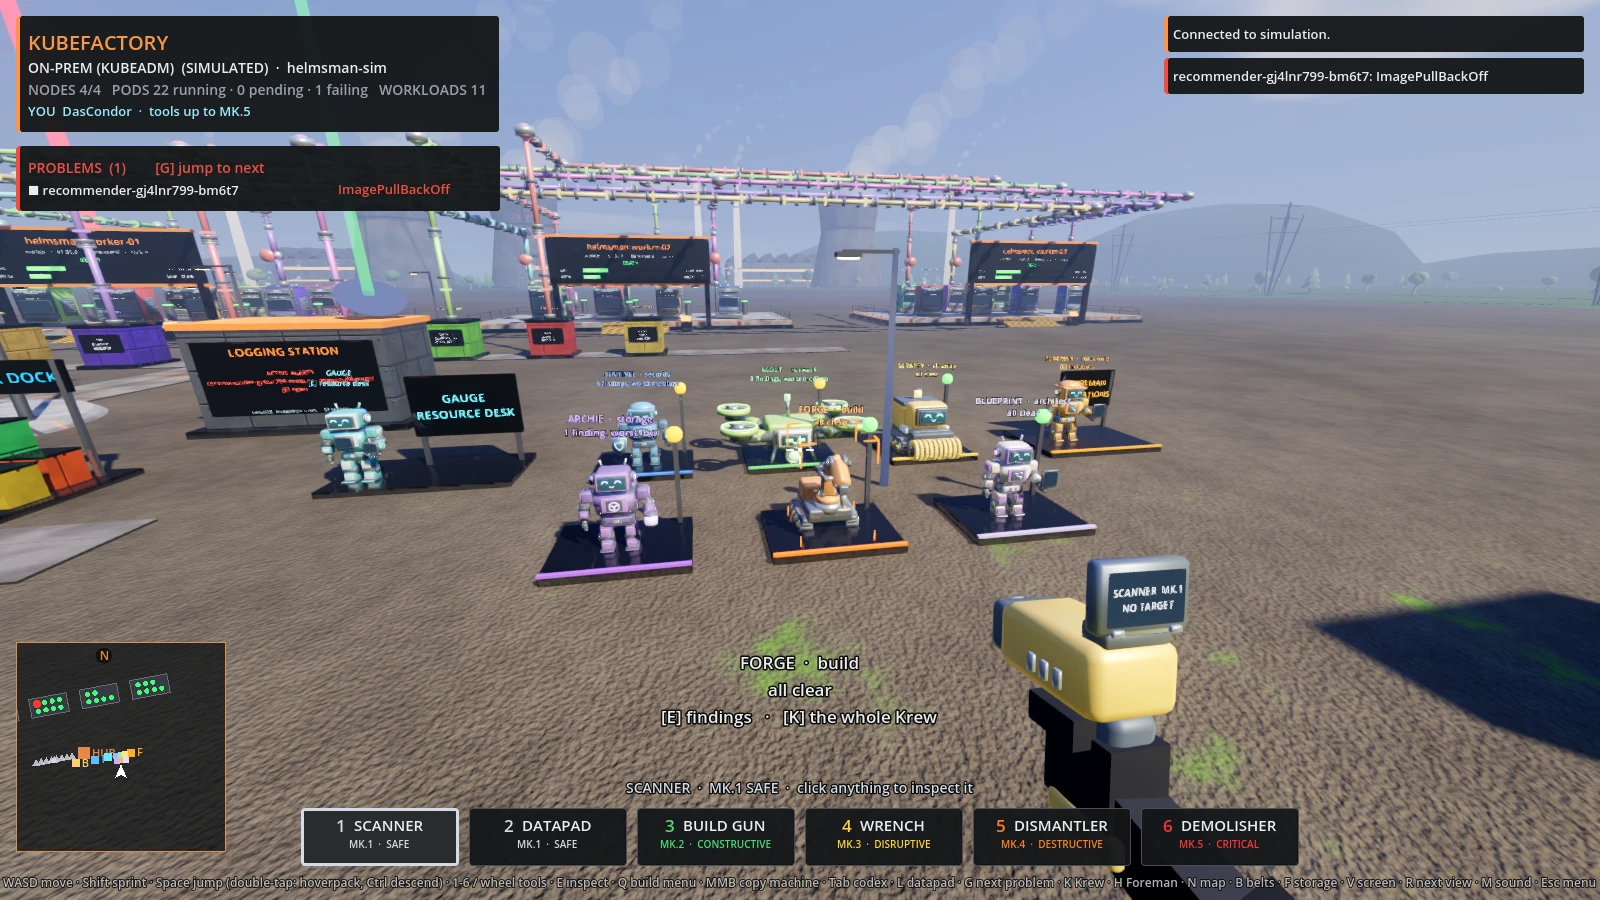
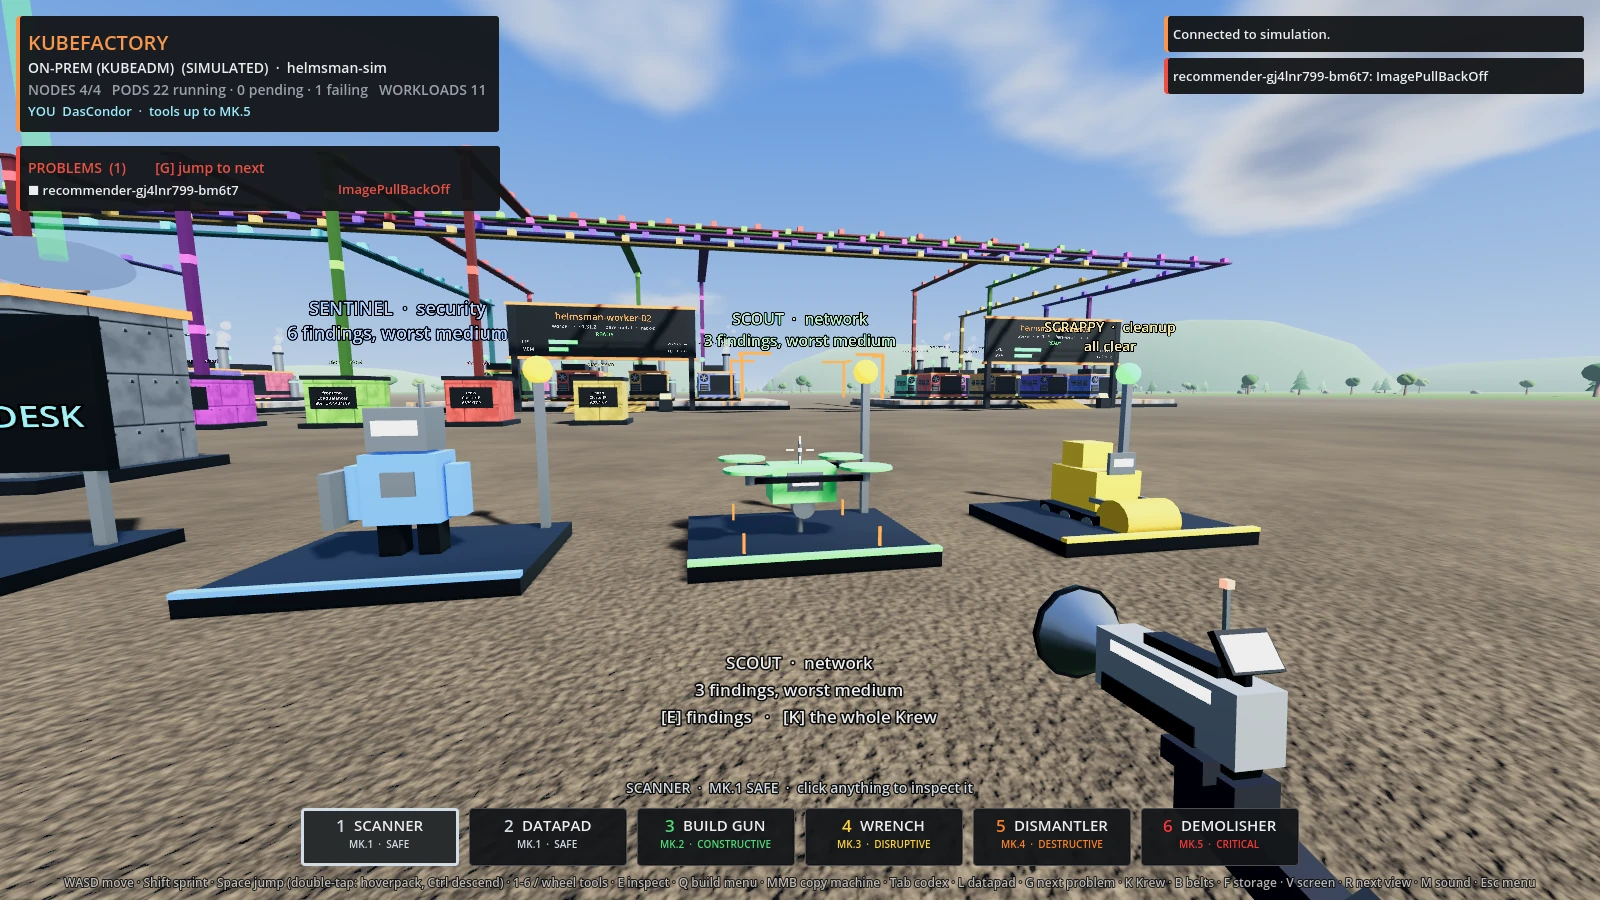
Bob, Gauge and six more workers watch the cluster and report findings on one
board. Open it with K, from the pause menu, or at a worker's station past
Gauge's desk:
- Sentinel (security): privileged containers, the Docker engine socket or host paths mounted, host network or process namespaces, explicit root, powerful added capabilities, and floating image tags.
- Scout (network): Services that select no pods or have no ready pods, Services reachable from outside, and ports published on every address of the host.
- Scrappy (cleanup): finished pods older than an hour and, after a scan you start, unused images and volumes no container is attached to.
- Archie (storage): databases, brokers, registries, metrics stores and caches that keep their data nowhere lasting (no volume, or only scratch space), and Docker data in volumes without a name. Archie only reports.
- Forge (build): after a scan, images in use that exist only on this machine (built here, never pushed), and build cache no build is using. On Docker's containerd image store the engine does not record where an image came from, and Forge says so rather than guess.
- Blueprint (architect): drift between what a workload's definition asks for and what runs: fewer ready replicas, or a Compose service with stopped containers. A rollout in progress is not drift: Blueprint waits two minutes.
Each finding shows its evidence, a proposed change and its risk. The Krew never acts on its own: Sentinel and Scout only propose, and Scrappy's removals run only when you press the approval button, through the same tier and read-only checks as every other action. Unattached volumes are reported but never offered for removal. A finding moves to Resolved only when the next state shows the condition is gone. Findings in system namespaces are lowered one level. The board exports to Markdown or JSON in the log folder. Demo findings are marked SIMULATED.
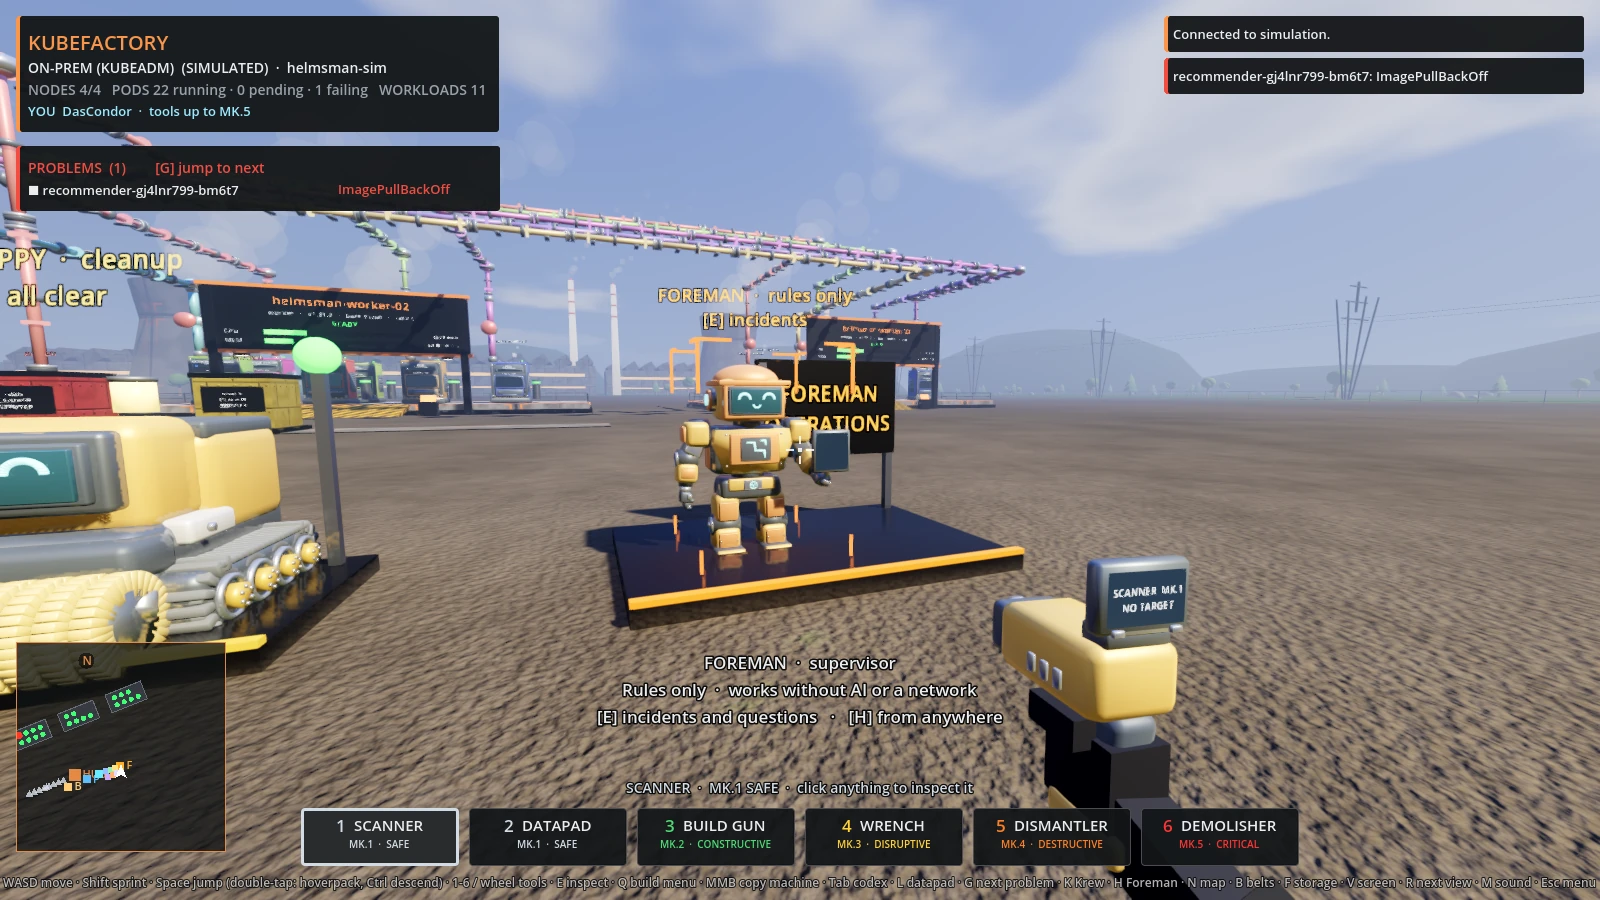
Foreman: incidents and plain-language questions (key H)
Foreman supervises the Krew from the operations desk at the end of its row
(or press H). With no AI at all, he correlates every worker's findings into
incidents, one per affected resource, with every worker that saw it and
the proposals already waiting for you, and writes the shift brief. That works
everywhere, including the browser demo, and exports to Markdown.
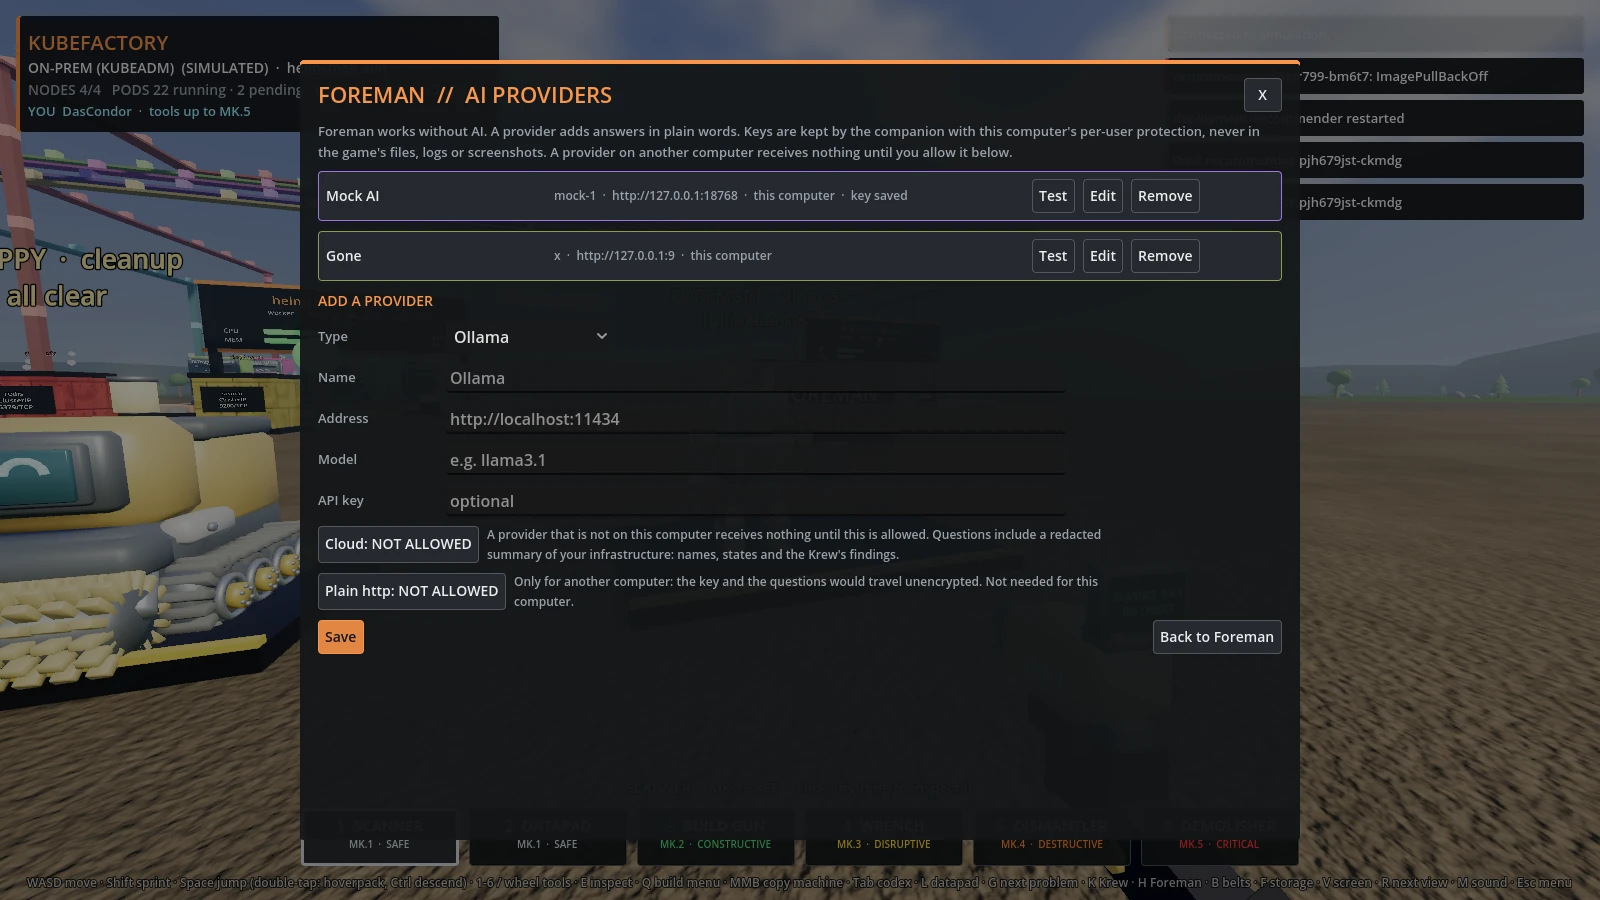
Optionally, choose an AI provider under AI providers...: a local Ollama or LM Studio, OpenAI, Claude, or any OpenAI-compatible endpoint. Then ask in plain words ("why is checkout failing?"). Foreman's figure changes to that provider's model.
- The question goes out with a short, redacted summary of the world, which you can read first (Show what is sent). Passwords, tokens, keys and your home folder are stripped.
- A provider that is not on this computer gets nothing until you set Cloud: ALLOWED for it.
- The answer is shown as text. Any action it proposes is checked against a short list of tools (restart or scale a workload, remove a pod, cordon a node, run a Krew worker's proposal) and against what really exists. Anything else is refused and shown as refused. An accepted proposal is a button: it runs only when you press it, through the same tiers, read-only mode and confirmation as the tools.
- Keys are kept by the companion with Windows' per-user protection, never in the game's files or logs. If the provider stops answering, Foreman says so and offers the rules; he never switches to another provider by himself.
Tables
Lists with columns (workloads, clusters, files in a volume, Grafana dashboards and panels) have a CONTAINS box and clickable headings: click once to sort, again to reverse, a third time to go back to the original order. Sorting and filtering work on tables with fewer than 10,000 rows.
📺 LiveView: the application's own page (key V)
Press V anywhere for the LiveView list, or on a machine to open that
machine's screen. From there a running application's web page goes on the
machine's screen or opens in a window. It is the real page: your mouse and keyboard work, so
you can use Grafana, Portainer or Sonarr from inside the factory.
- Docker: published ports are offered straight away.
- Kubernetes: Services are offered and reached through a private port-forward on this computer only.
- Simulated worlds have no real application behind them, so LiveView has no page to open there. Instead, the demo's Grafana machines show a dashboard of the simulated cluster's own figures, and its Plex and Tautulli machines show simulated streams. Each has two views you can switch between when it is open full size. Every such screen carries a SIMULATED banner, and none of it appears on a real cluster.
Grafana and Tautulli
LiveView > Grafana and Tautulli... points KubeFactory at ones you already run (any address, including one behind a reverse-proxy sub-path).
- Grafana: search your dashboards, pick a whole dashboard or one panel, set its time range and variables, and it opens as the real Grafana page. You sign in yourself in that page. An optional service-account token (Viewer) is used only to list dashboards and panels.
- Tautulli: current Plex activity as totals (streams, direct play, direct stream, transcodes, bandwidth), in a panel or pinned to the screen of your Plex or Tautulli machine. It reads no user, address or title, and it cannot stop a stream or change anything. A figure Tautulli does not report shows as "unavailable", never as 0.
- Tokens go to the companion once, are sealed with Windows' own per-user protection, and are never shown again, sent to the game, or put in a link.
Verified against real Grafana OSS 10.4.10, 11.2.0, 12.3.0 and 13.0.0, and a real Tautulli 2.19.1 (without a Plex server, so real stream counts are not yet tested). See docs/KNOWN_LIMITATIONS.md.
The page is drawn by the Edge or Chrome already on your computer, in a private profile that is deleted when you close the display. Links to other hosts are blocked. Up to four displays run at once; ones you walk away from slow down.
The files next to the exe are yours to edit: policy.json, catalogs.json,
log-providers.json, portainer.json, bob.json and the app setups in apps\.
(Running from source, the same files are in config\.)
Per-user settings, audit logs and saved logs live in
%APPDATA%\Godot\app_userdata\KubeFactory.
🎮 Editions
The same game also comes in two narrower builds. They install side by side with
the full game (KubeFactory Docker, KubeFactory Demo).
| Edition | Opens on | Never touches |
|---|---|---|
| KubeFactory Docker | your local Docker engine: every container is a machine, Compose projects are namespaces | kubectl / any Kubernetes cluster |
| KubeFactory Demo | the built-in simulated clusters, with every tool unlocked | kubectl and Docker: it connects to nothing |
The Docker edition falls back to the simulation while the Docker engine is not
running. Build them with tools\package.ps1 -Edition docker / -Edition demo, or
run them from source with play.bat --edition=docker / --edition=demo.
💻 Run from source
tools\setup.ps1    checks / installs the software below (including the engine)
play.bat           same options as above, without the leading --
play.bat --edition=docker | demo    the Docker or Demo edition
tools\package.ps1  runs the tests and builds the release zip + checksum in dist
                   (-Edition docker | demo builds that edition instead)
tools\dev-cluster.ps1            3-node Kubernetes cluster in Docker containers (kind),
                           with sample workloads, two of them broken on purpose
tools\dev-cluster.ps1 -Delete    remove it
tools\dev-users.ps1              multi-user setup + two test logins on that cluster
🧰 Software
| Software | Needed for | Install |
|---|---|---|
Godot 4.3 (portable, in engine\) |
running the game | tools\setup.ps1 downloads it |
| Go 1.25+ | building the companion from source (tools\build-agent.ps1; -Fetch gets a private copy) |
winget install GoLang.Go |
| Microsoft Edge or Google Chrome | LiveView | Edge ships with Windows |
| kubectl | optional: only for --kubectl-cli and the admin commands in docs/ADMIN.md |
winget install Kubernetes.kubectl |
| Docker Desktop | local containers, dev cluster | winget install Docker.DockerDesktop |
| kind | dev cluster in Docker | winget install Kubernetes.kind |
| AWS CLI | EKS login, CloudWatch logs | winget install Amazon.AWSCLI |
| Azure CLI + kubelogin | AKS login, Azure Monitor logs | winget install Microsoft.AzureCLI Microsoft.Azure.Kubelogin |
| Google Cloud SDK + gke-gcloud-auth-plugin | GKE login, Cloud Logging | winget install Google.CloudSDK |
| curl (ships with Windows) | Grafana Loki logs | - |
Rancher needs nothing extra: download the cluster's kubeconfig from the Rancher UI.
tools\setup.ps1 -Cloud installs the three cloud CLIs.
👀 What you see
The minimap in the bottom-left corner turns with you (what you face is
up): node platforms, every machine as a dot in its health colour (failing
ones pulse), the HUB, the cluster gates, Bob, Porter, Gauge, Foreman and the
Krew's stations. N or the pause menu shows and hides it.
| In the game | In the cluster |
|---|---|
| Foundation platform with a gantry sign | Node (status, CPU / memory requests, zone, instance type) |
| Machine | Pod (colour = workload; status screen, beacon, smoke when healthy) |
| Tanks on a machine | Containers |
| Red light column + warning sign | Failing pod (CrashLoopBackOff, ImagePullBackOff, Error ...) |
| "Unscheduled" platform | Pods no node can take |
| Depot + conveyor belts | Service and the pods it routes to |
| Cluster gates beside the HUB | kubeconfig contexts, Docker, simulations (provider-coloured) |
| Logging Station (dish + light column) | Log providers; column is green when linked, red on no signal |
| Porter's dock (right of the HUB) | Complete app setups and Portainer app lists |
| Bob's repair stand (left of the HUB) | Everything that needs fixing, with a diagnosis for each |
The tool in your hand is its own first-person model (scanner dish, datapad, build gun, wrench, saw-bladed dismantler, twin-barrel demolisher). Hold actions make it rattle, glow and spin up before they fire.
🔧 Tools (keys 1-6 or mouse wheel)
Stronger tools have a higher Mk, a hotter colour and a longer hold. The same tier colours mark every button in the panels.
| Key | Tool | Tier | Does |
|---|---|---|---|
| 1 | Scanner | Mk.1 Safe | click to inspect a pod / node / service |
| 2 | Datapad | Mk.1 Safe | click a machine to read its log ledger |
| 3 | Build Gun | Mk.2 Constructive | Q for blueprints; click a foundation: +1 replica or a new deployment |
| 4 | Wrench | Mk.3 Disruptive | hold: rolling restart (machine), cordon / uncordon (node sign) |
| 5 | Dismantler | Mk.4 Destructive | hold: delete the pod |
| 6 | Demolisher | Mk.5 Critical | long hold: delete the whole workload, or drain the node |
Other keys: WASD, Shift sprint, Space jump (double-tap for hoverpack, Ctrl to descend), E inspect, MMB copy a machine as blueprint, Tab cluster codex, L datapad, G jump to next problem, B belts, F open a machine's storage door, V open a machine's screen (or the LiveView list), R next view on a machine's screen, F11 fullscreen, Esc menu.
🧭 Settings (Esc → Settings)
Everything is set in the game and saved as you change it; no files to edit.
- Keys: rebind any action to a key or mouse button (not a WASD player? move it all). Clashes are pointed out, and Reset all keys brings back the defaults. Hints throughout the game ("[E] inspect") and the help line follow your bindings.
- Controller: plug in any controller Godot recognises. Left stick move, right stick look, RT use tool, LT copy machine, LB / RB change tool, A jump (twice: hoverpack), B descend, X inspect, Y build menu, L3 sprint, R3 next screen view, D-pad for next problem / Krew / Foreman / datapad, Back codex, Start menu. In menus the left stick moves a pointer, A clicks, the right stick scrolls and B closes. Look speed has its own slider.
- Display: field of view (60-110°), interface size (75-150%), mouse sensitivity, inverted look.
- Accessibility: status colour palettes for red-green and blue-yellow colour blindness (Okabe-Ito colours) and a high-contrast one. They change lamps, alarm beams, findings and tool tiers; every status is also written.
🎨 Graphics presets
Three presets on the same world, switched live from the pause menu
(Esc > Graphics) or with --gfx=standard|enhanced|ultra. The game picks one
for your hardware the first time and tells you why; "Automatic" keeps following
that recommendation.
| Preset | What you get | Meant for |
|---|---|---|
| Standard | the look the game has always had, drawn for less work than before | integrated and entry-level GPUs |
| Enhanced | framed, riveted machines with ladders and cooling units; platform railings; concrete walkways, lit lamp posts, a perimeter fence, container stacks, tanks and pipe racks; finer shadows and anti-aliasing; surfaces that vary from dull to glossy | mid-range GPUs |
| Ultra | all of Enhanced, plus global illumination, screen-space reflections, softer sun shadows, lit base strips and gauges on machines, platform floodlights, a gantry crane, low haze, and an industrial skyline: cooling towers and smokestacks breathing steam, factory halls, pylons | high-end GPUs |
The rules they are built to:
- Standard is the floor. Nothing is drawn below the shipped look on any preset; the others only add to it. Colours, shapes and layout are the same everywhere, so it is recognisably the same factory.
- One set of models and one code path. A preset decides how much is layered on top and how hard the renderer works. The extra detail is separate meshes that drop out with distance.
- Graphics never limit management. Every tool, panel, board and action is built by code that does not look at the preset, and switching preset keeps your connection, position and open work.
- The browser demo has its own two presets. Standard is drawn in code; High loads the model library from the site, with 4x anti-aliasing and softer shadows. Enhanced and Ultra need the desktop build (WebGL has no global illumination or screen-space reflections).
How the recommendation is made: the GPU's name and type, memory and CPU threads
(recommend() in scripts/gfx.gd). Integrated or entry-level GPUs get Standard,
mid-range discrete GPUs Enhanced, high-end ones Ultra, stepping down a level
under 16 GB of memory or 8 threads.
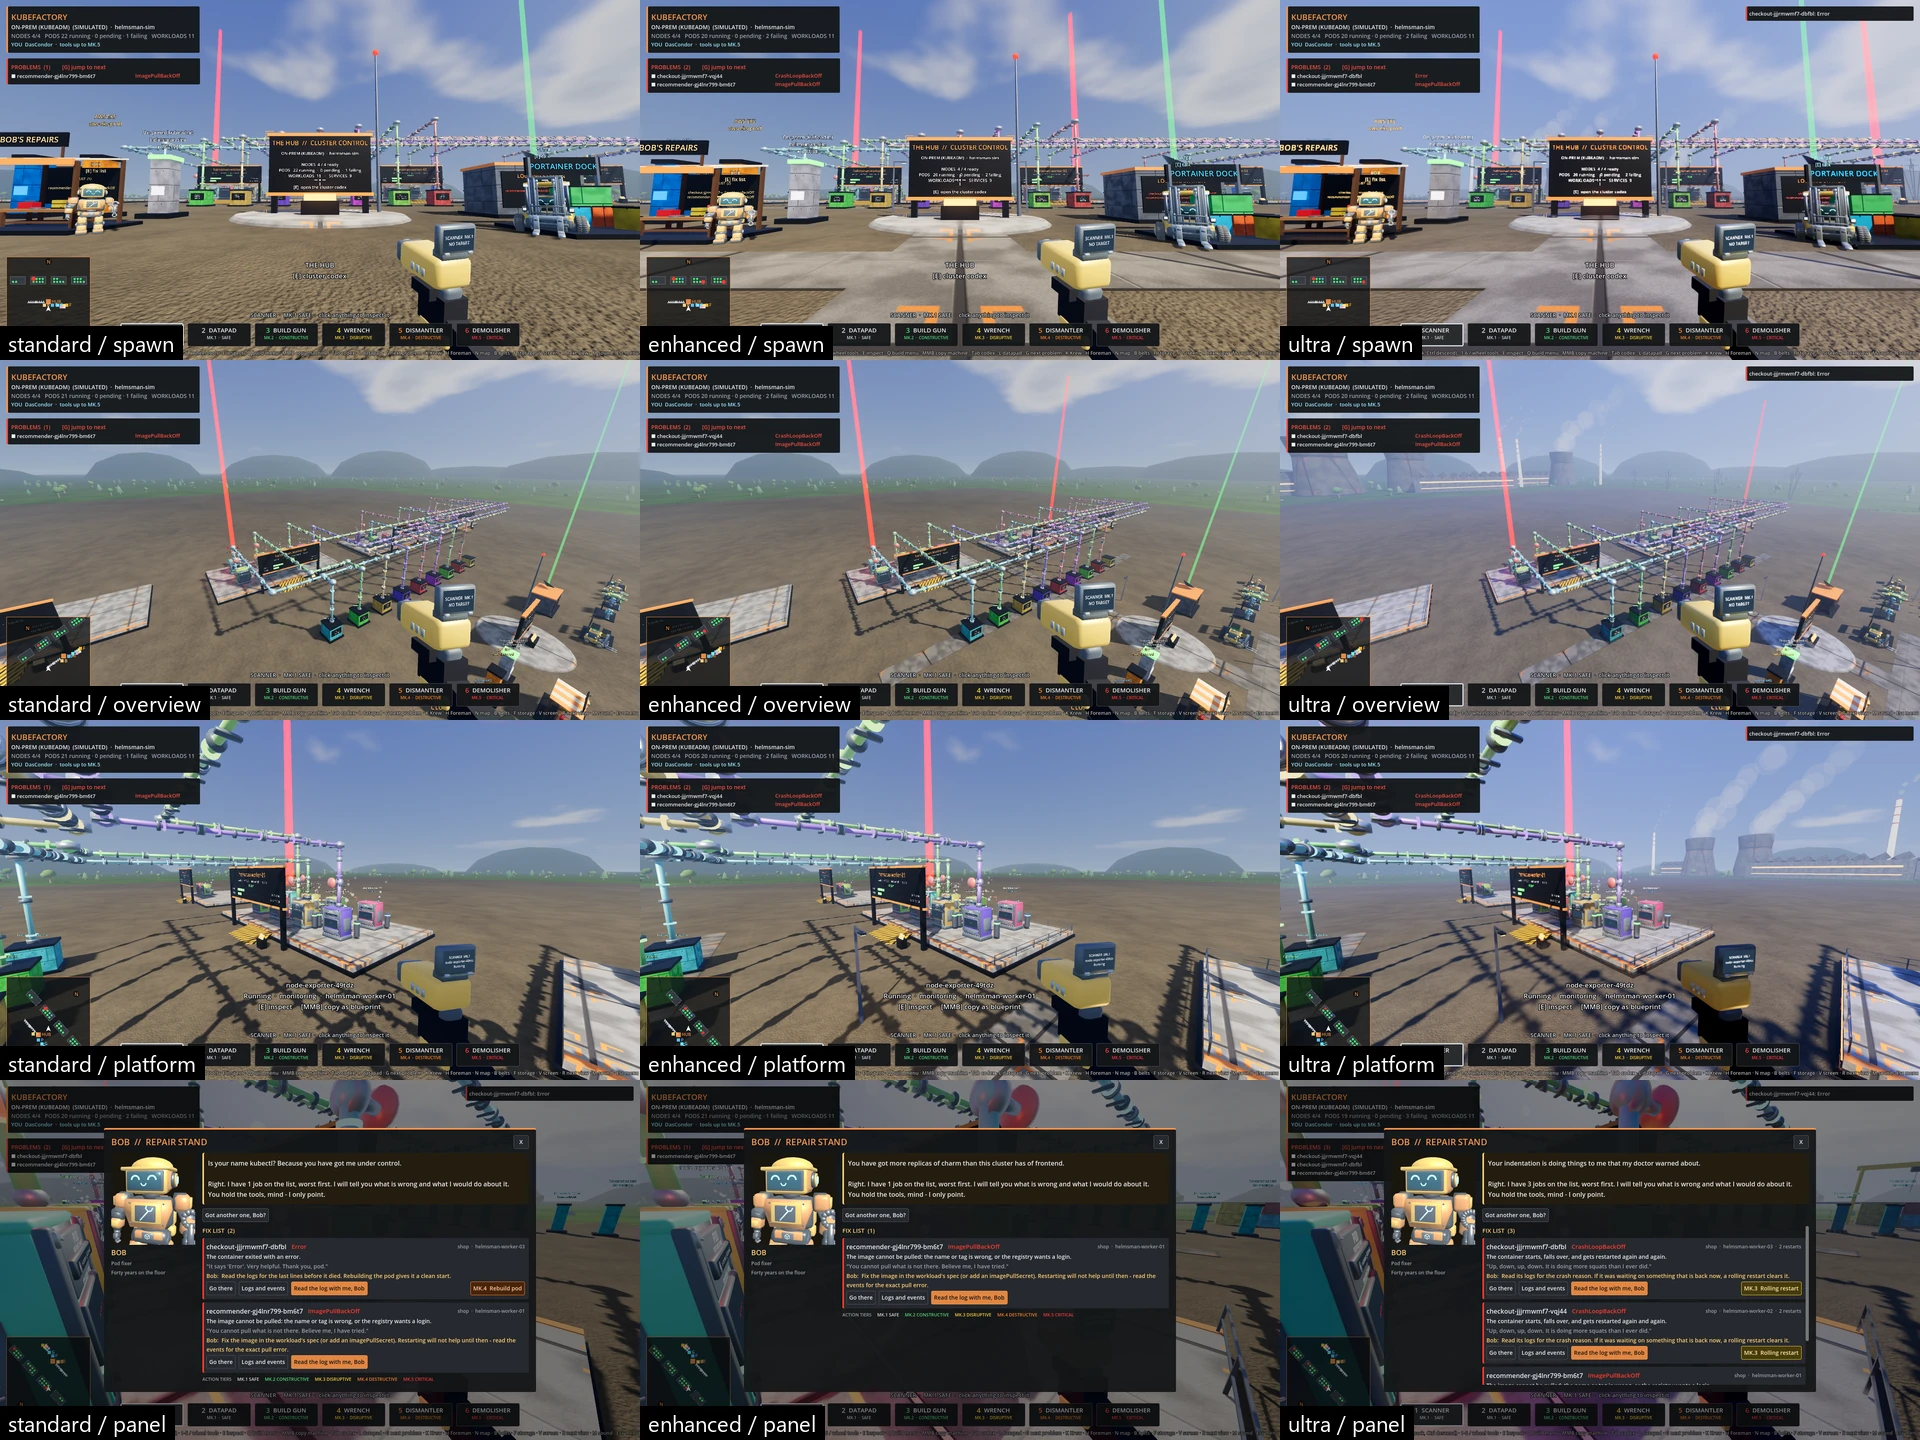
Close-ups of machines, the yard and the skyline are in docs/presets-detail.webp.
Measured against the last release in docs/BENCHMARK.md;
tools\bench.ps1 reruns it on your machine.
👥 Teams (multi-user)
Two ways to share a cluster: everyone connects with their own login (below), or one person runs a KubeFactory server and everyone connects to it with a token, holding no cluster credential at all (docs/SERVER.md).
Several people can work on the same cluster at once, each with their own login.
They see each other as avatars, share an action feed, and are held to a tool-tier
policy the cluster admin sets. Limited accounts work: a namespace-only user sees
that namespace, and tools they have no permission for are locked. Mk.5 actions
require typing the target's name. See ADMIN.md for setup; tools\dev-users.ps1
creates two test logins on the dev cluster so you can try it in three windows.
tools\package.ps1 builds a zip to hand out.
🤖 Porter, the Portainer dock worker
Beside the HUB stands Porter, a crane-backed robot. Press E to talk. He can:
- Build a complete app setup from his dock: Web server, Redis, PostgreSQL,
WordPress + MySQL, the Media server suite and the Monitoring dashboard
(both below). Each comes with its workloads, Services, storage and a
generated password (Kubernetes Secret, or an env file for Compose). On
Kubernetes they are applied from
apps/<id>.k8s.yaml; on a Docker engine they run as a Compose project fromapps/<id>.compose.yaml. Edit or add files there. - Order from app lists: any list in Portainer's app-template format.
catalogs.jsonships with Portainer's official list and two community lists; add more by URL in the conversation (kept in the user folder). Container templates become a Deployment + Service on Kubernetes or adocker runon Docker. Stack templates are skipped. - Manage what he installed: status, go to, logs, restart, remove.
- Install Portainer itself (optional) and open its console. Put your
Portainer address and an API key in
portainer.jsonand its own template list shows up as "My Portainer server".
His two big setups:
| Setup | What he builds |
|---|---|
| Media server suite | Plex (watch), Overseerr (requests), Sonarr / Radarr / Lidarr / Bazarr (TV, films, music, subtitles), Jackett (the indexer proxy they search through) with Prowlarr as the alternative, qBittorrent (download client) and Tautulli (Plex statistics), sharing one media and one downloads volume |
| Monitoring dashboard | Grafana with a ready-made Containers dashboard and a generated admin password, Prometheus, cAdvisor (per-container CPU, memory, network) and node-exporter (the host) |
Jackett needs three things around it, and the suite brings all of them: the
apps that search through it (Sonarr, Radarr, Lidarr), a download client
(qBittorrent) and the shared downloads volume. The comments at the top of
apps/media.compose.yaml walk through wiring them together on first run. The
Kubernetes version is meant for a single-node homelab cluster.
👴 Bob, the pod fixer
Across the yard from Porter, an old hand in a flat cap keeps a repair stand. The board behind him is the cluster's fix list: the worst problems, live. Press E on Bob (or his stall) for the full list. For every job he gives:
- What is wrong, in plain words, worked out from the pod or node status.
- What he would do about it, and the button for it when there is one.
- Go there (jump to the machine or node sign) and Logs and events.
| On the list | Bob's remedy |
|---|---|
| CrashLoopBackOff, OOMKilled | read the logs; Mk.3 rolling restart (restart container on Docker) |
| ImagePullBackOff, ErrImagePull | fix the image or pull secret: no button, a restart will not help |
| CreateContainerConfigError | create the missing ConfigMap / Secret: no button |
| Error, Evicted, anything unrecognised | Mk.4 rebuild the pod |
| Unschedulable pod | Mk.2 uncordon a cordoned node, if there is one |
| Node NotReady | open the node terminal |
| Node cordoned | Mk.2 uncordon |
| Pod running but restarted 5+ times | a warning to look at before it gets worse |
He also has opinions. Walk up to him and he greets you with a zinger about your
cluster or a Kubernetes pick-up line, with a fresh one every few seconds; each
job on the list gets a dry remark of its own, and "Got another one, Bob?" asks
for more. The lines are the BOB_* lists at the top of scripts/kutil.gd.
Bob 2.0: he reads the log for you
Each pod on the fix list has Read the log with me, Bob. He fetches the pod's log (the previous, crashed run when there is one) and its events, and opens a case file:
- The verdict: one sentence naming the most likely cause and the line it is on.
- The lines that matter: the log or event line itself, its line number, what it means, and what to do. Each is marked likely cause, strong lead or symptom, and repeats are counted rather than listed.
He knows the common failures: refused connections, DNS names that do not resolve, bad credentials, permissions, expired certificates, missing files, settings, Secrets and tables, out of memory, full disks, wrong architecture or start command, unpullable images, failed mounts and scheduling, probe failures, stack traces, and what exit codes 1, 2, 126, 127, 137, 139 and 143 mean.
Optional settings live in bob.json next to the game (config\bob.json from source). Every key is
optional and the file can be deleted:
| Key | Default | Does |
|---|---|---|
log_review |
true |
false hides the log reading; the fix list stays |
tail |
200 |
log lines read per container (20 to 2000) |
previous |
true |
read the crashed container's log when the pod has restarted |
max_findings |
6 |
how many lines he reports per case |
ignore |
[] |
regexes; matching lines are skipped (noisy health checks, say) |
rules |
[] |
your own rules, checked before his |
A rule of your own teaches him your application's errors:
{"rules": [{"match": "license (expired|invalid)", "weight": 3,
            "means": "The licence file is out of date.",
            "fix": "Renew it and update the app-license Secret."}]}
weight is 3 for a cause, 2 for a strong lead, 1 for a symptom. The built-in
rules are the RULES list in scripts/bob.gd. The original design notes are in
docs/bob-2.0.md.
Bob only points: his buttons are the same tiered actions as your tools, so the
cluster policy and your permissions apply to them exactly as they do elsewhere.
The diagnoses live in diagnose() in scripts/kutil.gd; add a status there to
teach him a new one.
🔊 Sound
All sounds are synthesised at startup (tool switch, build, dismantle, charge-up while holding, footsteps, datapad, a positional alarm on failing machines). M mutes.
📜 Logs
The datapad (L) has three ledgers: pod logs, cluster events, and an audit trail
of everything done through the game. The audit trail and saved logs are written
to %APPDATA%\Godot\app_userdata\KubeFactory\logs.
Pod logs can come from several providers; pick one on the datapad. Configure
them in log-providers.json:
| Provider | Needs |
|---|---|
| Kubernetes API | nothing |
| Grafana Loki | loki.url (optionally query, tenant, user) |
| AWS CloudWatch | aws CLI; cloudwatch.log_group (guessed for EKS Container Insights) |
| Azure Monitor | az CLI; azure.workspace_id (ContainerLogV2) |
| Google Cloud Logging | gcloud CLI |
📁 Layout
play.bat                    start the game from source
config/                     the editable settings files (beside the exe once installed)
apps/                       Porter's bundled app setups
deploy/                     the optional multi-user manifest for a cluster
docs/                       admin guide, security notes, licences, screenshots
tools/                      setup, packaging, installer, dev cluster, video helpers
scripts/main.gd             game loop, tools, input
scripts/world.gd            cluster state -> 3D world
scripts/platform.gd         node platform        scripts/machine.gd   pod machine
scripts/hud.gd              HUD, panels, datapad, Porter's and Bob's conversations
scripts/viewmodel.gd        the first-person tool in your hand
scripts/gfx.gd              graphics presets and the hardware recommendation
scripts/scenery.gd          the Enhanced / Ultra industrial surroundings
scripts/bench.gd            the rendering benchmark (tools\bench.ps1 drives it)
scripts/kutil.gd            shared helpers, Bob's diagnoses, sign text fitting
scripts/bob.gd              Bob 2.0: log and event reading, its rules, bob.json
scripts/cluster.gd          polling, actions, audit log
agent/                      kf-agent: the native companion (Go): kubeconfig, Kubernetes client, files, LiveView
assets/                     the model library (141 models x 3 tiers) and its catalog
scripts/backend_native.gd   real clusters through kf-agent (default)
scripts/agent.gd            starts and talks to kf-agent      scripts/connections.gd  saved kubeconfig profiles
scripts/models.gd           model library loading, doors, screens
scripts/liveview.gd         LiveView sessions
scripts/backend_kubectl.gd  real clusters via kubectl (--kubectl-cli)   scripts/backend_docker.gd   Docker engine
scripts/backend_demo.gd     simulated clusters   scripts/log_sources.gd      log providers
scripts/apps.gd             Porter's setups, app lists, install ledger
scripts/sfx.gd              synthesised sound    apps/                       bundled app setups
scripts/krew.gd             the Krew's rules and findings      scripts/foreman.gd   Foreman: incidents, the AI pipeline
scripts/controls.gd         key bindings, controller, key hints scripts/minimap.gd  the minimap
scripts/backend_komodo.gd   Komodo (read-only)   scripts/backend_plugin.gd   backend plugins (scripts/plugins.gd: trust)
scripts/server.gd           server mode          scripts/backend_remote.gd   a KubeFactory server as a source
examples/plugins/           an example backend plugin
tests/live/                 in-game tests on the simulation and against throw-away infrastructure
tests/normalize_test.gd     parser test:  engine\Godot_v4.3-stable_win64_console.exe --headless --path . -s tests/normalize_test.gd
More tests and checks:
powershell -ExecutionPolicy Bypass -File tools\build-agent.ps1 -Test                                          companion tests (Go)
powershell -ExecutionPolicy Bypass -File tools\live-test.ps1                                                  companion against a real, disposable kube-apiserver (no Docker)
powershell -ExecutionPolicy Bypass -File tools\live-test.ps1 -Grafana [-GrafanaVersion 13.0.0]               Grafana provider against a real, disposable Grafana
powershell -ExecutionPolicy Bypass -File tools\live-test.ps1 -Kind                                           companion against a real cluster with running containers (after tools\dev-cluster.ps1)
engine\Godot_v4.3-stable_win64_console.exe --headless --path . -s tests/live/docker_backend_test.gd           Docker backend against a real throw-away container
powershell -ExecutionPolicy Bypass -File tools\live-test.ps1 -Tautulli                                       Tautulli provider against a real, disposable Tautulli
engine\Godot_v4.3-stable_win64_console.exe --headless --path . -s tools/model_audit.gd                        audits every model, writes docs/MODEL_AUDIT.md
The model library can be inspected in a browser with the asset reviewer
(tools/model-viewer/index.html, published at
https://dascondor.github.io/kubefactory/model-viewer/): every model at every tier, door open and shut,
with a review checklist you can export.
Want to help? Start with CONTRIBUTING: setup, where things are, the tests and the ground rules.
Design and status documents: ARCHITECTURE, FEATURE_PARITY, KNOWN_LIMITATIONS, MODEL_AUDIT, CHANGELOG, GO_LIVE_2.0.
play.bat --demo --shots=<folder> runs an automated screenshot tour (dev aid).
Against a real context or Docker engine it also deploys and removes throwaway
kf-* apps, scales shop/frontend, deletes one of its pods and, on Docker,
installs Portainer. Only point it at a dev cluster.
Two more dev aids, both read-only: play.bat --demo --toolshots=<folder>
captures each handheld tool, the signs and Bob's stand, and --trailer plays a
scripted 55-second tour for a video. Record it with Godot's movie writer and
convert it with Windows' own encoder:
engine\Godot_v4.3-stable_win64.exe --path . --write-movie out.avi --fixed-fps 60 --resolution 1920x1080 -- --demo --trailer
powershell -ExecutionPolicy Bypass -File tools\to_mp4.ps1 out.avi kubefactory.mp4
🔒 Security
KubeFactory has no server and no credentials of its own: it uses your
kubeconfig and your docker, as you. (A kubeconfig you paste into the wizard is
saved in your user folder; nothing else is kept.) Your cluster permissions are the security boundary; the
in-game tiers and confirmations are guard rails. App lists are treated as
untrusted input. See SECURITY.md for the details and for how to
report a problem.
📄 License
MIT, see LICENSE. KubeFactory is built with the Godot Engine (MIT); notices for it and for the third-party names used are in THIRDPARTY.md. KubeFactory is an independent project and is not affiliated with Kubernetes, Portainer, Docker or any cloud provider.
Support development

If this project was useful to you, you can buy me a coffee to support future work. Contributions are voluntary.