
BoboTiG/py-candlestick-chart
BoboTiG/py-candlestick-chart has 129 GitHub stars and 12 forks. GitHot measured 0 stars in 24 hours. Last checked 2026-11-18 08:02 UTC. Last push 2026-11-10.
What you can do
- Auto-fit to terminal size
- Practical formatting for big, and tiny, numbers
- Integration with Rich
- Simple, yet customizable, API
Measured star growth
- in 24h
- 0
- in 7 days
- Collecting history
- in 15 days
- Collecting history
- in 1 month
- Collecting history
Net star changes over overlapping periods, not daily totals. Missing measurements are left blank. Stars measure attention, not software quality.
About
Draw candlesticks charts right into your terminal, using Python!
Developer ToolsREADME.md
OriginalPython Candlesticks Chart
[!TIP] Become my boss to help me work on this awesome software, and make the world better:

📈 Draw candlesticks charts right into your terminal, using Python!
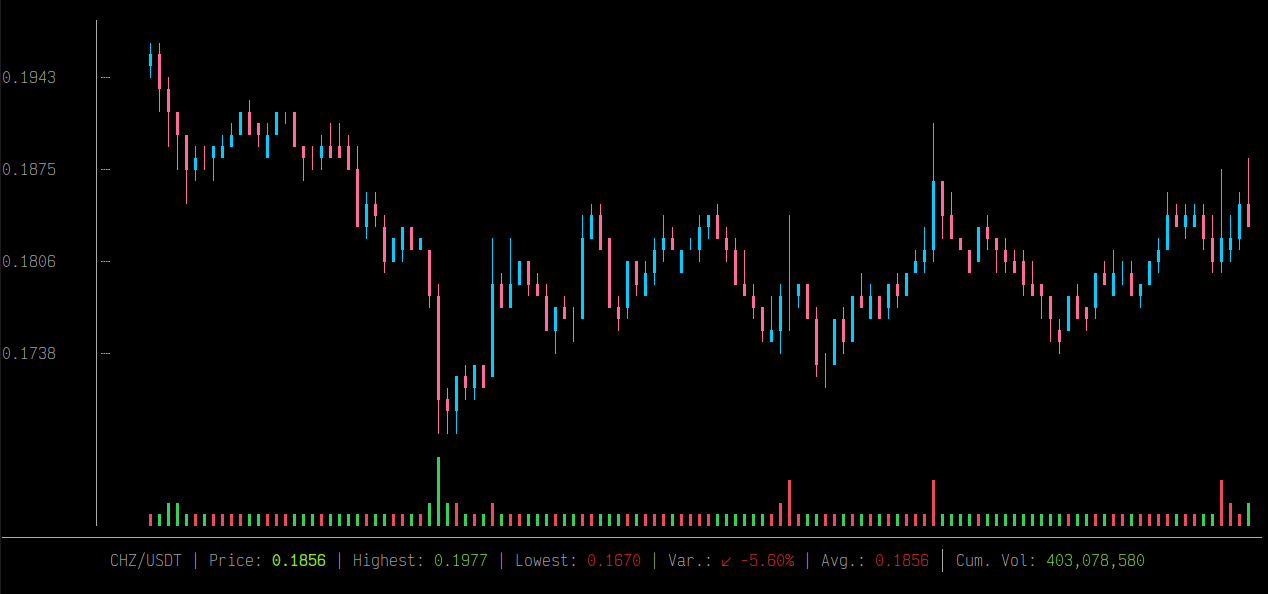
This is a portage from the great cli-candlestick-chart (developed by Julien-R44, written in Rust). You are looking at the Python 3.10+ version.
Note: not tested on macOS, nor Windows (it will likely fail to render colors).
Table of contents:
Features
- Auto-fit to terminal size
- Practical formatting for big, and tiny, numbers
- Integration with Rich
- Simple, yet customizable, API
- Exact same API as the Rust version, plus some sugar
- Simple installation, no external dependencies
Installation
$ python -m pip install -U candlestick-chart
Demonstration
from candlestick_chart import Candle, Chart


# Add some candles
candles = [
    Candle(open=133.520004, close=133.610001, high=126.760002, low=129.410004),
    Candle(open=128.889999, close=131.740005, high=128.429993, low=131.009995),
    Candle(open=127.720001, close=131.050003, high=126.379997, low=126.599998),
    Candle(open=128.360001, close=131.630005, high=127.860001, low=130.919998),
    Candle(open=132.429993, close=132.630005, high=130.229996, low=132.050003),
]

# Create and display the chart
# Optional keyword arguments: title, width, height
chart = Chart(candles, title="Optional title")

# Set the chart title
chart.set_name("BTC/USDT")

# Set customs colors
chart.set_bear_color(1, 205, 254)
chart.set_bull_color(255, 107, 153)
chart.set_vol_bull_color(1, 205, 254)
chart.set_vol_bear_color(255, 107, 153)

# Set custom labels (empty string => label not displayed)
chart.set_label("highest", "ATH")
chart.set_label("lowest", "ATL")
chart.set_label("average", "")
chart.set_label("volume", "")

# Volume pane settings
chart.set_volume_pane_height(6)
chart.set_volume_pane_enabled(False)

# And, it is also responsive!
new_width = 200
new_height = 150
chart.update_size(new_width, new_height)

# By the way, did you know that you can add more candles in real-time?
chart.update_candles(candles[:3])
# Or completely replace current candles
chart.update_candles(candles[:3], reset=True)

# Set a custom color at price 52,348.63
chart.set_highlight(fnum(52_348.63), "red")
chart.set_highlight(fnum(52_348.63), (255, 0, 0))
chart.set_highlight(fnum(52_348.63), "91m")
chart.set_highlight(fnum(52_348.63), "91;47m")

chart.draw()
Binary Usage
When installing the library, an executable is made available (candlestick-chart):
candlestick-chart --help

options:
  -h, --help            show this help message and exit
  -m {stdin,csv-file,json-file}, --mode {stdin,csv-file,json-file}
                        Select the method for retrieving the candles.
  -f FILE, --file FILE  [MODE:*-file] File to read candles from.
  --chart-name CHART_NAME
                        Sets the chart name.
  --bear-color BEAR_COLOR
                        Sets the descending candles color in hexadecimal.
  --bull-color BULL_COLOR
                        Sets the ascending candles color in hexadecimal.
  --version             show program's version number and exit
When requesting the JSON or stdin mode, the library expects a JSON with the following format:
[
    {
        "open": 28994.009766,
        "high": 29600.626953,
        "low": 28803.585938,
        "close": 29374.152344
    },
    ...
]
For all requests, here are supported fields:
"open": float  # mandatory
"close": float  # mandatory
"high": float  # mandatory
"low": float  # mandatory
"volume": float
"timestamp": float
Examples
API
- Basic example with CSV parsing: run with
$ python examples/basic_from_csv_file.py - Basic example with JSON parsing: run with
$ python examples/basic_from_json_file.py - Basic example with stdin parsing: run with
$ ./examples/basic_from_stdin.sh - Fetch candles from Binance: run with
$ python examples/fetch_from_binance.py - Integration with Rich: run with
$ python examples/integrate_with_rich.py - Using a custom chart renderer class: run with
$ python examples/custom_renderer_class.py
Binary
Read CSV from file
candlestick-chart \
    --mode=csv-file \
    --file='./examples/BTC-USD.csv' \
    --chart-name='My BTC Chart' \
    --bear-color='#b967ff' \
    --bull-color='ff6b99'
Read JSON from file
candlestick-chart \
    --mode=json-file \
    --file='./examples/BTC-chart.json' \
    --chart-name='My BTC Chart' \
    --bear-color='#b967ff' \
    --bull-color='ff6b99'
Read from stdin
echo '[
  {
    "open": 28994.009766,
    "high": 29600.626953,
    "low": 28803.585938,
    "close": 29374.152344
  },
  {
    "open": 29376.455078,
    "high": 33155.117188,
    "low": 29091.181641,
    "close": 32127.267578
  }
]' | candlestick-chart \
    --mode=stdin \
    --chart-name='My BTC Chart' \
    --bear-color='#b967ff' \
    --bull-color='ff6b99'
Developers
Setup:
python -m venv venv
. venv/bin/activate
python -m pip install -U pip
Install:
python -m pip install -e '.[test]'
Test:
python -m pytest