
0xfurai/peekaping
0xfurai/peekaping has 1,216 GitHub stars and 87 forks. GitHot measured 0 stars in 24 hours. Last checked 2026-11-09 07:43 UTC. Last push 2026-10-31.
Best Uptime Kuma Alternative
Measured star growth
- in 24h
- 0
- in 7 days
- Update delayed
- in 15 days
- Update delayed
- in 1 month
- Update delayed
Net star changes over overlapping periods, not daily totals. Missing measurements are left blank. Stars measure attention, not software quality.
README.md
Original
Peekaping
Open-source, self-hosted uptime monitoring. A modern, API-first Uptime Kuma alternative built with Go and React.
Website · Live demo · Docs · Discord



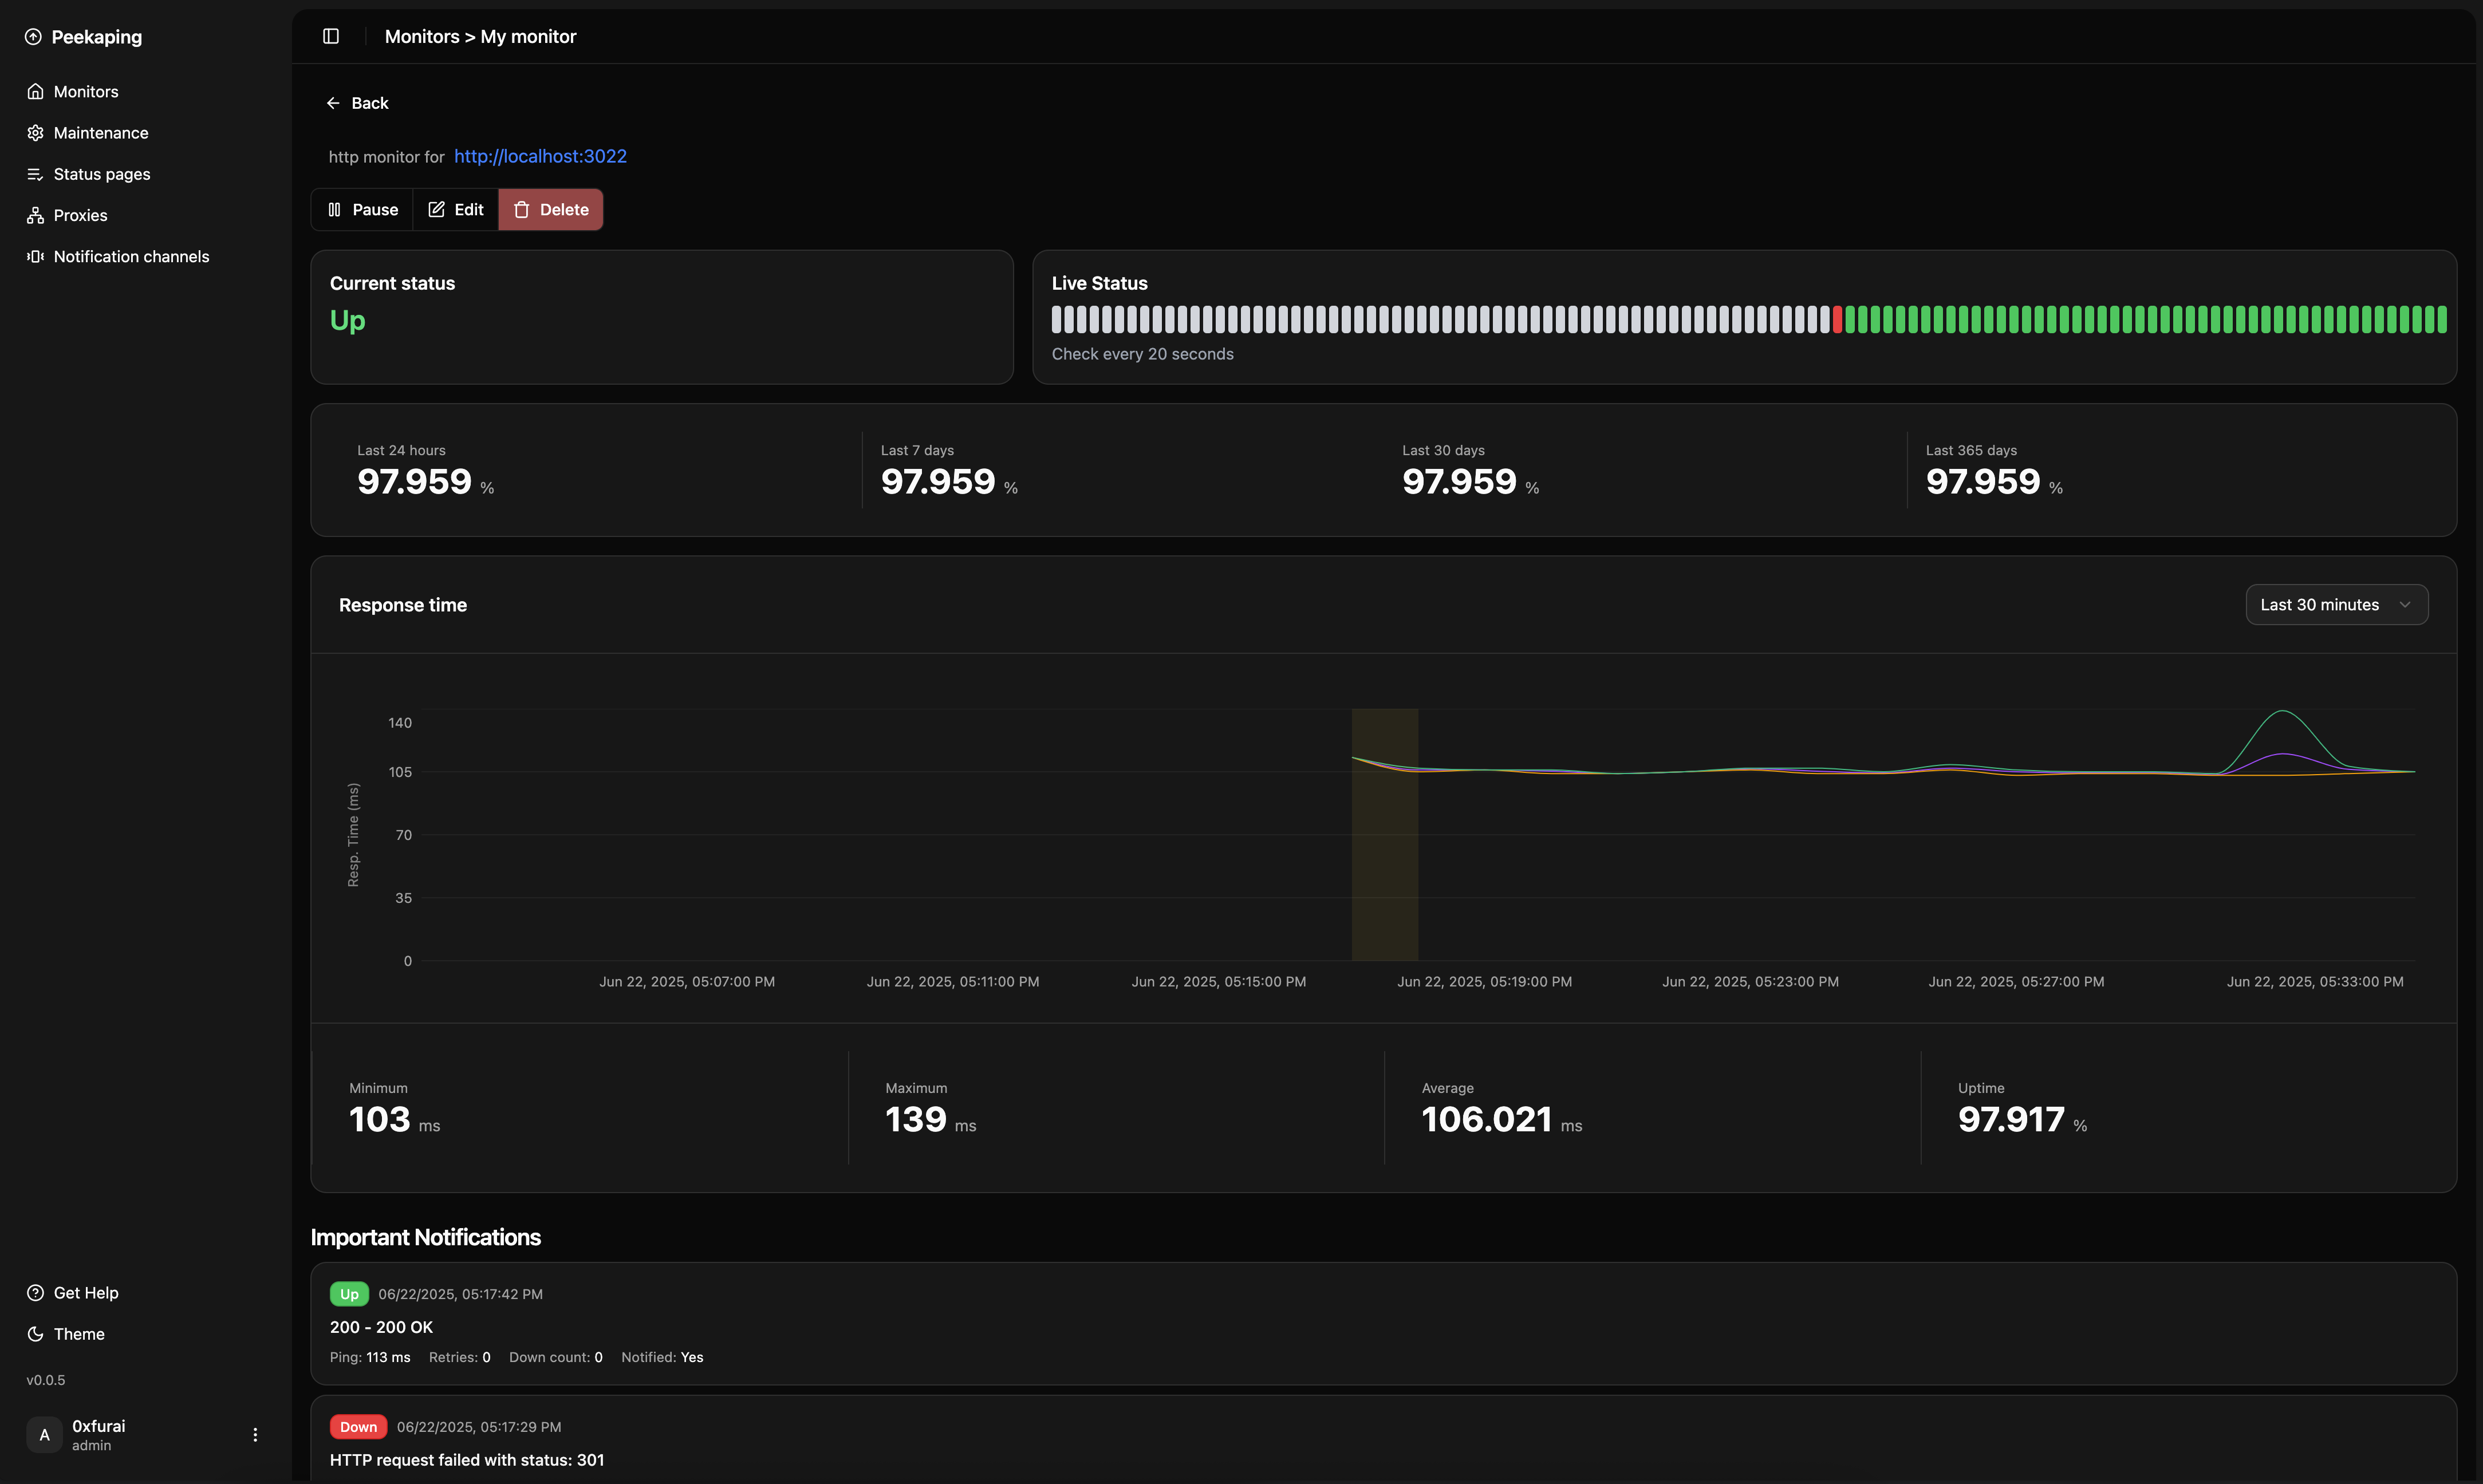
Peekaping checks your websites, APIs, databases and message queues, alerts your team where it already talks when something goes down, and publishes status pages for your users. It runs on your own server, with your data in SQLite or PostgreSQL.
[!WARNING] Peekaping is in beta. It's under active development and some features may change. Try it outside production first, and please report the issues you find: your feedback is what gets Peekaping to production-ready.
Quick start (Docker + SQLite)
docker run -d --restart=always \
  -p 8383:8383 \
  -e DB_NAME=/app/data/peekaping.db \
  -v $(pwd)/.data/sqlite:/app/data \
  --name peekaping \
  0xfurai/peekaping:latest
Then open http://localhost:8383. The image runs Peekaping in single mode: one process, as a non-root user, with no Redis. It serves the web app and the API on port 8383. For HTTPS, put a reverse proxy in front of it.
| Setup | Guide |
|---|---|
| Docker + SQLite | docs.peekaping.com/self-hosting/docker-with-sqlite |
| Docker + PostgreSQL | docs.peekaping.com/self-hosting/docker-with-postgres |
| Kubernetes (Helm) | docs.peekaping.com/self-hosting/kubernetes-helm |
These images run single mode, the default for new installs. Cluster mode (Kubernetes with Helm, or Docker Compose) is for installs that need to scale out. See Deployment modes to choose.
MongoDB storage was removed. If you ran Peekaping on MongoDB, move your data to SQLite or PostgreSQL before you upgrade.
Prefer a managed host? 
Features
Monitors
| Category | Monitors |
|---|---|
| Web & network | HTTP/HTTPS, TCP, Ping (ICMP), DNS, SMTP |
| Application & infrastructure | Push (incoming heartbeat), Docker container, gRPC, SNMP |
| Databases & caches | PostgreSQL, MySQL/MariaDB, Microsoft SQL Server, MongoDB, Redis |
| Messaging & streaming | MQTT broker, RabbitMQ, Kafka producer |
Alert channels
| Category | Channels |
|---|---|
| Chat & collaboration | Slack, Discord, Telegram, Microsoft Teams, Google Chat, Mattermost, Matrix, Signal, WhatsApp (WAHA), LINE Messenger, WeCom |
| On-call & incidents | PagerDuty, Opsgenie, Grafana OnCall, PagerTree |
| Email, SMS & webhooks | Email (SMTP), SendGrid, Twilio, Webhook |
| Push notifications | ntfy, Gotify, Pushover, Pushbullet |
Everything else
- Status pages, public or private, on your own domain
- SVG status badges for your READMEs and dashboards
- Maintenance windows, once or on a schedule, so planned work doesn't page anyone
- Two-factor authentication and brute-force login protection
- TLS certificate expiry notifications
- API keys and a REST API with an OpenAPI spec for everything in the app
- Proxies and tags to organize monitors
- A community Terraform provider
Why Peekaping
Peekaping started from our experience with Uptime Kuma. We respect the project and what it gave the community, and we wanted to fix the limits teams hit when they scale it and wire monitoring into their DevOps processes.
- API-first. Every function in the app is available through the REST API, so you can automate it from CI/CD and Infrastructure as Code tools.
- Fast and light. The server is written in Go, which keeps CPU and RAM use low even with many monitors.
- Typed end to end. A compiled Go server and a typed React + TypeScript client make it stable and predictable.
- Easy to extend. The modular server adds new monitor types and notification channels without touching the core.
- Your choice of storage. SQLite for an easy start, PostgreSQL for production.
Roadmap
General
- Incidents
- Migration tool from Uptime Kuma
- Multiple users, groups and access levels
- Group monitors
- Homepage widget support (in progress)
- Gatus-like conditions
Monitors
- HTTP(S) keyword and JSON query
- Steam
- GameDig
- Playwright
Notification channels
- WhatsApp (Whapi)
- CallMeBot (WhatsApp, Telegram Call, Facebook Messenger)
- AliyunSMS (阿里云短信服务)
- DingDing (钉钉)
- ClickSend SMS
- Rocket.Chat
Contributing
We welcome contributions! Please:
- Fork the repository
- Set up your environment with the development guide. You need Go, Node.js and Bun, installed any way you like;
make setupchecks them. - Create a feature branch
- Make your changes
- Add tests if applicable
- Submit a pull request
Community and support
- Bugs and feature requests: GitHub Issues
- Chat: Discord
- Dev logs and tips: @0xfurai on X

License
This project is licensed under the MIT License. See the LICENSE file for details.
Acknowledgments
- Inspired by Uptime Kuma
- Built with amazing open-source technologies
- Thanks to all contributors and users
Choosing an Uptime Kuma alternative
What to look for
Look at the technology stack and architecture first. Tools built with compiled languages (Go, Rust) are faster and use fewer resources. An API-first design is critical for automation and for CI/CD integration.
Make sure the tool supports the protocols you need to monitor (HTTP/HTTPS, TCP, databases, Docker, gRPC) and the channels your team uses. Flexible storage (SQLite or PostgreSQL), security features (two-factor login, API keys), a modular architecture you can extend, and an active community with good documentation matter too.
How to choose
Decide how you'll deploy it. Self-hosted tools give you full control over your data and deep customization, but you run and maintain them. Cloud services set up quickly and update themselves, but limit customization and cost a monthly subscription.
Then test it in practice: deploy it, create real monitors of different types, simulate failures and see how fast they're detected. Check resource use under load, how easy the API is to integrate, and the quality of the interface. Teams choose Peekaping when they need high performance, an API-first architecture and no vendor lock-in.
Made with 💜 by the Peekaping team
Explore related projects
awesome-selfhosted/awesome-selfhosted
A list of Free Software network services and web applications which can be hosted on your own servers
335,563 starsimmich-app/immich
High performance self-hosted photo and video management solution.
118,645 starsStirling-Tools/Stirling-PDF
#1 PDF Application on GitHub that lets you edit PDFs on any device anywhere
96,149 starslouislam/uptime-kuma
A fancy self-hosted monitoring tool
93,425 stars