
0xERR0R/dex has 83 GitHub stars and 12 forks. GitHot measured 0 stars in 24 hours. Last checked 2026-11-17 04:06 UTC. Last push 2026-11-15.
What you can do
- Lightweight and efficient
- Supports all architectures
- Real-time container metrics monitoring
- Easy integration with Prometheus and Grafana
Measured star growth
- in 24h
- 0
- in 7 days
- Update delayed
- in 15 days
- Update delayed
- in 1 month
- Update delayed
Net star changes over overlapping periods, not daily totals. Missing measurements are left blank. Stars measure attention, not software quality.
About
Prometheus Docker EXporter
Developer ToolsREADME.md
Original


DEX - Docker EXporter for prometheus
DEX is a lightweight Prometheus exporter that monitors Docker containers and exports their metrics. It's designed to run as a Docker container and supports all architectures.
Key Features
- Lightweight and efficient
- Supports all architectures
- Real-time container metrics monitoring
- Easy integration with Prometheus and Grafana
- No configuration required for basic usage
Exposed Metrics
| Metric Name | Type | Description | Labels |
|---|---|---|---|
| dex_block_io_read_bytes_total | Counter | Total number of bytes read from block devices | container_name |
| dex_block_io_write_bytes_total | Counter | Total number of bytes written to block devices | container_name |
| dex_container_exited | Gauge | 1 if container has exited, 0 otherwise | container_name |
| dex_container_restarting | Gauge | 1 if container is restarting, 0 otherwise | container_name |
| dex_container_restarts_total | Counter | Total number of container restarts | container_name |
| dex_container_running | Gauge | 1 if container is running, 0 otherwise | container_name |
| dex_cpu_utilization_percent | Gauge | Current CPU utilization percentage | container_name |
| dex_cpu_utilization_seconds_total | Counter | Cumulative CPU time consumed | container_name |
| dex_memory_total_bytes | Gauge | Total memory limit in bytes | container_name |
| dex_memory_usage_bytes | Counter | Current memory usage in bytes | container_name |
| dex_memory_utilization_percent | Gauge | Current memory utilization percentage | container_name |
| dex_network_rx_bytes_total | Counter | Total bytes received over network | container_name |
| dex_network_tx_bytes_total | Counter | Total bytes transmitted over network | container_name |
| dex_pids_current | Counter | Current number of processes in the container | container_name |
Prerequisites
- Docker installed and running
- Prometheus server (for metrics collection)
- Grafana (optional, for visualization)
Configuration
| Environment Variable | Description | Default |
|---|---|---|
DEX_PORT |
The port the exporter will listen on. | 8080 |
DEX_LABELS |
Comma-separated list of additional labels to export. | "" |
Dynamic Labels
You can add extra labels to all metrics using the DEX_LABELS environment variable. This can be useful for adding more context to your metrics, such as the image name or command.
Available Labels:
imageimage_idcommandcreated
Example:
export DEX_LABELS="image,command"
This will add the image and command labels to all exported metrics.
[!WARNING] NOTE! High Cardinality Ahead!
Each unique combination of key-value label pairs represents a new time series in Prometheus. Using labels with high cardinality (many different values), such as
image_idorcreated, can dramatically increase the amount of data stored and impact Prometheus' performance.For more information, please see the Prometheus documentation on labels.
Run with docker
Start docker container with following docker-compose.yml:
version: '2.1'
services:
   dex:
      image: spx01/dex
      container_name: dex
      volumes:
         - /var/run/docker.sock:/var/run/docker.sock
      ports:
         - 8386:8080
      restart: always
Building from Source
As an alternative to Docker, you can build and run DEX from source:
# Clone the repository
git clone https://github.com/spx01/dex.git
cd dex

# Build the binary
go build -o dex .

# Run the exporter
./dex
Test with curl
$ curl localhost:8386/metrics
Example output:
# HELP dex_container_running 1 if docker container is running, 0 otherwise
# TYPE dex_container_running gauge
dex_container_running{container_name="dex"} 1
# HELP dex_cpu_utilization_percent CPU utilization in percent
# TYPE dex_cpu_utilization_percent gauge
dex_cpu_utilization_percent{container_name="dex"} 0.036
...
Contributing
Contributions are welcome! Please feel free to submit a pull request.
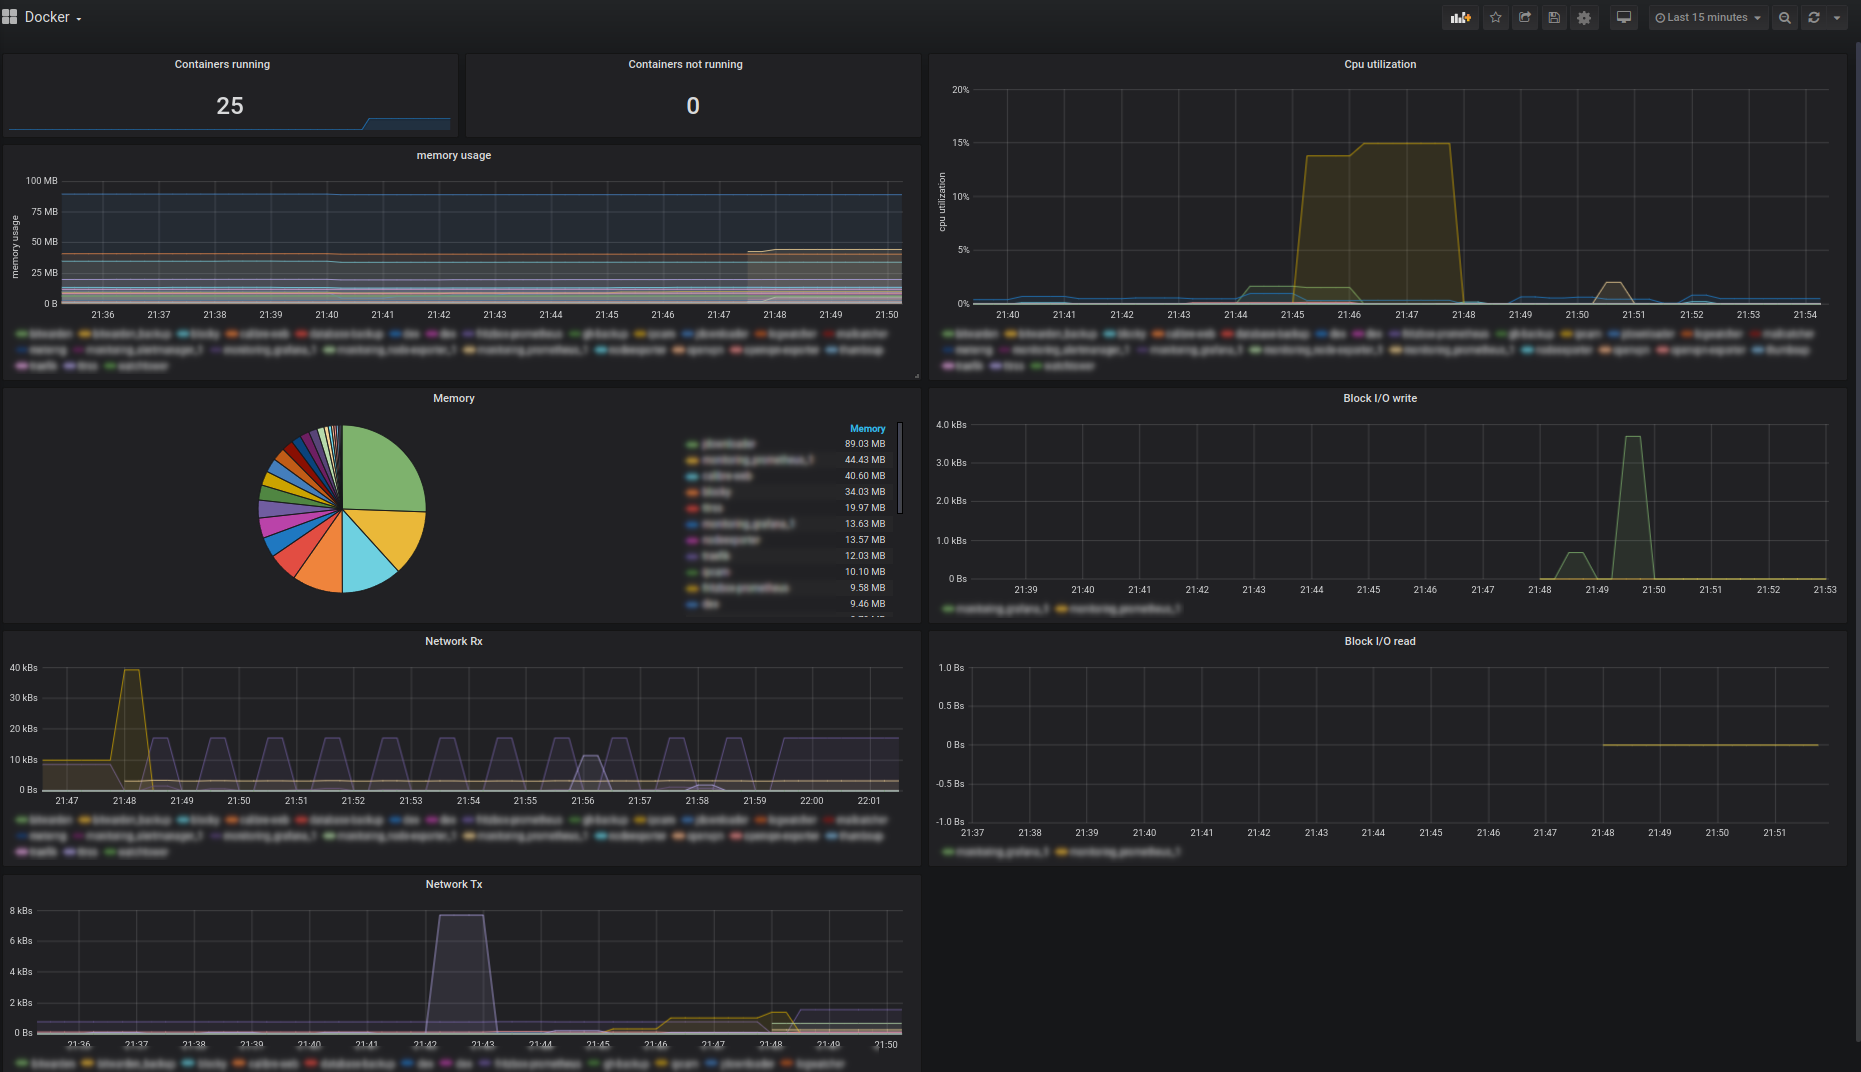
Grafana dashboard
Grafana 7
Example grafana7 dashboard definition as JSON
 .
Grafana 8
Another dashboard for Grafana 8 (thanks @scMarkus !!!) as JSON
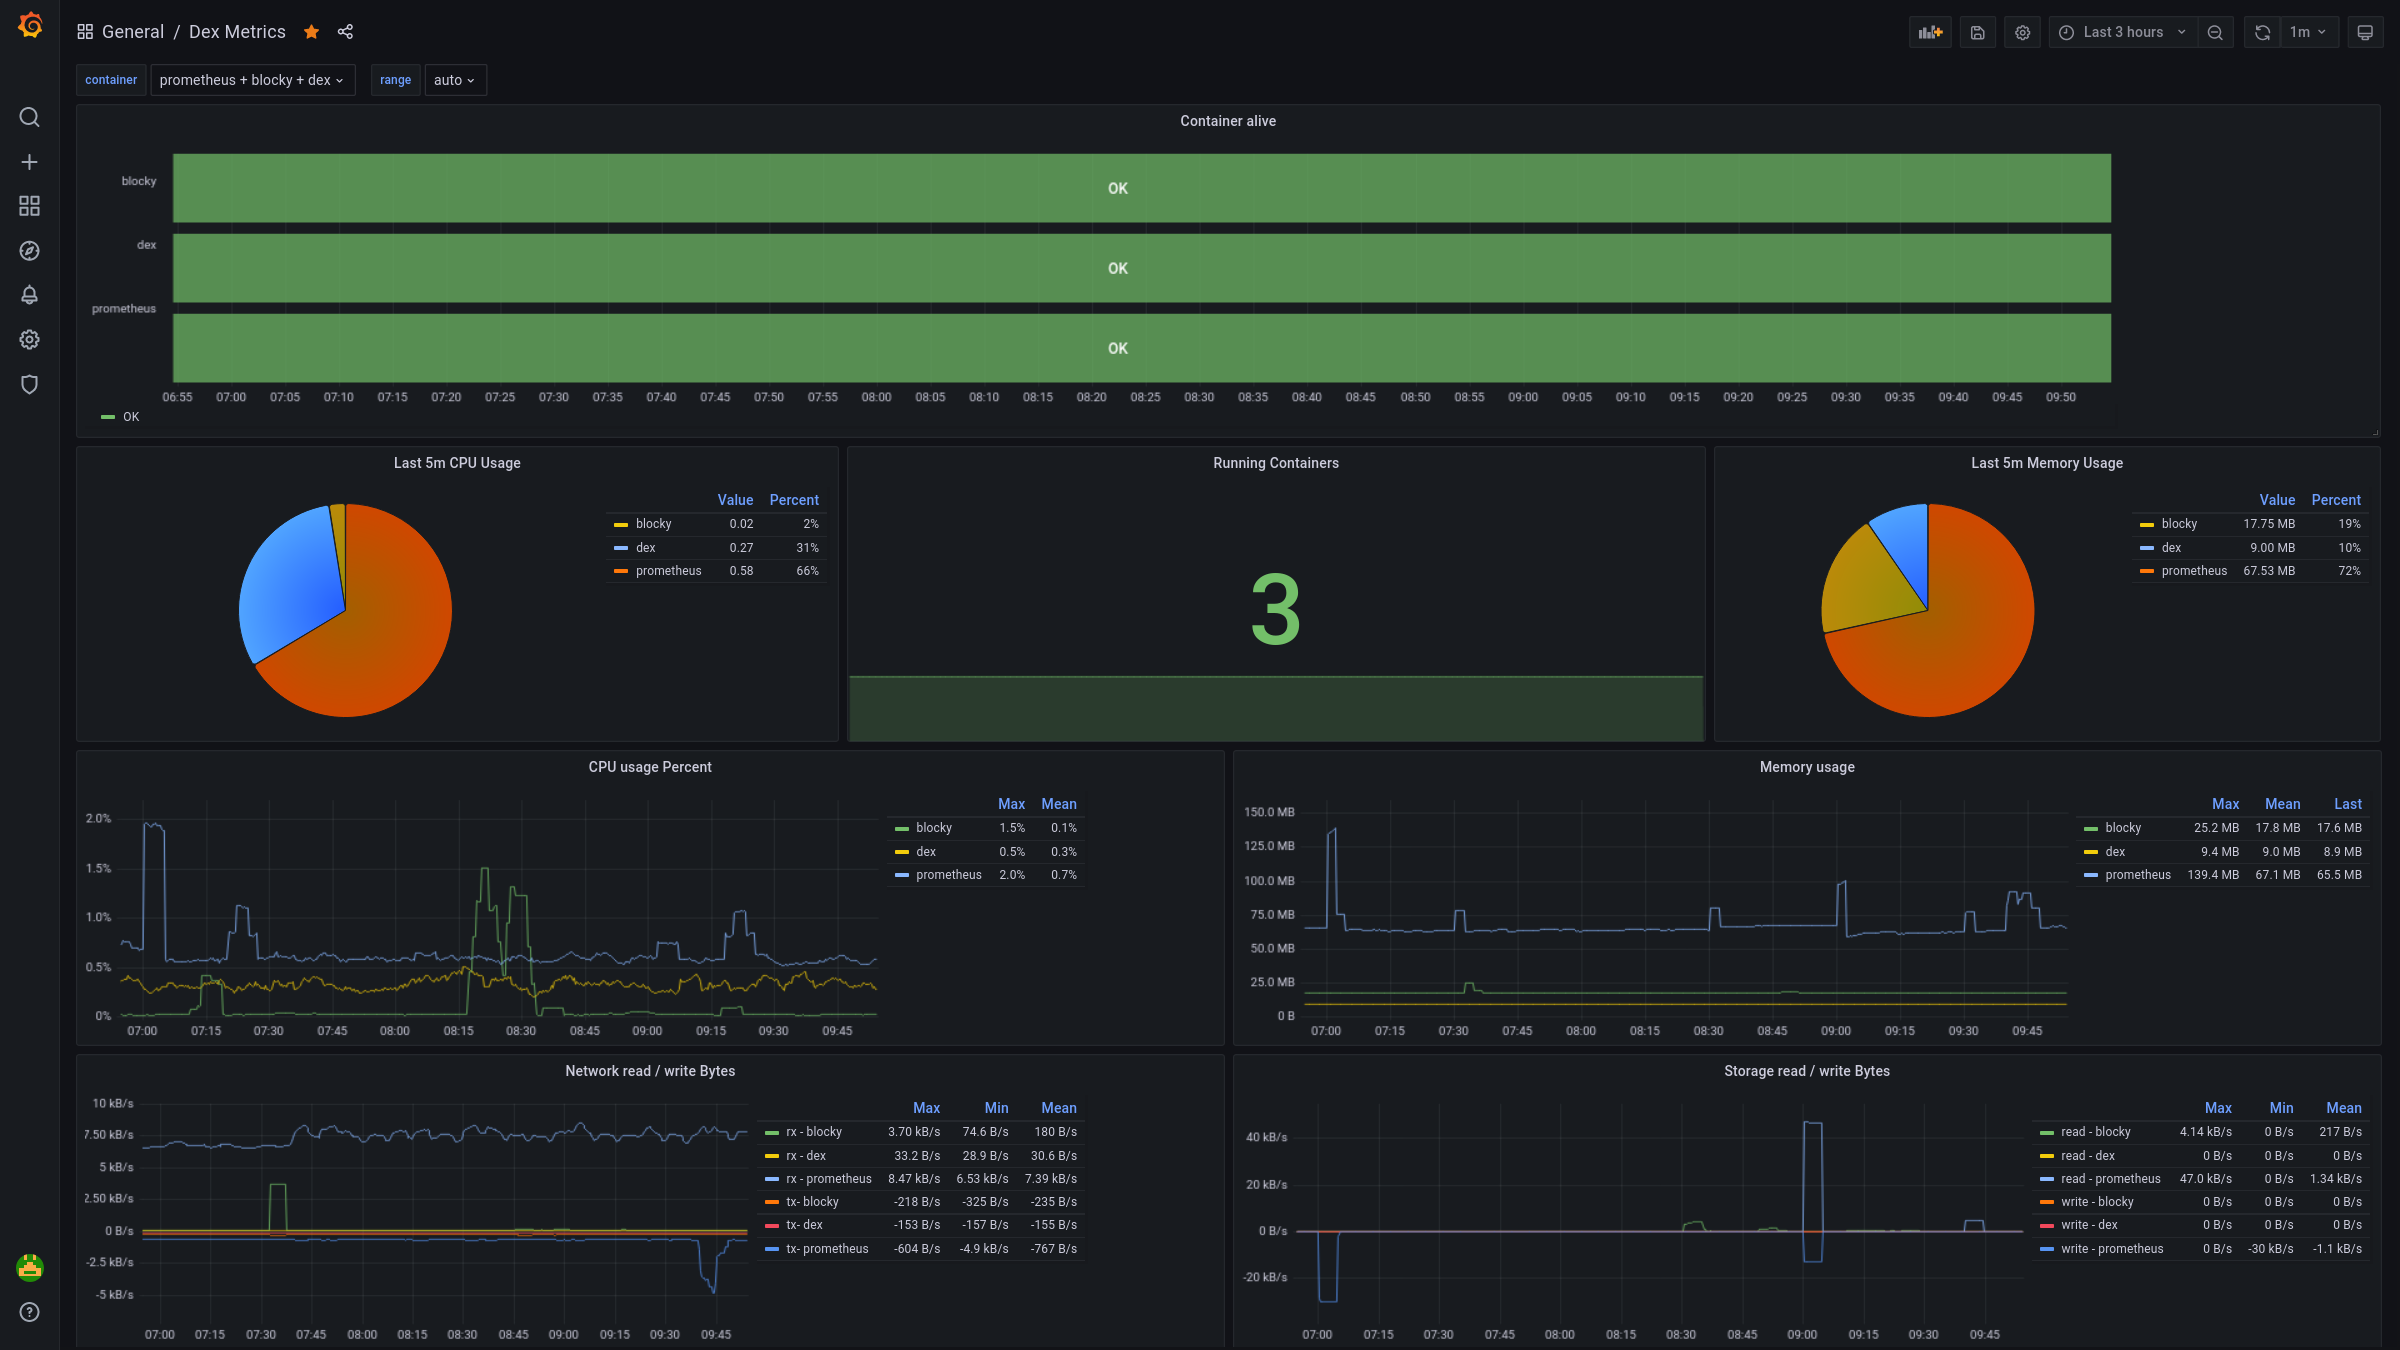
Modification (thanks @GitSchorsch) with additional job filter as JSON