
wkoszek/kmnsim
wkoszek/kmnsim has 59 GitHub stars and 5 forks. Star changes are not measured yet. Last checked 2026-11-14 12:57 UTC. Last push 2026-04-07.
측정된 스타 증가
- in 24h
- 기록 수집 중
- in 7 days
- 기록 수집 중
- in 15 days
- 기록 수집 중
- in 1 month
- 기록 수집 중
서로 겹치는 기간의 순증가량이며 일별 합계가 아닙니다. 측정값이 없으면 비워 둡니다. 스타는 관심도를 나타내며 품질을 보장하지 않습니다.
소개
Simple Ethernet network simulator with text-based topology and virtual hosts
학습README.md
OriginalKoszek-Matyja Network Simulator

It's a simple simulator of the Ethernet network architecture.
You specify network topology in a text file, and run the simulator. Simulator interprets the text file, and creates virtual hosts, its interfaces, switches/hubs and their interfaces too. It then creates connections between those.
Based on what has been requested in the configuration file, you can then
ping the a host from another one and observe the network activity stage by
stage.
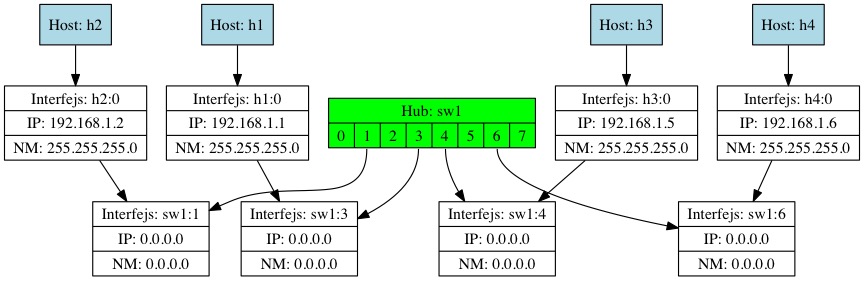
Flow of data is documented in the "report file". Except from report file, one can also visualize the topology of the network in Graphviz, through the The DOT language.
Usage
Usage of kmnsim looks like this:
Usage: kmnsim [-a] [-d] [-D <file] [-h] [-S <file>] [-T <file>] [-v]
spec_file
-a		direct summary (.out), .dot and .txt files to spec_file.EXT;
-d		turn on debug mode;
-D <file>	put Graphviz file to <file>
-h		print this help
-S <file>	put summary file to <file>
-T <file>	put text (debug) file to <file>
-v		turn verbose mode
If you want to get all output files to the same prefix path, use option
-a. For a debugging, you may want to turn a debugging mode with -d,
which will cause more debugging warnings to be printed out. If you want to
just get a .dot file (for graphing with Graphviz), use -D flag. -h will
print help. Both -S and -T are used for tracking how the flow of packets
happened in the network. The -v turns the verbose mode. One can specify
-v multiple tiles (e.g.: -vv) to get more verbose output.
Examples
To generate a summary file, use:
./kmnsim -d -v -S spec.4.i out4
Assuming you want to plot a configuration file from spec.5.i file.
For getting a .dot file, you:
./kmnsim -d -v -D spec.4.u out4.dot
(later just use dot -Tjpg -o out4.dot out4.jpg to get an JPG file).
Example JPG file (which came from an input file spec.11.i in conf/
directory) may look like this:
Configuration file syntax
Example configuration file looks like this (see spec/spec.4.i file):
     1	host h1 create
     2	host h2 create
     3
     4	iface h1 0 ip 192.168.1.1
     5	iface h1 0 netmask 255.255.255.0
     6	iface h1 0 mac a2:b1:c1:1:2:3
     7
     8	iface h2 0 ip 192.168.1.2
     9	iface h2 0 netmask 255.255.255.0
    10	iface h2 0 mac a3:c3:d3:a2:10:20
    11
    12	hub buh1 create
    13
    14	connect buh1 0 h1 0
    15	connect buh1 1 h2 0
Following are the descriptions of individual lines:
a. Lines (1) and (2) create hosts h1 and h2 respectively
b. Lines (4--6) configure the interface 0 of host h1 with IP address, the netmask and the physical MAC address
c. Lines (8--10) are like (b), but for host h2
d. Line (12) creates hub called buh1
e. Line (14) uses connect directive to connect hub's buh1 interface 0 with host's h1 interface 0.
f. Line (15) is like line (14), but for host h2
Author
- Wojciech Adam Koszek, [email protected]
- http://www.koszek.com