thomasp85/fawkes
thomasp85/fawkes has 26 GitHub stars and 2 forks. GitHot measured 0 stars in 24 hours and 0 in 7 days. Last checked 2026-11-15 07:17 UTC. Last push 2025-08-28.
측정된 스타 증가
- in 24h
- 0
- in 7 days
- 0
- in 15 days
- 기록 수집 중
- in 1 month
- 기록 수집 중
서로 겹치는 기간의 순증가량이며 일별 합계가 아닙니다. 측정값이 없으면 비워 둡니다. 스타는 관심도를 나타내며 품질을 보장하지 않습니다.
소개
An R Interface to the AxiDraw plotter
창작 및 미디어README.md
Originalfawkes 


This package provides an R API to control the AxiDraw pen
plotter. Under the hood it interfaces with the
AxiDraw Python API and provides more
or less the same possibilities. More interesting, though, is that it
also provides integration with the standard R plotting system through a
graphic device (axi_dev()) that translates plotting instructions from
e.g. base and grid graphics to plotter movement.
Installation
fawkes is pretty niche by its very nature and it is unlikely that it will be submitted to CRAN. This should not be conflated with it not being ready for use. The current version can be installed directly from github using pak:
# install.packages('pak')
pak::pak('thomasp85/fawkes')
Examples
It is difficult to showcase the use of a piece of software meant to
communicate with a pen plotter virtually. axi_svg() provides access to
the svg plotting capabilities build into the python API, and
axi_manual() wraps the interactive mode. More interesting from R is
the axi_dev() that opens up a graphic device that sends instructions
to the plotter. The device comes with a lot of batteries included and
will e.g. ensure stroking of the requested width by drawing multiple
offsetted lines, draw fill with hatching, ask for pen change when the
colour changes, and optimise the travel path to improve plotting speed.
All of this is impossible to show directly, but fawkes also provides
ghost_dev() that uses the exact same routines as axi_dev() but
collects the instructions and lets you preview them.
library(fawkes)
library(ggplot2)

p <- ggplot(mtcars) +
  geom_point(aes(disp, mpg)) +
  facet_wrap(~ gear) +
  theme_bw(base_size = 10) +
  theme(
    plot.background = element_blank(),
    panel.background = element_blank()
  )

gd <- ghost_dev('A6', portrait = FALSE, margins = 5, ignore_color = TRUE)
p
invisible(dev.off())

gd$preview()
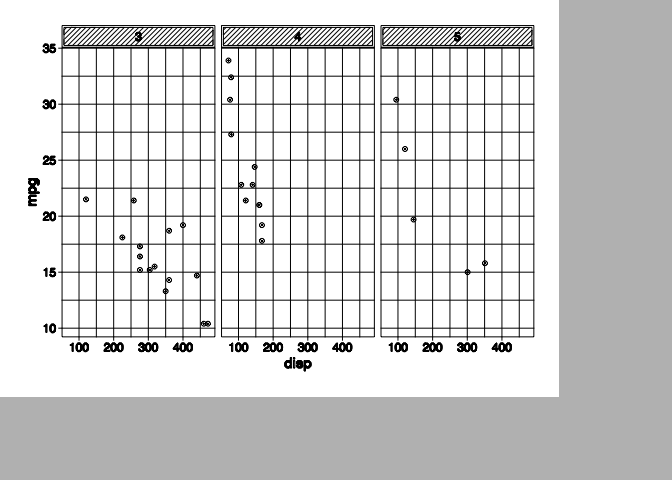
It is also possible to see the movement when the pen is raised
gd$preview(plot_air = TRUE)
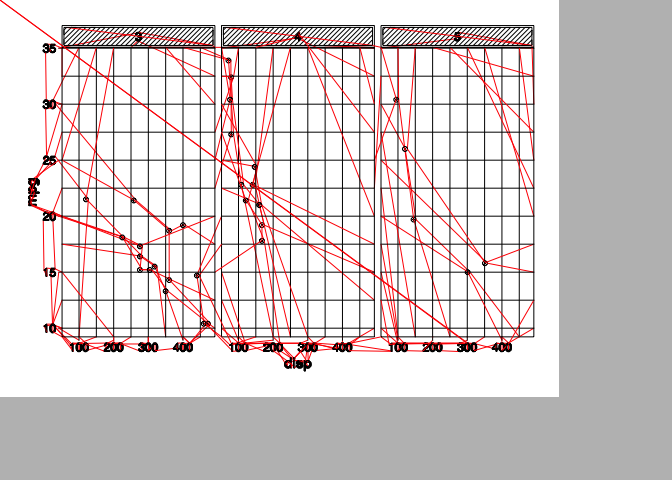
This makes it easy to quickly assess the efficacy of the automatic path optimisation:
gd <- ghost_dev('A6', portrait = FALSE, margins = 5, ignore_color = TRUE,
                optimize_order = 'none')
p
invisible(dev.off())

gd$preview(plot_air = TRUE)