
spotify/chartify
spotify/chartify has 3,654 GitHub stars and 336 forks. GitHot measured -1 stars in 24 hours and -2 in 7 days. Last checked 2026-11-09 15:12 UTC. Last push 2024-10-16.
Python library that makes it easy for data scientists to create charts.
What you can do
- Consistent input data format: Spend less time transforming data to get your charts to work. All plotting functions use a consistent tidy input data format.
- Smart default styles: Create pretty charts with very little customization required.
- Simple API: We've attempted to make the API as intuitive and easy to learn as possible.
- Flexibility: Chartify is built on top of Bokeh, so if you do need more control you can always fall back on Bokeh's API.
측정된 스타 증가
- in 24h
- -1
- in 7 days
- -2
- in 15 days
- 업데이트 지연
- in 1 month
- 업데이트 지연
서로 겹치는 기간의 순증가량이며 일별 합계가 아닙니다. 측정값이 없으면 비워 둡니다. 스타는 관심도를 나타내며 품질을 보장하지 않습니다.
README.md
OriginalChartify


Chartify is a Python library that makes it easy for data scientists to create charts.
Why use Chartify?
- Consistent input data format: Spend less time transforming data to get your charts to work. All plotting functions use a consistent tidy input data format.
- Smart default styles: Create pretty charts with very little customization required.
- Simple API: We've attempted to make the API as intuitive and easy to learn as possible.
- Flexibility: Chartify is built on top of Bokeh, so if you do need more control you can always fall back on Bokeh's API.
Examples
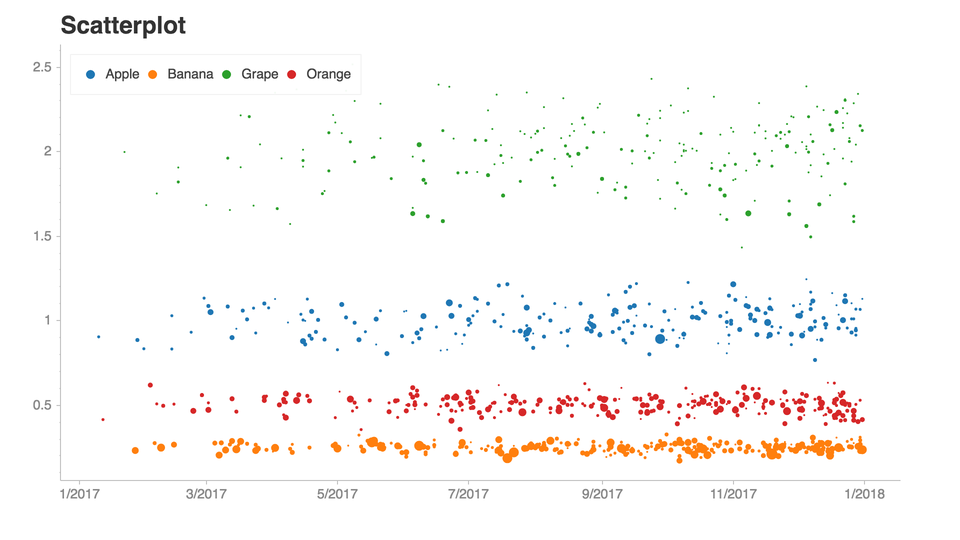
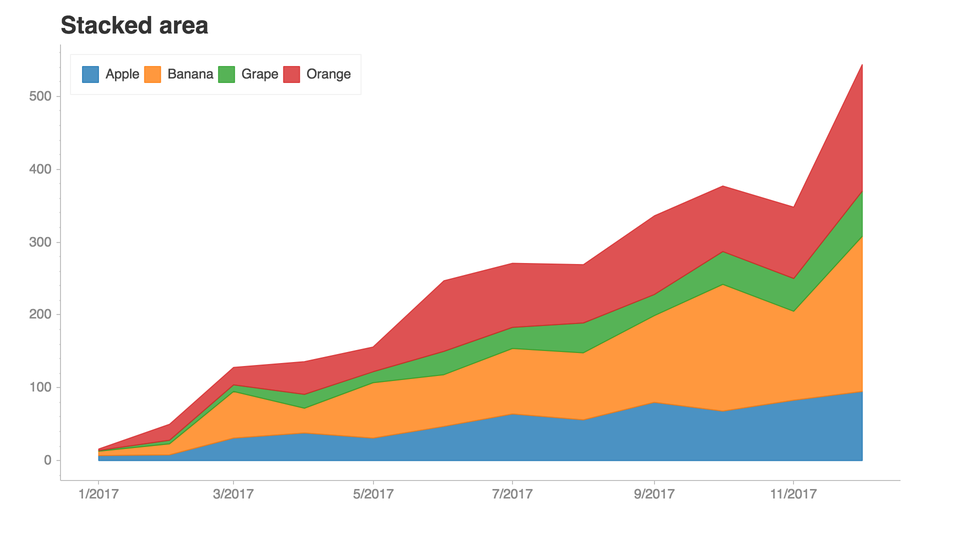
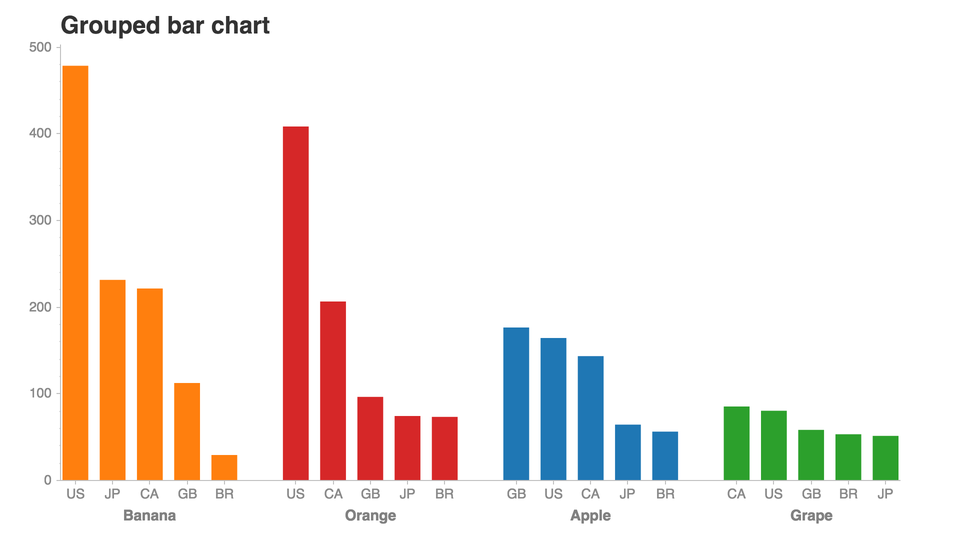
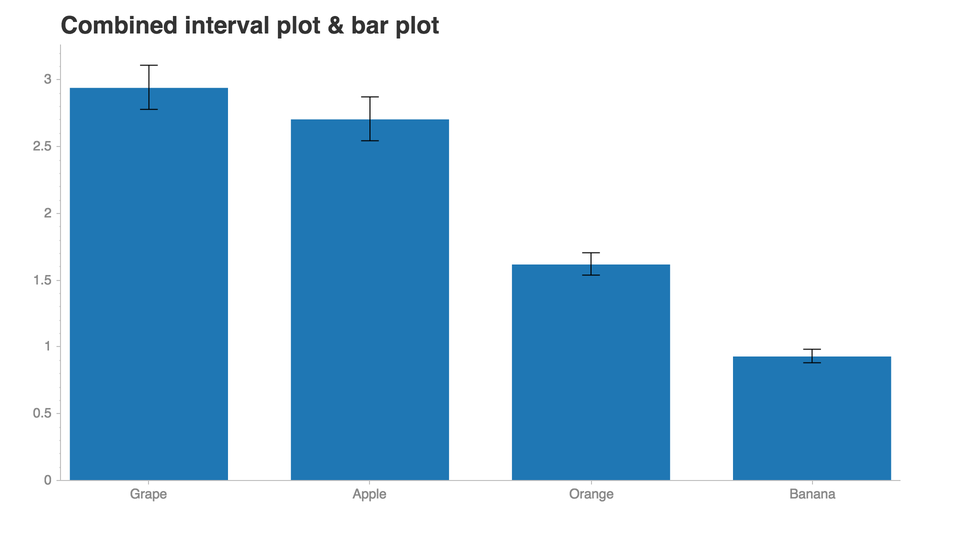
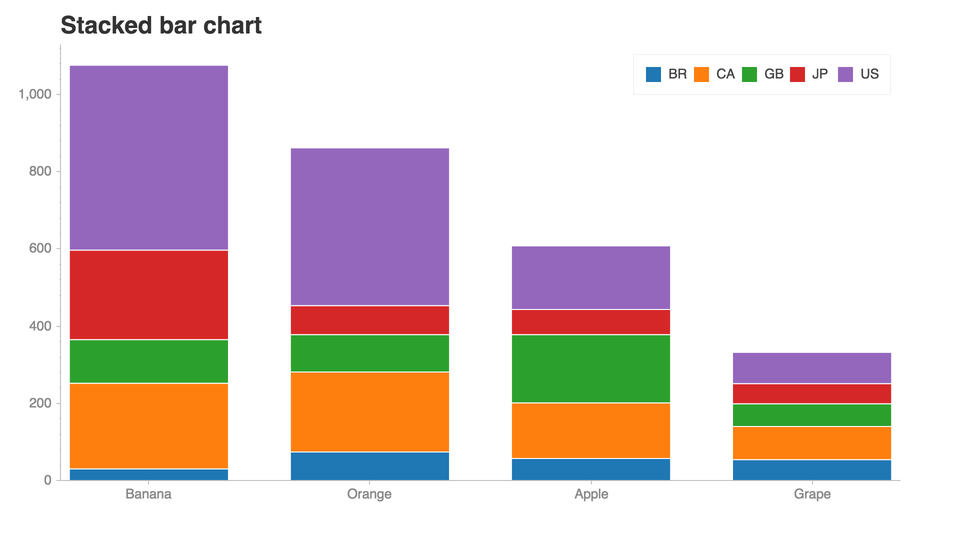
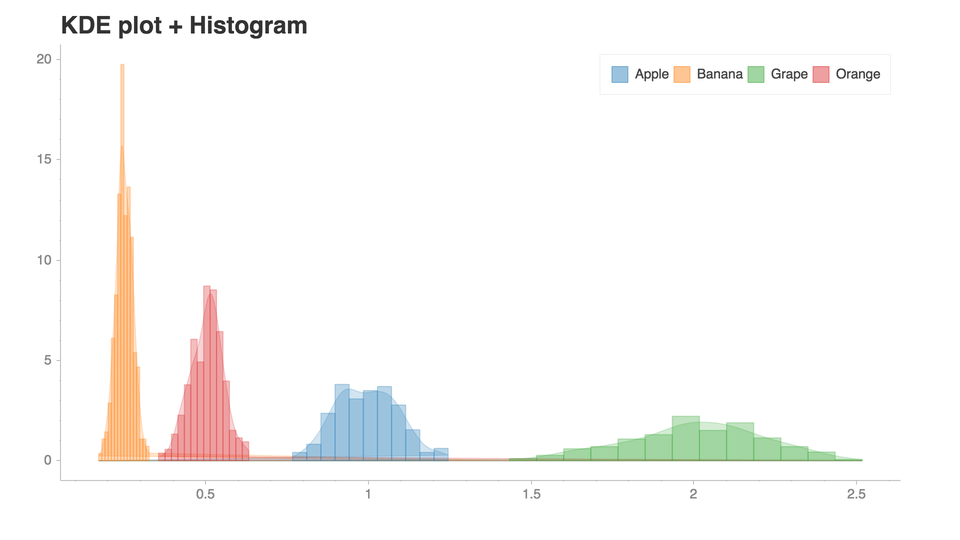
See this notebook for more examples!.
Installation
- Chartify can be installed via pip:
pip3 install chartify
- Install chromedriver requirement (Optional. Needed for PNG output):
- Install google chrome.
- Download the appropriate version of chromedriver for your OS here.
- Copy the executable file to a directory within your PATH.
- View directorys in your PATH variable:
echo $PATH - Copy chromedriver to the appropriate directory, e.g.:
cp chromedriver /usr/local/bin
Getting started
This tutorial notebook is the best place to get started with a guided tour of the core concepts of Chartify.
From there, check out the example notebook for a list of all the available plots.
Docs
Documentation available on chartify.readthedocs.io.
Getting support
Use the chartify tag on StackOverflow.
Code of Conduct
This project adheres to the Open Code of Conduct. By participating, you are expected to honor this code.
Contributing
관련 프로젝트 살펴보기
Asabeneh/30-Days-Of-Python
30 Days of Python 프로그래밍 챌린지는 Python 프로그래밍 언어를 30일 동안 배우기 위한 단계별 가이드입니다. 이 챌린지는 100일 이상 걸릴 수 있습니다. 자신의 속도에 맞춰 진행하세요. 다음 동영상도 도움이 될 수 있습니다: https://www.youtube.com/channel/UC7PNRuno1rzYPb1xLa4yktw
78,486 스타grafana/grafana
개방적이고 조합 가능한 옵저버빌리티 및 데이터 시각화 플랫폼입니다. Prometheus, Loki, Elasticsearch, InfluxDB, Postgres 등 여러 소스의 메트릭, 로그, 트레이스를 시각화합니다.
77,790 스타redis/redis
실시간 데이터 기반 애플리케이션을 구축하는 개발자에게 Redis는 가장 선호되고, 가장 빠르며, 기능이 가장 풍부한 캐시, 데이터 구조 서버이자 문서 및 벡터 쿼리 엔진입니다.
77,332 스타apache/superset
Apache Superset는 데이터 시각화 및 데이터 탐색 플랫폼입니다.
75,455 스타