
ranaroussi/quantstats
ranaroussi/quantstats has 7,837 GitHub stars and 1,284 forks. GitHot measured +18 stars in 24 hours and +60 in 7 days. Last checked 2026-11-09 07:43 UTC. Last push 2026-11-02.
Portfolio analytics for quants, written in Python
측정된 스타 증가
- in 24h
- +18
- in 7 days
- +60
- in 15 days
- 기록 수집 중
- in 1 month
- 기록 수집 중
서로 겹치는 기간의 순증가량이며 일별 합계가 아닙니다. 측정값이 없으면 비워 둡니다. 스타는 관심도를 나타내며 품질을 보장하지 않습니다.
README.md
Original


QuantStats: Portfolio analytics for quants
QuantStats Python library that performs portfolio profiling, allowing quants and portfolio managers to understand their performance better by providing them with in-depth analytics and risk metrics.
QuantStats is comprised of 3 main modules:
quantstats.stats- for calculating various performance metrics, like Sharpe ratio, Win rate, Volatility, etc.quantstats.plots- for visualizing performance, drawdowns, rolling statistics, monthly returns, etc.quantstats.reports- for generating metrics reports, batch plotting, and creating tear sheets that can be saved as an HTML file.
NEW! Monte Carlo Simulations
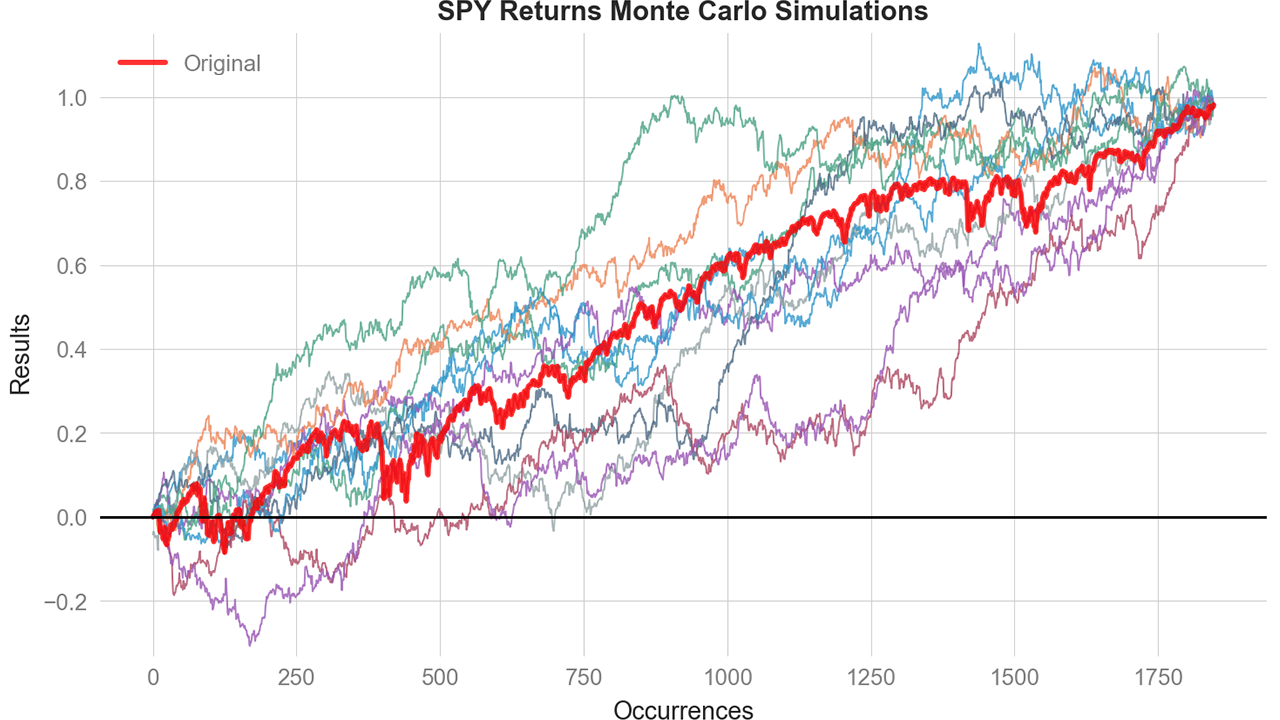
Run probabilistic risk analysis with built-in Monte Carlo simulations:
mc = qs.stats.montecarlo(returns, sims=1000, bust=-0.20, goal=0.50)
print(f"Bust probability: {mc.bust_probability:.1%}")
print(f"Goal probability: {mc.goal_probability:.1%}")
mc.plot()
Full Monte Carlo documentation »
Quick Start
%matplotlib inline
import quantstats as qs

# extend pandas functionality with metrics, etc.
qs.extend_pandas()

# fetch the daily returns for a stock
stock = qs.utils.download_returns('META')

# show sharpe ratio
qs.stats.sharpe(stock)

# or using extend_pandas() :)
stock.sharpe()
Output:
0.7604779884378278
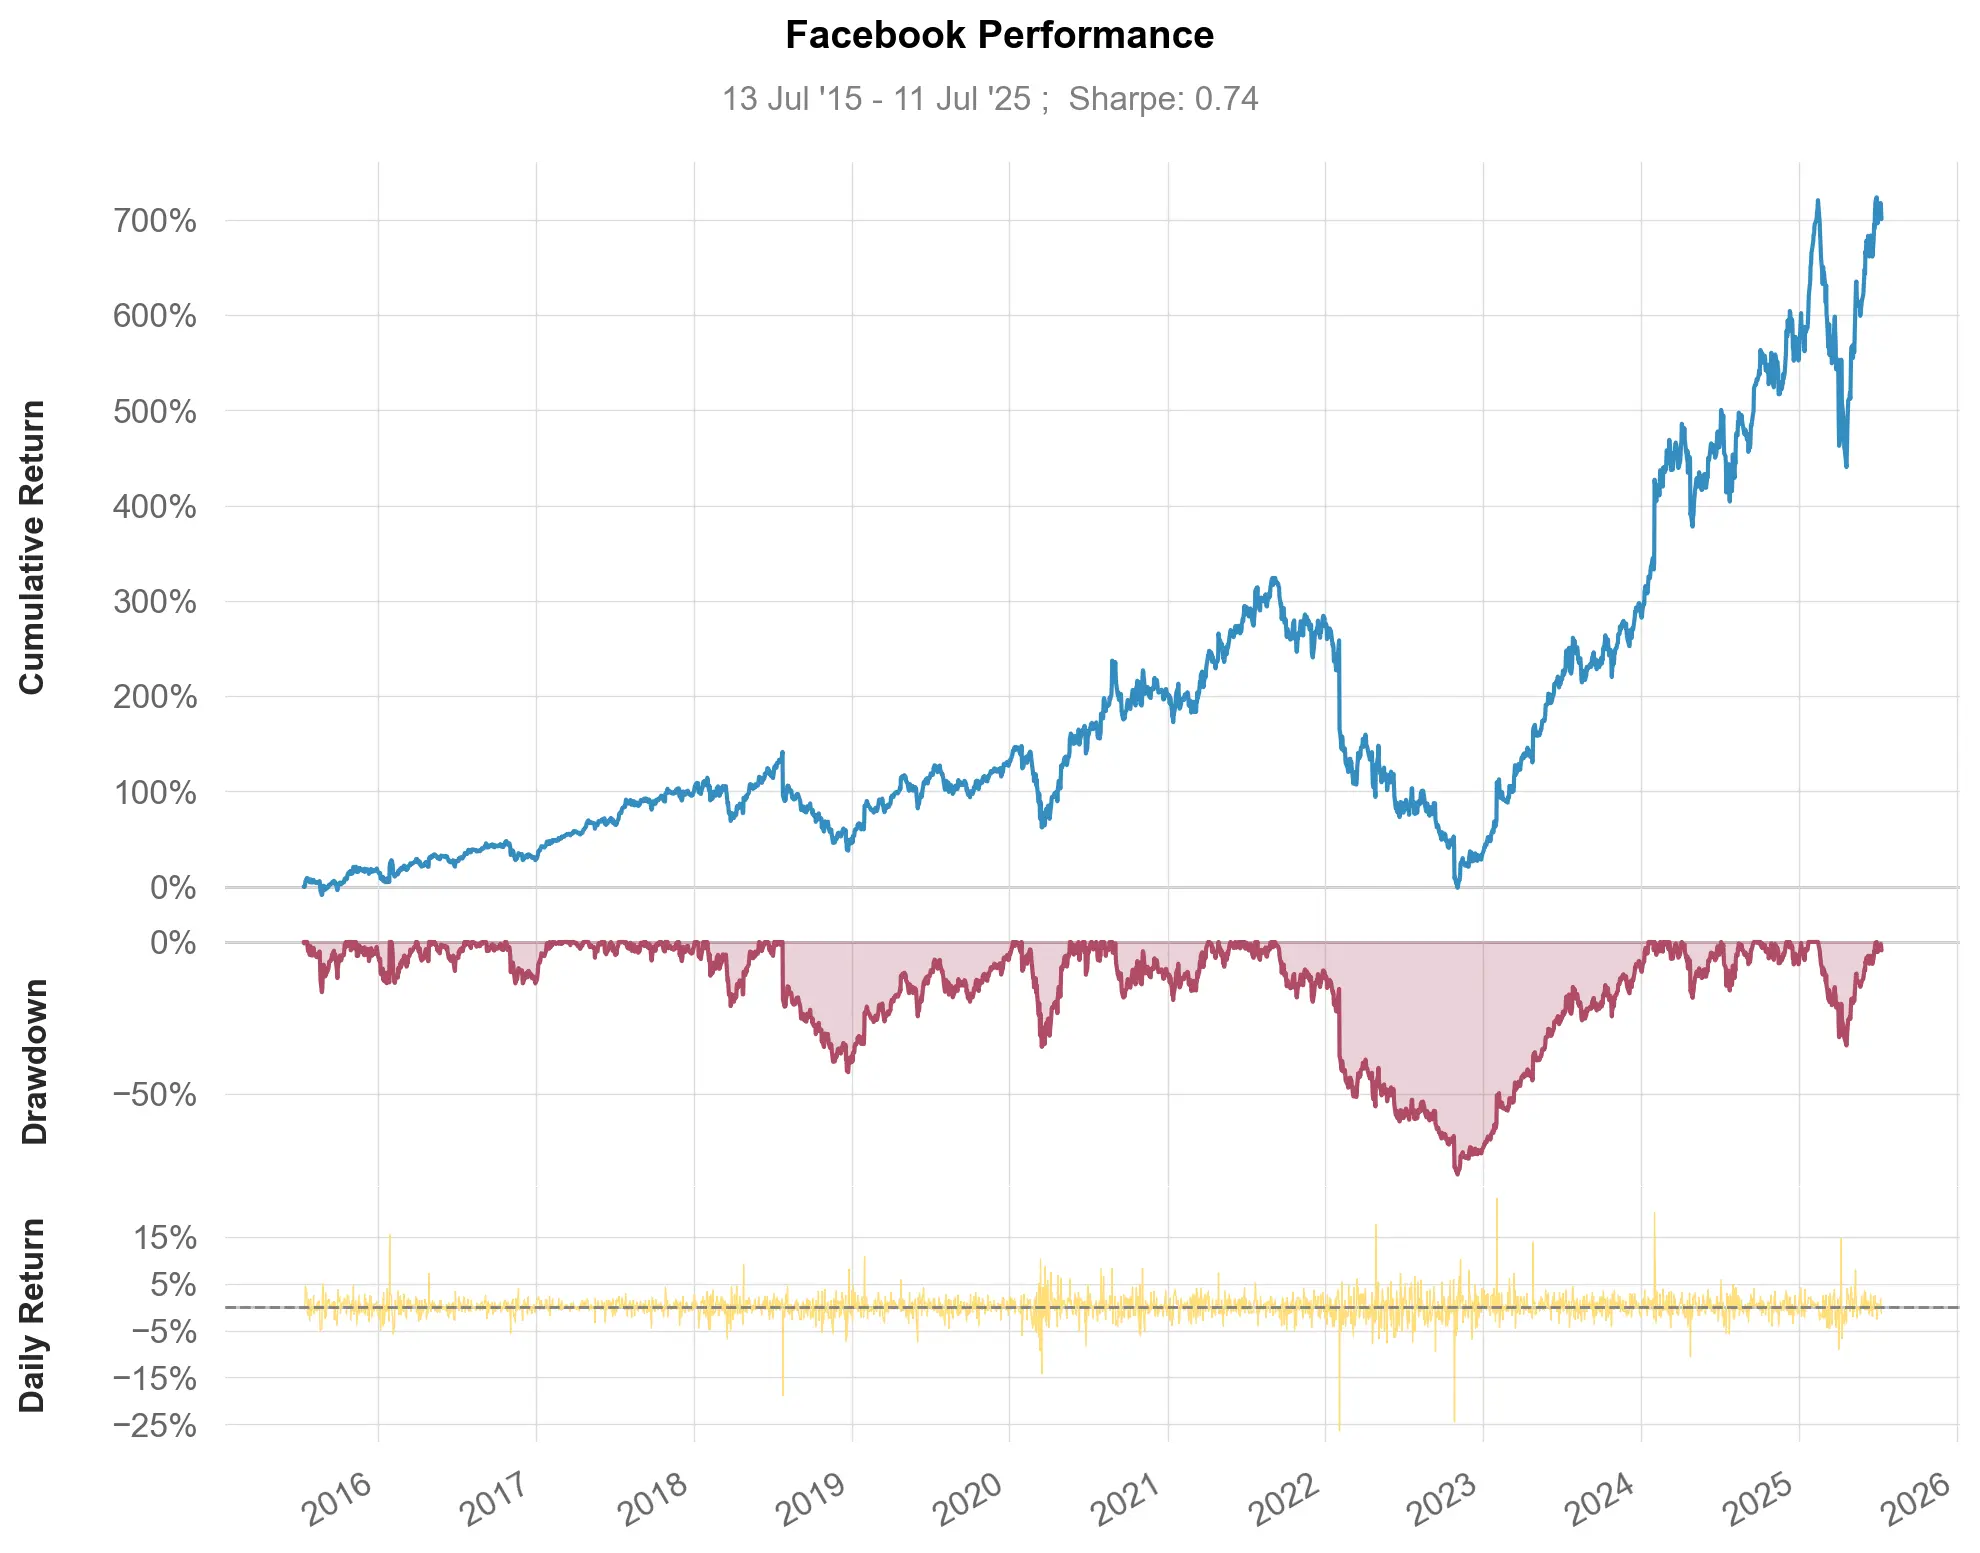
Visualize stock performance
qs.plots.snapshot(stock, title='Facebook Performance', show=True)

# can also be called via:
# stock.plot_snapshot(title='Facebook Performance', show=True)
Output:
Creating a report
You can create 7 different report tearsheets:
qs.reports.metrics(mode='basic|full", ...)- shows basic/full metricsqs.reports.plots(mode='basic|full", ...)- shows basic/full plotsqs.reports.basic(...)- shows basic metrics and plotsqs.reports.full(...)- shows full metrics and plotsqs.reports.html(...)- generates a complete report as html
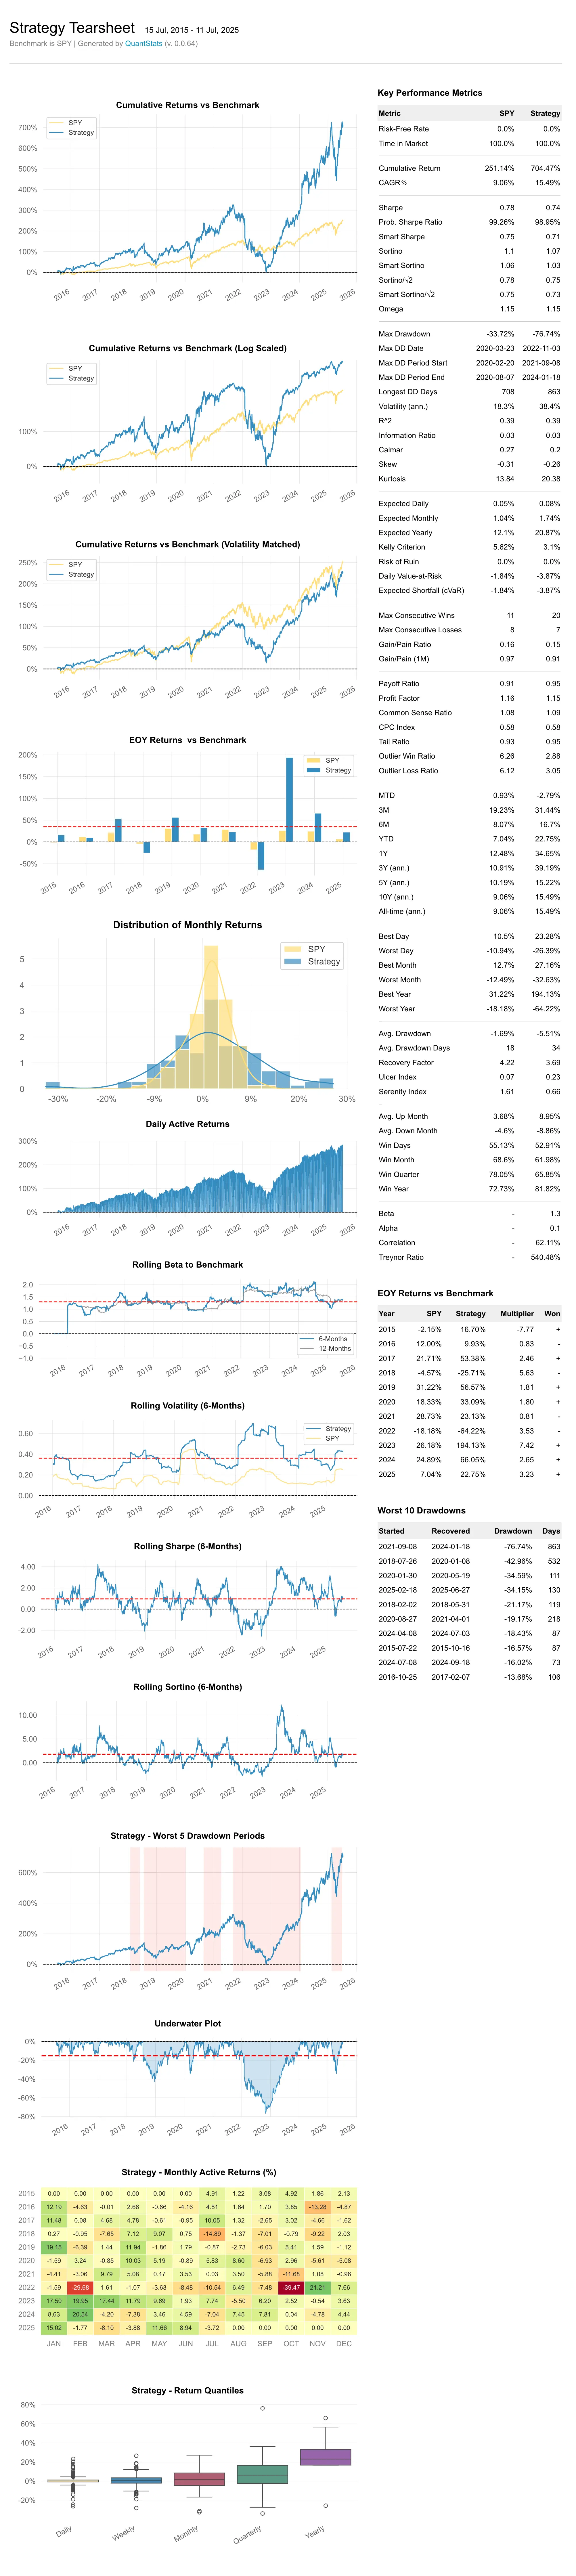
Let's create an html tearsheet:
# benchmark can be a pandas Series or ticker
qs.reports.html(stock, "SPY")
Output will generate something like this:
Available methods
To view a complete list of available methods, run:
[f for f in dir(qs.stats) if f[0] != '_']
['avg_loss',
 'avg_return',
 'avg_win',
 'best',
 'cagr',
 'calmar',
 'common_sense_ratio',
 'comp',
 'compare',
 'compsum',
 'conditional_value_at_risk',
 'consecutive_losses',
 'consecutive_wins',
 'cpc_index',
 'cvar',
 'drawdown_details',
 'expected_return',
 'expected_shortfall',
 'exposure',
 'gain_to_pain_ratio',
 'geometric_mean',
 'ghpr',
 'greeks',
 'implied_volatility',
 'information_ratio',
 'kelly_criterion',
 'kurtosis',
 'max_drawdown',
 'monthly_returns',
 'montecarlo',
 'montecarlo_cagr',
 'montecarlo_drawdown',
 'montecarlo_sharpe',
 'outlier_loss_ratio',
 'outlier_win_ratio',
 'outliers',
 'payoff_ratio',
 'profit_factor',
 'profit_ratio',
 'r2',
 'r_squared',
 'rar',
 'recovery_factor',
 'remove_outliers',
 'risk_of_ruin',
 'risk_return_ratio',
 'rolling_greeks',
 'ror',
 'sharpe',
 'skew',
 'sortino',
 'adjusted_sortino',
 'tail_ratio',
 'to_drawdown_series',
 'ulcer_index',
 'ulcer_performance_index',
 'upi',
 'value_at_risk',
 'var',
 'volatility',
 'win_loss_ratio',
 'win_rate',
 'worst']
[f for f in dir(qs.plots) if f[0] != '_']
['daily_returns',
 'distribution',
 'drawdown',
 'drawdowns_periods',
 'earnings',
 'histogram',
 'log_returns',
 'monthly_heatmap',
 'montecarlo',
 'montecarlo_distribution',
 'returns',
 'rolling_beta',
 'rolling_sharpe',
 'rolling_sortino',
 'rolling_volatility',
 'snapshot',
 'yearly_returns']
*** Full documentation coming soon ***
Important: Period-Based vs Trade-Based Metrics
QuantStats analyzes return series (daily, weekly, monthly returns), not discrete trade data. This means:
- Win Rate = percentage of periods with positive returns
- Consecutive Wins/Losses = consecutive positive/negative return periods
- Payoff Ratio = average winning period return / average losing period return
- Profit Factor = sum of positive returns / sum of negative returns
These metrics are valid and useful for:
- Systematic/algorithmic strategies with regular rebalancing
- Analyzing return-series behavior over time
- Comparing strategies on a period-by-period basis
For discretionary traders with multi-day trades, these period-based metrics may differ from trade-level statistics. A single 5-day trade might span 3 positive days and 2 negative days - QuantStats would count these as 3 "wins" and 2 "losses" at the daily level.
This is consistent with how all return-based analytics work (Sharpe ratio, Sortino ratio, drawdown analysis, etc.) - they operate on return periods, not discrete trade entries/exits.
In the meantime, you can get insights as to optional parameters for each method, by using Python's help method:
help(qs.stats.conditional_value_at_risk)
Help on function conditional_value_at_risk in module quantstats.stats:

conditional_value_at_risk(returns, sigma=1, confidence=0.95, prepare_returns=True, method='parametric')
    Calculate the Conditional Value at Risk (CVaR), also known as Expected Shortfall.

    CVaR measures the expected loss given that a loss exceeds the VaR threshold.
    It quantifies the amount of tail risk an investment faces, providing a more
    comprehensive risk measure than VaR alone.
Installation
Install using pip:
$ pip install quantstats --upgrade --no-cache-dir
Install using conda:
$ conda install -c ranaroussi quantstats
Requirements
- Python >= 3.10
- pandas >= 1.5.0
- numpy >= 1.24.0
- scipy >= 1.11.0
- matplotlib >= 3.7.0
- seaborn >= 0.13.0
- tabulate >= 0.9.0
- yfinance >= 0.2.40
- plotly >= 5.0.0 (optional, for using
plots.to_plotly())
Questions?
This is a new library... If you find a bug, please open an issue.
If you'd like to contribute, a great place to look is the issues marked with help-wanted.
Known Issues
For some reason, I couldn't find a way to tell seaborn not to return the
monthly returns heatmap when instructed to save - so even if you save the plot (by passing savefig={...}) it will still show the plot.
Legal Stuff
QuantStats is distributed under the Apache Software License. See the LICENSE.txt file in the release for details.
P.S.
Please drop me a note with any feedback you have.
Ran Aroussi
관련 프로젝트 살펴보기
Asabeneh/30-Days-Of-Python
30 Days of Python 프로그래밍 챌린지는 Python 프로그래밍 언어를 30일 동안 배우기 위한 단계별 가이드입니다. 이 챌린지는 100일 이상 걸릴 수 있습니다. 자신의 속도에 맞춰 진행하세요. 다음 동영상도 도움이 될 수 있습니다: https://www.youtube.com/channel/UC7PNRuno1rzYPb1xLa4yktw
78,423 스타grafana/grafana
개방적이고 조합 가능한 옵저버빌리티 및 데이터 시각화 플랫폼입니다. Prometheus, Loki, Elasticsearch, InfluxDB, Postgres 등 여러 소스의 메트릭, 로그, 트레이스를 시각화합니다.
77,763 스타redis/redis
실시간 데이터 기반 애플리케이션을 구축하는 개발자에게 Redis는 가장 선호되고, 가장 빠르며, 기능이 가장 풍부한 캐시, 데이터 구조 서버이자 문서 및 벡터 쿼리 엔진입니다.
77,309 스타apache/superset
Apache Superset는 데이터 시각화 및 데이터 탐색 플랫폼입니다.
75,453 스타