
qax-os/excelize
qax-os/excelize has 21,122 GitHub stars and 1,996 forks. GitHot measured +9 stars in 24 hours and +87 in 7 days. Last checked 2026-11-09 11:43 UTC. Last push 2026-11-02.
Microsoft Excel™(XLAM / XLSM / XLSX / XLTM / XLTX) 스프레드시트를 읽고 쓸 수 있는 Go 언어 라이브러리
측정된 스타 증가
- in 24h
- +9
- in 7 days
- +87
- in 15 days
- 기록 수집 중
- in 1 month
- 기록 수집 중
서로 겹치는 기간의 순증가량이며 일별 합계가 아닙니다. 측정값이 없으면 비워 둡니다. 스타는 관심도를 나타내며 품질을 보장하지 않습니다.
README.md
Original





Excelize
Introduction
Excelize is a library written in pure Go providing a set of functions that allow you to write to and read from XLAM / XLSM / XLSX / XLTM / XLTX files. Supports reading and writing spreadsheet documents generated by Microsoft Excel™ 2007 and later. Supports complex components by high compatibility, and provided streaming API for generating or reading data from a worksheet with huge amounts of data. This library needs Go version 1.26.0 or later. The full docs can be seen using go's built-in documentation tool, or online at go.dev and docs reference.
Basic Usage
Installation
go get github.com/xuri/excelize
- If your packages are managed using Go Modules, please install with following command.
go get github.com/xuri/excelize/v2
Create spreadsheet
Here is a minimal example usage that will create spreadsheet file.
package main

import (
    "fmt"

    "github.com/xuri/excelize/v2"
)

func main() {
    f := excelize.NewFile()
    defer func() {
        if err := f.Close(); err != nil {
            fmt.Println(err)
        }
    }()
    // Create a new sheet.
    index, err := f.NewSheet("Sheet2")
    if err != nil {
        fmt.Println(err)
        return
    }
    // Set value of a cell.
    f.SetCellValue("Sheet2", "A2", "Hello world.")
    f.SetCellValue("Sheet1", "B2", 100)
    // Set active sheet of the workbook.
    f.SetActiveSheet(index)
    // Save spreadsheet by the given path.
    if err := f.SaveAs("Book1.xlsx"); err != nil {
        fmt.Println(err)
    }
}
Reading spreadsheet
The following constitutes the bare to read a spreadsheet document.
package main

import (
    "fmt"

    "github.com/xuri/excelize/v2"
)

func main() {
    f, err := excelize.OpenFile("Book1.xlsx")
    if err != nil {
        fmt.Println(err)
        return
    }
    defer func() {
        // Close the spreadsheet.
        if err := f.Close(); err != nil {
            fmt.Println(err)
        }
    }()
    // Get value from cell by given worksheet name and cell reference.
    cell, err := f.GetCellValue("Sheet1", "B2")
    if err != nil {
        fmt.Println(err)
        return
    }
    fmt.Println(cell)
    // Get all the rows in the Sheet1.
    rows, err := f.GetRows("Sheet1")
    if err != nil {
        fmt.Println(err)
        return
    }
    for _, row := range rows {
        for _, colCell := range row {
            fmt.Print(colCell, "\t")
        }
        fmt.Println()
    }
}
Add chart to spreadsheet file
With Excelize chart generation and management is as easy as a few lines of code. You can build charts based on data in your worksheet or generate charts without any data in your worksheet at all.
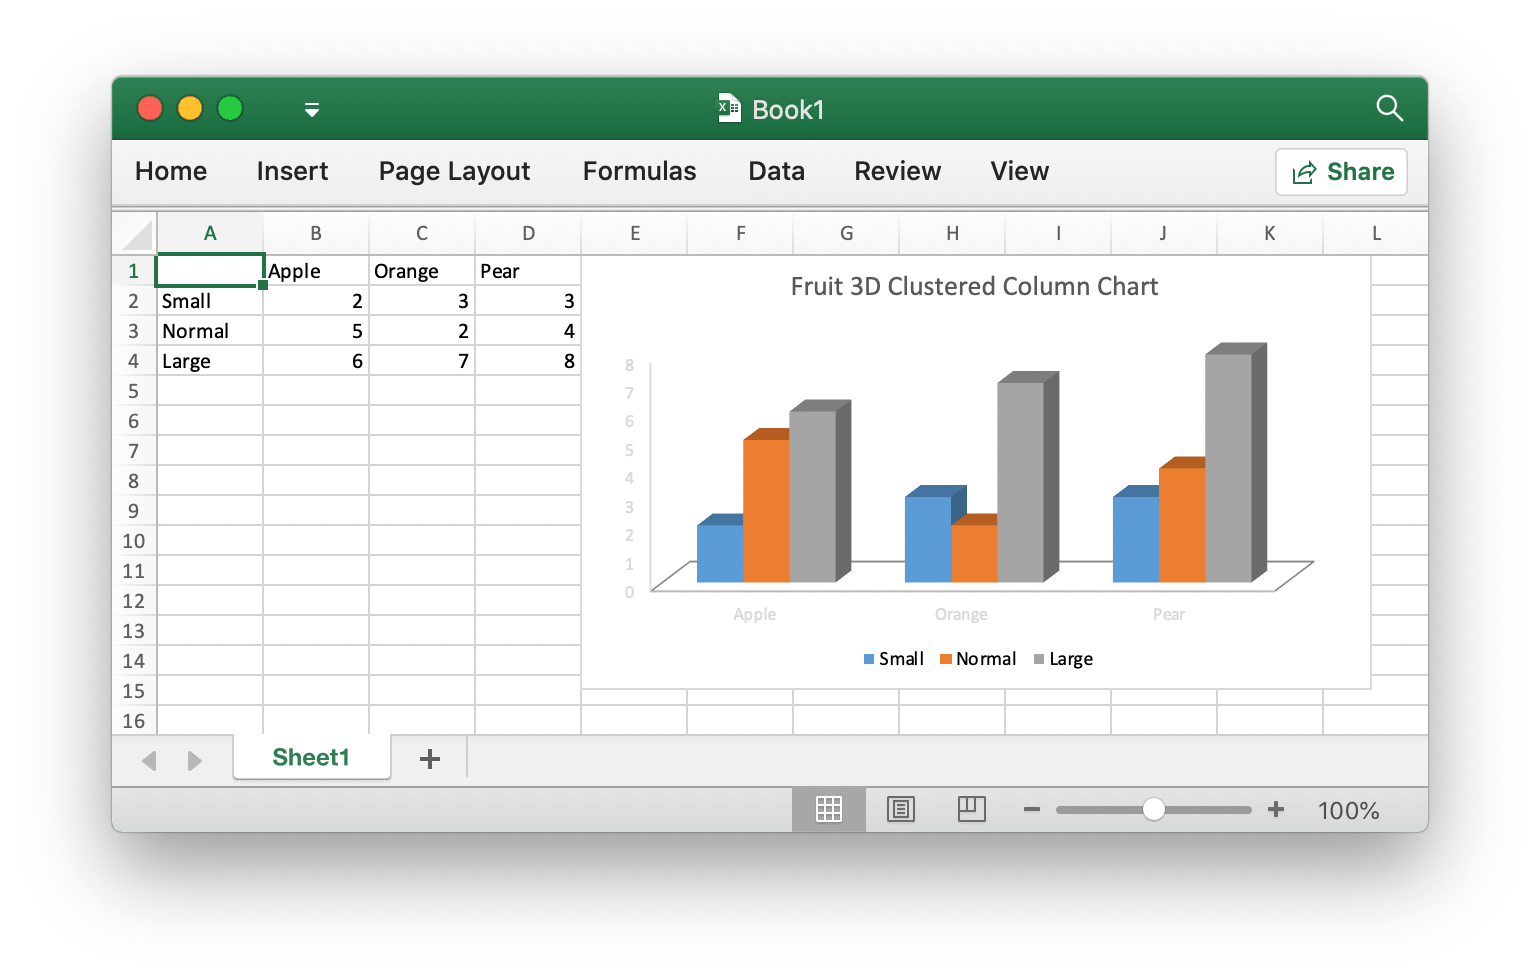
package main

import (
    "fmt"

    "github.com/xuri/excelize/v2"
)

func main() {
    f := excelize.NewFile()
    defer func() {
        if err := f.Close(); err != nil {
            fmt.Println(err)
        }
    }()
    for idx, row := range [][]interface{}{
        {nil, "Apple", "Orange", "Pear"}, {"Small", 2, 3, 3},
        {"Normal", 5, 2, 4}, {"Large", 6, 7, 8},
    } {
        cell, err := excelize.CoordinatesToCellName(1, idx+1)
        if err != nil {
            fmt.Println(err)
            return
        }
        f.SetSheetRow("Sheet1", cell, &row)
    }
    if err := f.AddChart("Sheet1", "E1", &excelize.Chart{
        Type: excelize.Col3DClustered,
        Series: []excelize.ChartSeries{
            {
                Name:       "Sheet1!$A$2",
                Categories: "Sheet1!$B$1:$D$1",
                Values:     "Sheet1!$B$2:$D$2",
            },
            {
                Name:       "Sheet1!$A$3",
                Categories: "Sheet1!$B$1:$D$1",
                Values:     "Sheet1!$B$3:$D$3",
            },
            {
                Name:       "Sheet1!$A$4",
                Categories: "Sheet1!$B$1:$D$1",
                Values:     "Sheet1!$B$4:$D$4",
            }},
        Title: excelize.ChartTitle{
            Paragraph: []excelize.RichTextRun{
                {
                    Text: "Fruit 3D Clustered Column Chart",
                },
            },
        },
    }); err != nil {
        fmt.Println(err)
        return
    }
    // Save spreadsheet by the given path.
    if err := f.SaveAs("Book1.xlsx"); err != nil {
        fmt.Println(err)
    }
}
Add picture to spreadsheet file
package main

import (
    "fmt"
    _ "image/gif"
    _ "image/jpeg"
    _ "image/png"

    "github.com/xuri/excelize/v2"
)

func main() {
    f, err := excelize.OpenFile("Book1.xlsx")
    if err != nil {
        fmt.Println(err)
        return
    }
    defer func() {
        // Close the spreadsheet.
        if err := f.Close(); err != nil {
            fmt.Println(err)
        }
    }()
    // Insert a picture.
    if err := f.AddPicture("Sheet1", "A2", "image.png", nil); err != nil {
        fmt.Println(err)
    }
    // Insert a picture to worksheet with scaling.
    if err := f.AddPicture("Sheet1", "D2", "image.jpg",
        &excelize.GraphicOptions{ScaleX: 0.5, ScaleY: 0.5}); err != nil {
        fmt.Println(err)
    }
    // Insert a picture offset in the cell with printing support.
    enable, disable := true, false
    if err := f.AddPicture("Sheet1", "H2", "image.gif",
        &excelize.GraphicOptions{
            PrintObject:     &enable,
            LockAspectRatio: false,
            OffsetX:         15,
            OffsetY:         10,
            Locked:          &disable,
        }); err != nil {
        fmt.Println(err)
    }
    // Save the spreadsheet with the origin path.
    if err = f.Save(); err != nil {
        fmt.Println(err)
    }
}
Contributing
Contributions are welcome! Open a pull request to fix a bug, or open an issue to discuss a new feature or change. XML is compliant with part 1 of the 5th edition of the ECMA-376 Standard for Office Open XML.
Licenses
This program is under the terms of the BSD 3-Clause License. See https://opensource.org/licenses/BSD-3-Clause.
The Excel logo is a trademark of Microsoft Corporation. This artwork is an adaptation.
The Go gopher was created by Renee French. Licensed under the Creative Commons 4.0 Attributions license.
Gold Sponsors

관련 프로젝트 살펴보기
Asabeneh/30-Days-Of-Python
30 Days of Python 프로그래밍 챌린지는 Python 프로그래밍 언어를 30일 동안 배우기 위한 단계별 가이드입니다. 이 챌린지는 100일 이상 걸릴 수 있습니다. 자신의 속도에 맞춰 진행하세요. 다음 동영상도 도움이 될 수 있습니다: https://www.youtube.com/channel/UC7PNRuno1rzYPb1xLa4yktw
78,423 스타grafana/grafana
개방적이고 조합 가능한 옵저버빌리티 및 데이터 시각화 플랫폼입니다. Prometheus, Loki, Elasticsearch, InfluxDB, Postgres 등 여러 소스의 메트릭, 로그, 트레이스를 시각화합니다.
77,763 스타redis/redis
실시간 데이터 기반 애플리케이션을 구축하는 개발자에게 Redis는 가장 선호되고, 가장 빠르며, 기능이 가장 풍부한 캐시, 데이터 구조 서버이자 문서 및 벡터 쿼리 엔진입니다.
77,309 스타apache/superset
Apache Superset는 데이터 시각화 및 데이터 탐색 플랫폼입니다.
75,453 스타