
nafey/minimalytics
nafey/minimalytics has 351 GitHub stars and 12 forks. GitHot measured +1 stars in 24 hours. Last checked 2026-11-10 22:18 UTC. Last push 2026-01-03.
Standalone analytics app in a CLI
What you can do
- Track Events: Record and monitor analytics for various events.
- Web UI: Manage dashboards and visualize event data with interactive graphs.
- Scalable: Supports over a billion events per month with a minimal storage footprint (~20 MB).
- Lightweight: Built with efficiency in mind, ensuring low memory and storage usage.
측정된 스타 증가
- in 24h
- +1
- in 7 days
- 업데이트 지연
- in 15 days
- 업데이트 지연
- in 1 month
- 업데이트 지연
서로 겹치는 기간의 순증가량이며 일별 합계가 아닙니다. 측정값이 없으면 비워 둡니다. 스타는 관심도를 나타내며 품질을 보장하지 않습니다.
README.md
OriginalMinimalytics

Minimalytics is a standalone minimalist analytics tool built on SQLite. Designed for resource-constrained environments, it provides a lightweight solution for tracking and visualizing event data with a minimal footprint. Whether you're tracking internal services or need a simple analytics tool, Minimalytics delivers performance without the bloat.
Features
- Track Events: Record and monitor analytics for various events.
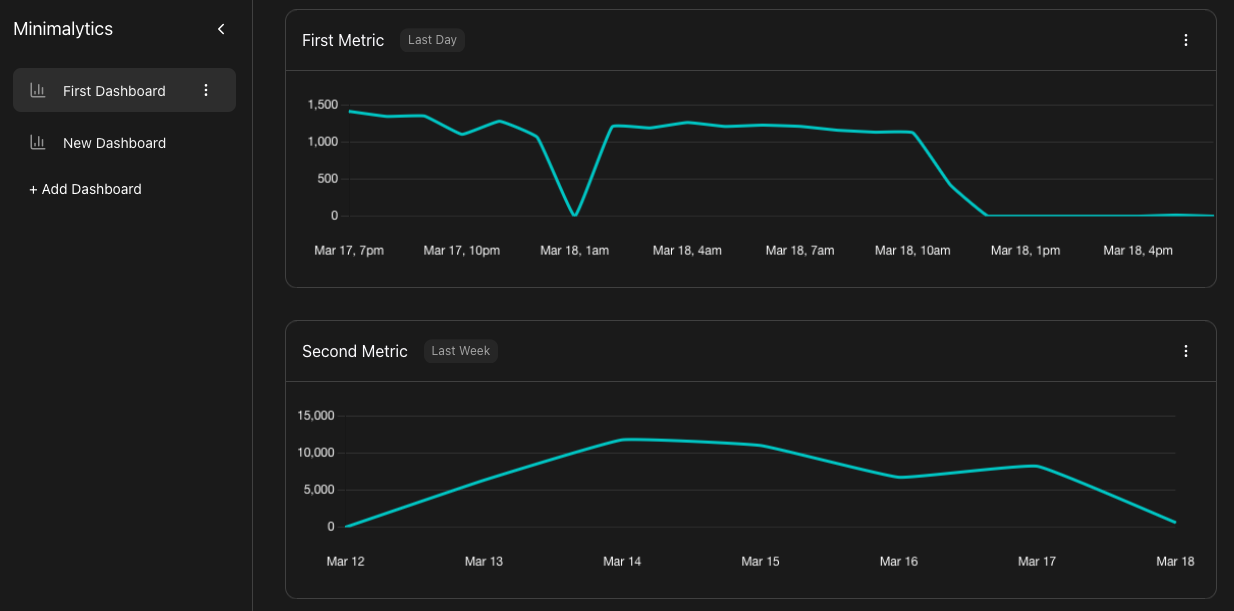
- Web UI: Manage dashboards and visualize event data with interactive graphs.
- Scalable: Supports over a billion events per month with a minimal storage footprint (~20 MB).
- Lightweight: Built with efficiency in mind, ensuring low memory and storage usage.
Installation
Linux and macOS
Clone the repository:
git clone https://github.com/nafey/minimalytics.git
cd minimalytics
Build the project:
go build -o build/minim .Install the binary system-wide:
sudo mv build/minim /usr/local/bin/
Docker
Build the image:
docker build -t minimalytics .Run the container:
docker run -p 3333:3333 -v minim-data:/root/.minim minimalyticsThe volume mount persists the SQLite database across container restarts.
Usage
Starting the Server
Check if the server is running:
minim statusStart the server:
minim server start
Recording Events
To record an event, send a POST request to the event API:
curl -X POST http://localhost:3333/api/event/ -H "Content-Type: application/json" -d '{"event": "<EVENT_NAME>"}'
Replace <EVENT_NAME> with the name of the event you want to track.
Accessing the Web Dashboard
Open your browser and navigate to:
http://localhost:3333/Go to "First Dashboard" and click "Add Graph".
Select the appropriate properties and click "Done".
Your dashboard is now ready to display event data.
Disabling Web Access
To disable access to the web dashboard, run:
minim web disable
Why Minimalytics?
This project was born out of the need for a lightweight analytics tool to track internal services on a resource-constrained VPS. Most SaaS analytics products either lack the scalability or exceed their free tier limits when tracking millions of events per month. Minimalytics addresses this gap by offering a minimalist, high-performance solution for resource-constrained environments.
How It Works
- Event Aggregation: Minimalytics saves space by aggregating events, storing only aggregate features (e.g., total invocations per day) instead of individual events.
- SQLite Storage: Event data is stored in an SQLite file, initialized during the first run of
minim. - Server Hosting: The
minimCLI starts a server that:- Hosts the API endpoint for event submission.
- Serves the web UI (built using minimui and placed in the
staticfolder).
- Web UI: Source for the Web UI is available at minimui.
Future Features
- Support for sum, avg, min, and max on event values.
- Improved UI/UX.
- Multiple metrics in the same graph.
- Additional visualizations: Bar Chart, Pie Chart, etc.
- User ID-based analytics: Funnels, cohorts, and more.
Unsupported Features
- Details on individual events.
- Hourly event resolution beyond 48 hours.
- Minute resolution beyond 60 minutes.
Contributing
Contributions are welcome! If you'd like to contribute, please:
- Fork the repository.
- Create a new branch for your feature or bugfix.
- Submit a pull request.
License
Minimalytics is licensed under the MIT License.
Enjoy using Minimalytics! For questions or feedback, feel free to open an issue on GitHub.
관련 프로젝트 살펴보기
Asabeneh/30-Days-Of-Python
30 Days of Python 프로그래밍 챌린지는 Python 프로그래밍 언어를 30일 동안 배우기 위한 단계별 가이드입니다. 이 챌린지는 100일 이상 걸릴 수 있습니다. 자신의 속도에 맞춰 진행하세요. 다음 동영상도 도움이 될 수 있습니다: https://www.youtube.com/channel/UC7PNRuno1rzYPb1xLa4yktw
78,560 스타grafana/grafana
개방적이고 조합 가능한 옵저버빌리티 및 데이터 시각화 플랫폼입니다. Prometheus, Loki, Elasticsearch, InfluxDB, Postgres 등 여러 소스의 메트릭, 로그, 트레이스를 시각화합니다.
77,830 스타redis/redis
실시간 데이터 기반 애플리케이션을 구축하는 개발자에게 Redis는 가장 선호되고, 가장 빠르며, 기능이 가장 풍부한 캐시, 데이터 구조 서버이자 문서 및 벡터 쿼리 엔진입니다.
77,395 스타apache/superset
Apache Superset는 데이터 시각화 및 데이터 탐색 플랫폼입니다.
75,473 스타