
jbehley/point_labeler
jbehley/point_labeler has 751 GitHub stars and 166 forks. GitHot measured 0 stars in 24 hours. Last checked 2026-11-19 06:24 UTC. Last push 2025-03-19.
What you can do
- Support for KITTI Vision Benchmark Point Clouds.
- Human-readable label description files in xml allow to define label names, ids, and colors.
- Modern OpenGL shaders for rendering of even millions of points.
- Tools for labeling of individual points and polygons.
측정된 스타 증가
- in 24h
- 0
- in 7 days
- 기록 수집 중
- in 15 days
- 기록 수집 중
- in 1 month
- 기록 수집 중
서로 겹치는 기간의 순증가량이며 일별 합계가 아닙니다. 측정값이 없으면 비워 둡니다. 스타는 관심도를 나타내며 품질을 보장하지 않습니다.
소개
My awesome point cloud labeling tool
학습README.md
OriginalPoint Cloud Labeling Tool
Tool for labeling of a single point clouds or a stream of point clouds.
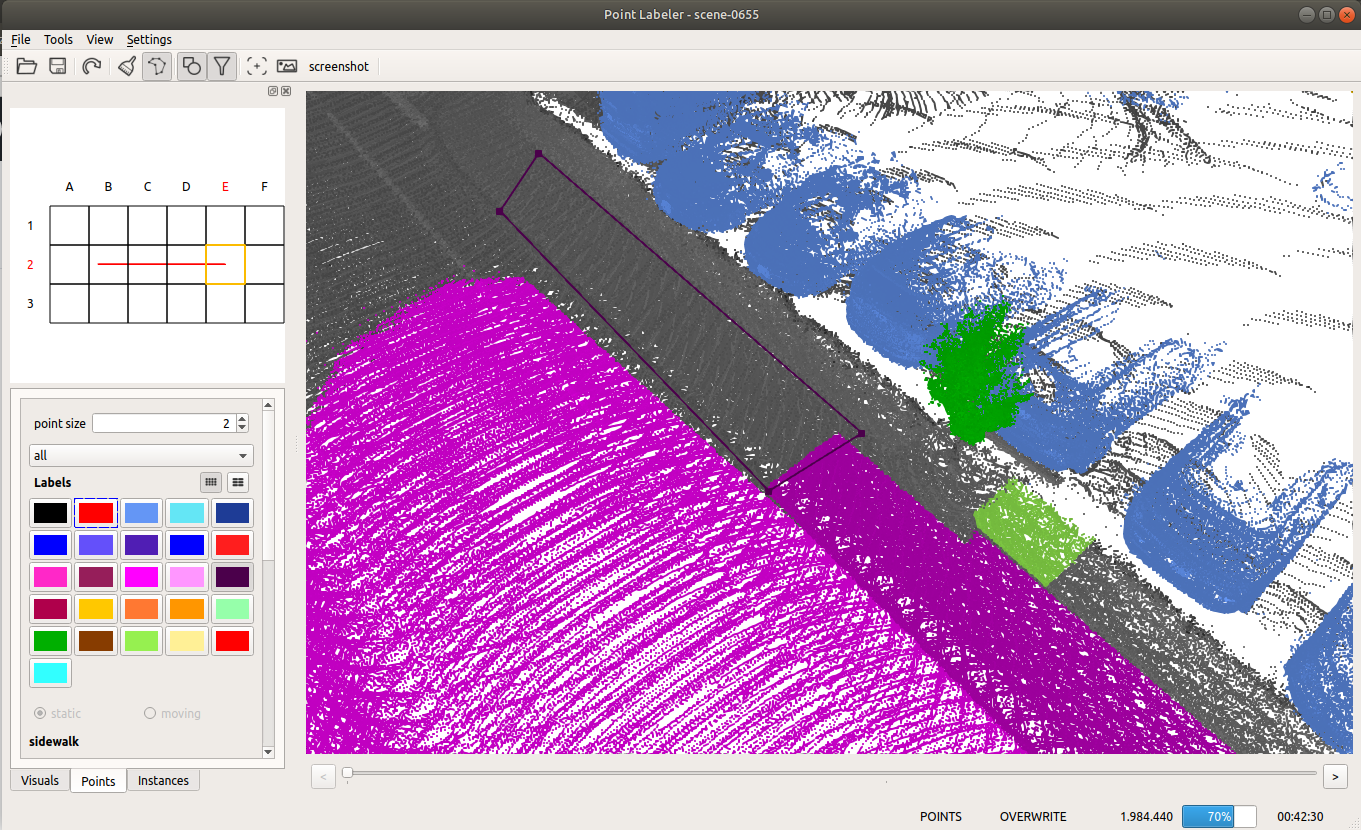
Given the poses of a KITTI point cloud dataset, we load tiles of overlapping point clouds. Thus, multiple point clouds are labeled at once in a certain area.
Features
- Support for KITTI Vision Benchmark Point Clouds.
- Human-readable label description files in xml allow to define label names, ids, and colors.
- Modern OpenGL shaders for rendering of even millions of points.
- Tools for labeling of individual points and polygons.
- Filtering of labels makes it easy to label even complicated structures with ease.
Dependencies
- Eigen >= 3.2
- boost >= 1.54
- QT >= 5.2
- OpenGL Core Profile >= 4.0
Build
On Ubuntu 22.04/20.04, the dependencies can be installed from the package manager:
sudo apt install cmake g++ git libeigen3-dev libboost-all-dev qtbase5-dev libglew-dev
Then, build the project, change to the cloned directory and use the following commands:
cmake -S . -B build
cmake --build build
Alternatively, you can also use the "classical" cmake build procedure:
mkdir build && cd build
cmake ..
make -j5
Now the project root directory (e.g. ~/point_labeler) should contain a bin directory containing the labeler.
Usage
In the bin directory, just run ./labeler to start the labeling tool.
The labeling tool allows to label a sequence of point clouds in a tile-based fashion, i.e., the tool loads all scans overlapping with the current tile location. Thus, you will always label the part of the scans that overlaps with the current tile.
In the settings.cfg files you can change the following options:
tile size: 100.0   # size of a tile (the smaller the less scans get loaded.)
max scans: 500    # number of scans to load for a tile. (should be maybe 1000), but this is currently very memory-consuming.
min range: 0.0    # minimum distance of points to consider.
max range: 50.0   # maximum distance of points in the point cloud.
add car points: true # add points at the origin of the sensor possibly caused by the car itself. Default: false.
Folder structure
When loading a dataset, the data must be organized as follows:
point cloud folder
├── velodyne/             -- directory containing ".bin" files with Velodyne point clouds.
├── labels/   [optional]  -- label directory, will be generated if not present.
├── image_2/  [optional]  -- directory containing ".png" files from the color   camera.
├── calib.txt             -- calibration of velodyne vs. camera. needed for projection of point cloud into camera.
└── poses.txt             -- file containing the poses of every scan.
Documentation
See the wiki for more information on the usage and other details.
Citation
If you're using the tool in your research, it would be nice if you cite our paper:
@inproceedings{behley2019iccv,
    author = {J. Behley and M. Garbade and A. Milioto and J. Quenzel and S. Behnke and C. Stachniss and J. Gall},
     title = {{SemanticKITTI: A Dataset for Semantic Scene Understanding of LiDAR Sequences}},
 booktitle = {Proc. of the IEEE/CVF International Conf.~on Computer Vision (ICCV)},
      year = {2019}
}
We used the tool to label SemanticKITTI, which contains overall over 40.000 scans organized in 20 sequences.