
inukshuk/sqleton
inukshuk/sqleton has 120 GitHub stars and 12 forks. Star changes are not measured yet. Last checked 2026-11-14 11:46 UTC. Last push 2026-11-10.
측정된 스타 증가
- in 24h
- 기록 수집 중
- in 7 days
- 기록 수집 중
- in 15 days
- 기록 수집 중
- in 1 month
- 기록 수집 중
서로 겹치는 기간의 순증가량이며 일별 합계가 아닙니다. 측정값이 없으면 비워 둡니다. 스타는 관심도를 나타내며 품질을 보장하지 않습니다.
소개
Visualize your SQLite database schema
데이터README.md
Originalsqleton ['skelɪtən]
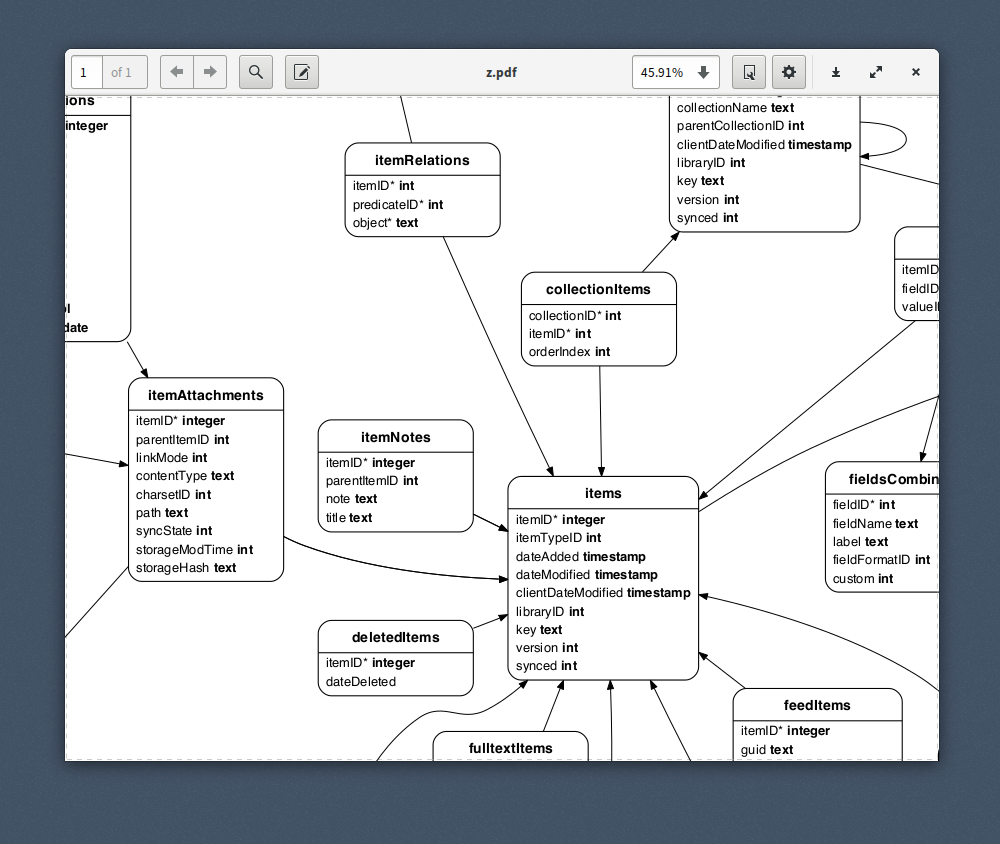
Visualizes your SQLite database schema.
Installation
$ npm install -g sqleton
You need to install graphviz separately:
$ [pacman -Sy | apt-get install | brew install] graphviz
Example
$ sqleton -o db.svg db.sqlite
The format will be inferred from the name of the output file; you
can use any format supported by graphviz (png, pdf, svg, and many more).
Usage
Usage: sqleton [options] <db-file>

Options:
  -h, --help        Print this help text and exit
  -v, --version     Print program version and exit
  -L, --layout      The layout command, one of:
                      "neato", "dot", "circo",
                      "fdp" (default),
                      "osage", "sfdp", "twopi"

  -e, --edge-labels  Label foreign key edges
  -t, --title        Optional title string
  -f, --font         The font to use, by default "Helvetica"
  -d, --direction    Graph direction, "TB" or "LR" (default)
  -o, --out          Output file (determines output format)
                     if not given DOT will be printed to stdout

      --skip-index   Skip writing table indexes
Fine-Tuning
To fine-tune your graph, the best option is to use .dot as your output
format and adjust the parameters in the file.
Node.js
const sqleton = require('sqleton')

// Open your database and writable stream
// ....

sqleton(db, stream, options)
  .then(() => { db.close() })
  .then(() => { stream.end() })
What about PostgreSQL or other databases?
sqleton was written to visualize SQLite schemata. Having said that,
you can try to dump your schema and create a new SQLite database for
visualisation from it.
관련 프로젝트 살펴보기
Asabeneh/30-Days-Of-Python
30 Days of Python 프로그래밍 챌린지는 Python 프로그래밍 언어를 30일 동안 배우기 위한 단계별 가이드입니다. 이 챌린지는 100일 이상 걸릴 수 있습니다. 자신의 속도에 맞춰 진행하세요. 다음 동영상도 도움이 될 수 있습니다: https://www.youtube.com/channel/UC7PNRuno1rzYPb1xLa4yktw
78,725 스타grafana/grafana
개방적이고 조합 가능한 옵저버빌리티 및 데이터 시각화 플랫폼입니다. Prometheus, Loki, Elasticsearch, InfluxDB, Postgres 등 여러 소스의 메트릭, 로그, 트레이스를 시각화합니다.
77,897 스타redis/redis
실시간 데이터 기반 애플리케이션을 구축하는 개발자에게 Redis는 가장 선호되고, 가장 빠르며, 기능이 가장 풍부한 캐시, 데이터 구조 서버이자 문서 및 벡터 쿼리 엔진입니다.
77,491 스타apache/superset
Apache Superset는 데이터 시각화 및 데이터 탐색 플랫폼입니다.
75,522 스타