
dagster-io/dagster
dagster-io/dagster has 16,379 GitHub stars and 2,406 forks. GitHot measured +2 stars in 24 hours, +15 in 7 days, and +56 in 15 days. Last checked 2026-11-09 13:53 UTC. Last push 2026-11-04.
데이터 자산의 개발, 프로덕션 및 관측을 위한 오케스트레이션 플랫폼입니다.
측정된 스타 증가
- in 24h
- +2
- in 7 days
- +15
- in 15 days
- +56
- in 1 month
- 업데이트 지연
서로 겹치는 기간의 순증가량이며 일별 합계가 아닙니다. 측정값이 없으면 비워 둡니다. 스타는 관심도를 나타내며 품질을 보장하지 않습니다.
README.md
Original


Dagster is a cloud-native data pipeline orchestrator for the whole development lifecycle, with integrated lineage and observability, a declarative programming model, and best-in-class testability.
It is designed for developing and maintaining data assets, such as tables, data sets, machine learning models, and reports.
With Dagster, you declare—as Python functions—the data assets that you want to build. Dagster then helps you run your functions at the right time and keep your assets up-to-date.
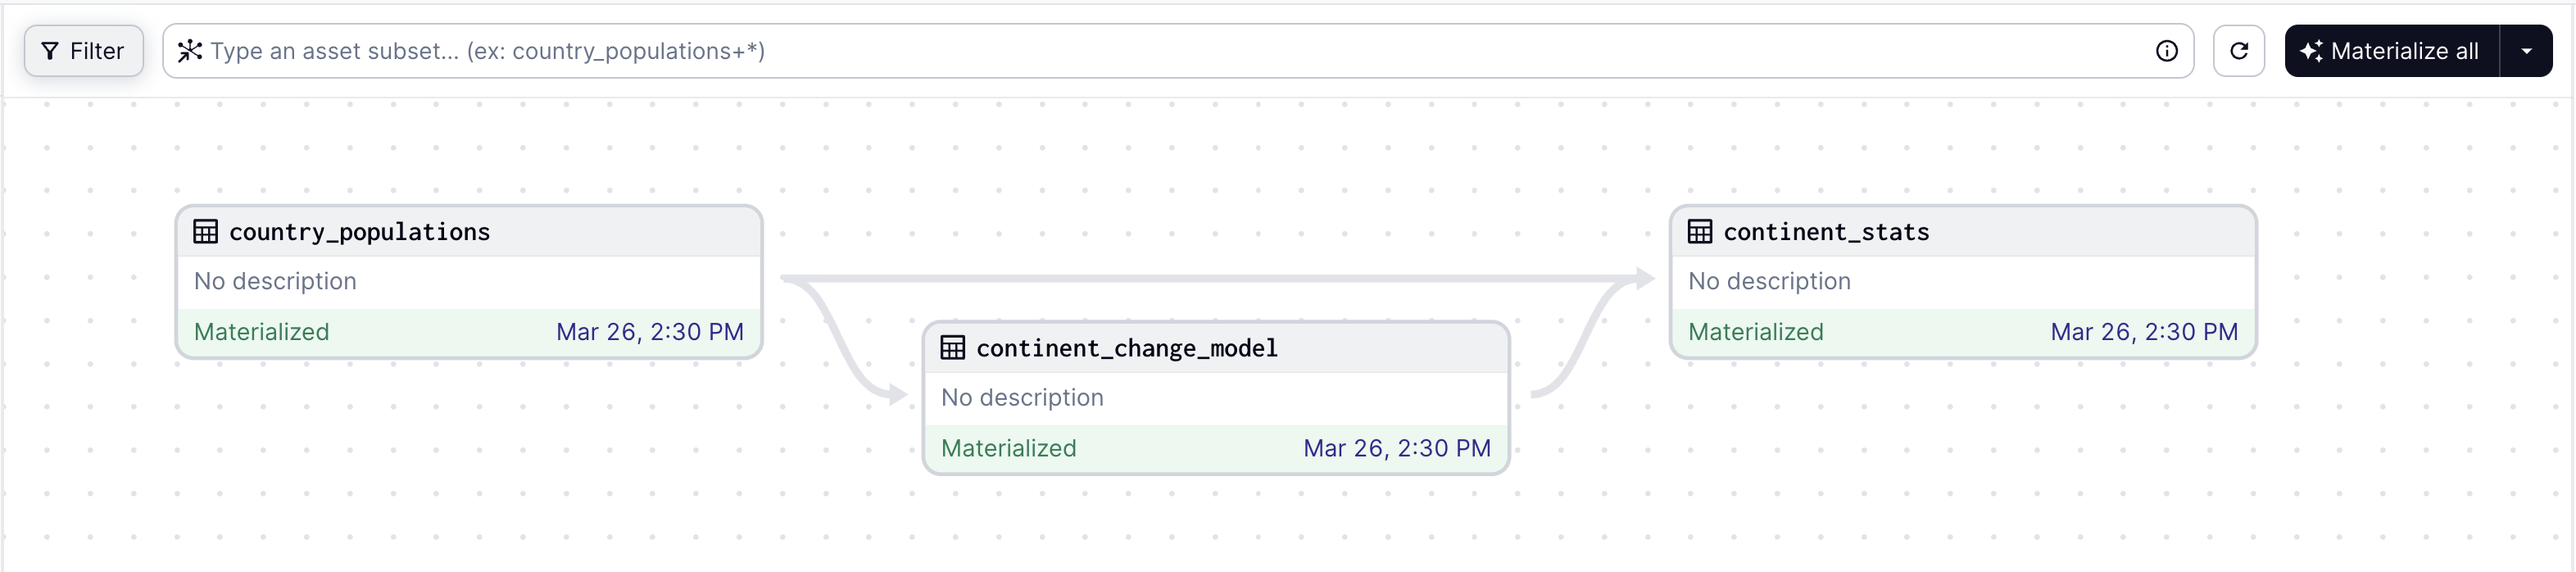
Here is an example of a graph of three assets defined in Python:
import dagster as dg
import pandas as pd

from sklearn.linear_model import LinearRegression


@dg.asset
def country_populations() -> pd.DataFrame:
    df = pd.read_html("https://tinyurl.com/mry64ebh")[0]
    df.columns = ["country", "pop2022", "pop2023", "change", "continent", "region"]
    df["change"] = df["change"].str.rstrip("%").astype("float")
    return df


@dg.asset
def continent_change_model(country_populations: pd.DataFrame) -> LinearRegression:
    data = country_populations.dropna(subset=["change"])
    return LinearRegression().fit(pd.get_dummies(data[["continent"]]), data["change"])


@dg.asset
def continent_stats(
    country_populations: pd.DataFrame, continent_change_model: LinearRegression
) -> pd.DataFrame:
    result = country_populations.groupby("continent").sum()
    result["pop_change_factor"] = continent_change_model.coef_
    return result
The graph loaded into Dagster's web UI:
Dagster is built to be used at every stage of the data development lifecycle - local development, unit tests, integration tests, staging environments, all the way up to production.
Quick Start:
If you're new to Dagster, we recommend checking out the docs or following the hands-on tutorial.
Dagster is available on PyPI and officially supports Python 3.9 through Python 3.14.
uv add dagster dagster-webserver dagster-dg-cli
Documentation
You can find the full Dagster documentation here, including the Quickstart guide.
Key Features:

Dagster as a productivity platform
Identify the key assets you need to create using a declarative approach, or you can focus on running basic tasks. Embrace CI/CD best practices from the get-go: build reusable components, spot data quality issues, and flag bugs early.
Dagster as a robust orchestration engine
Put your pipelines into production with a robust multi-tenant, multi-tool engine that scales technically and organizationally.
Dagster as a unified control plane
Maintain control over your data as the complexity scales. Centralize your metadata in one tool with built-in observability, diagnostics, cataloging, and lineage. Spot any issues and identify performance improvement opportunities.
Master the Modern Data Stack with integrations
Dagster provides a growing library of integrations for today’s most popular data tools. Integrate with the tools you already use, and deploy to your infrastructure.

Community
Connect with thousands of other data practitioners building with Dagster. Share knowledge, get help, and contribute to the open-source project. To see featured material and upcoming events, check out our Dagster Community page.
Join our community here:
- 🌟 Star us on GitHub
- 📥 Subscribe to our Newsletter
- 🐦 Follow us on Twitter
- 🕴️ Follow us on LinkedIn
- 📺 Subscribe to our YouTube channel
- 📚 Read our blog posts
- 👋 Join us on Slack
- 🗃 Browse Slack archives
- ✏️ Start a GitHub Discussion
Contributing
For details on contributing or running the project for development, check out our contributing guide.
License
Dagster is Apache 2.0 licensed.
관련 프로젝트 살펴보기
Asabeneh/30-Days-Of-Python
30 Days of Python 프로그래밍 챌린지는 Python 프로그래밍 언어를 30일 동안 배우기 위한 단계별 가이드입니다. 이 챌린지는 100일 이상 걸릴 수 있습니다. 자신의 속도에 맞춰 진행하세요. 다음 동영상도 도움이 될 수 있습니다: https://www.youtube.com/channel/UC7PNRuno1rzYPb1xLa4yktw
78,486 스타grafana/grafana
개방적이고 조합 가능한 옵저버빌리티 및 데이터 시각화 플랫폼입니다. Prometheus, Loki, Elasticsearch, InfluxDB, Postgres 등 여러 소스의 메트릭, 로그, 트레이스를 시각화합니다.
77,790 스타redis/redis
실시간 데이터 기반 애플리케이션을 구축하는 개발자에게 Redis는 가장 선호되고, 가장 빠르며, 기능이 가장 풍부한 캐시, 데이터 구조 서버이자 문서 및 벡터 쿼리 엔진입니다.
77,332 스타apache/superset
Apache Superset는 데이터 시각화 및 데이터 탐색 플랫폼입니다.
75,455 스타