
benthecoder/linkedin-visualizer
benthecoder/linkedin-visualizer has 54 GitHub stars and 11 forks. GitHot measured 0 stars in 24 hours, 0 in 7 days, and 0 in 15 days. Last checked 2026-11-12 00:01 UTC. Last push 2022-10-06.
The missing feature in LinkedIn
What you can do
- Total connections on LinkedIn
- Where most of your connections work at
- Who most of your connections are (what job title they hold)
- Who you last connected with
측정된 스타 증가
- in 24h
- 0
- in 7 days
- 0
- in 15 days
- 0
- in 1 month
- 업데이트 지연
서로 겹치는 기간의 순증가량이며 일별 합계가 아닙니다. 측정값이 없으면 비워 둡니다. 스타는 관심도를 나타내며 품질을 보장하지 않습니다.
README.md
OriginalLinkedin Connections Insights 🪄

Get helpful statistics on your LinkedIn connection now!
Learn more about the project (Link)
Check out a walkthrough of the app of my LinkedIn connections (Link)
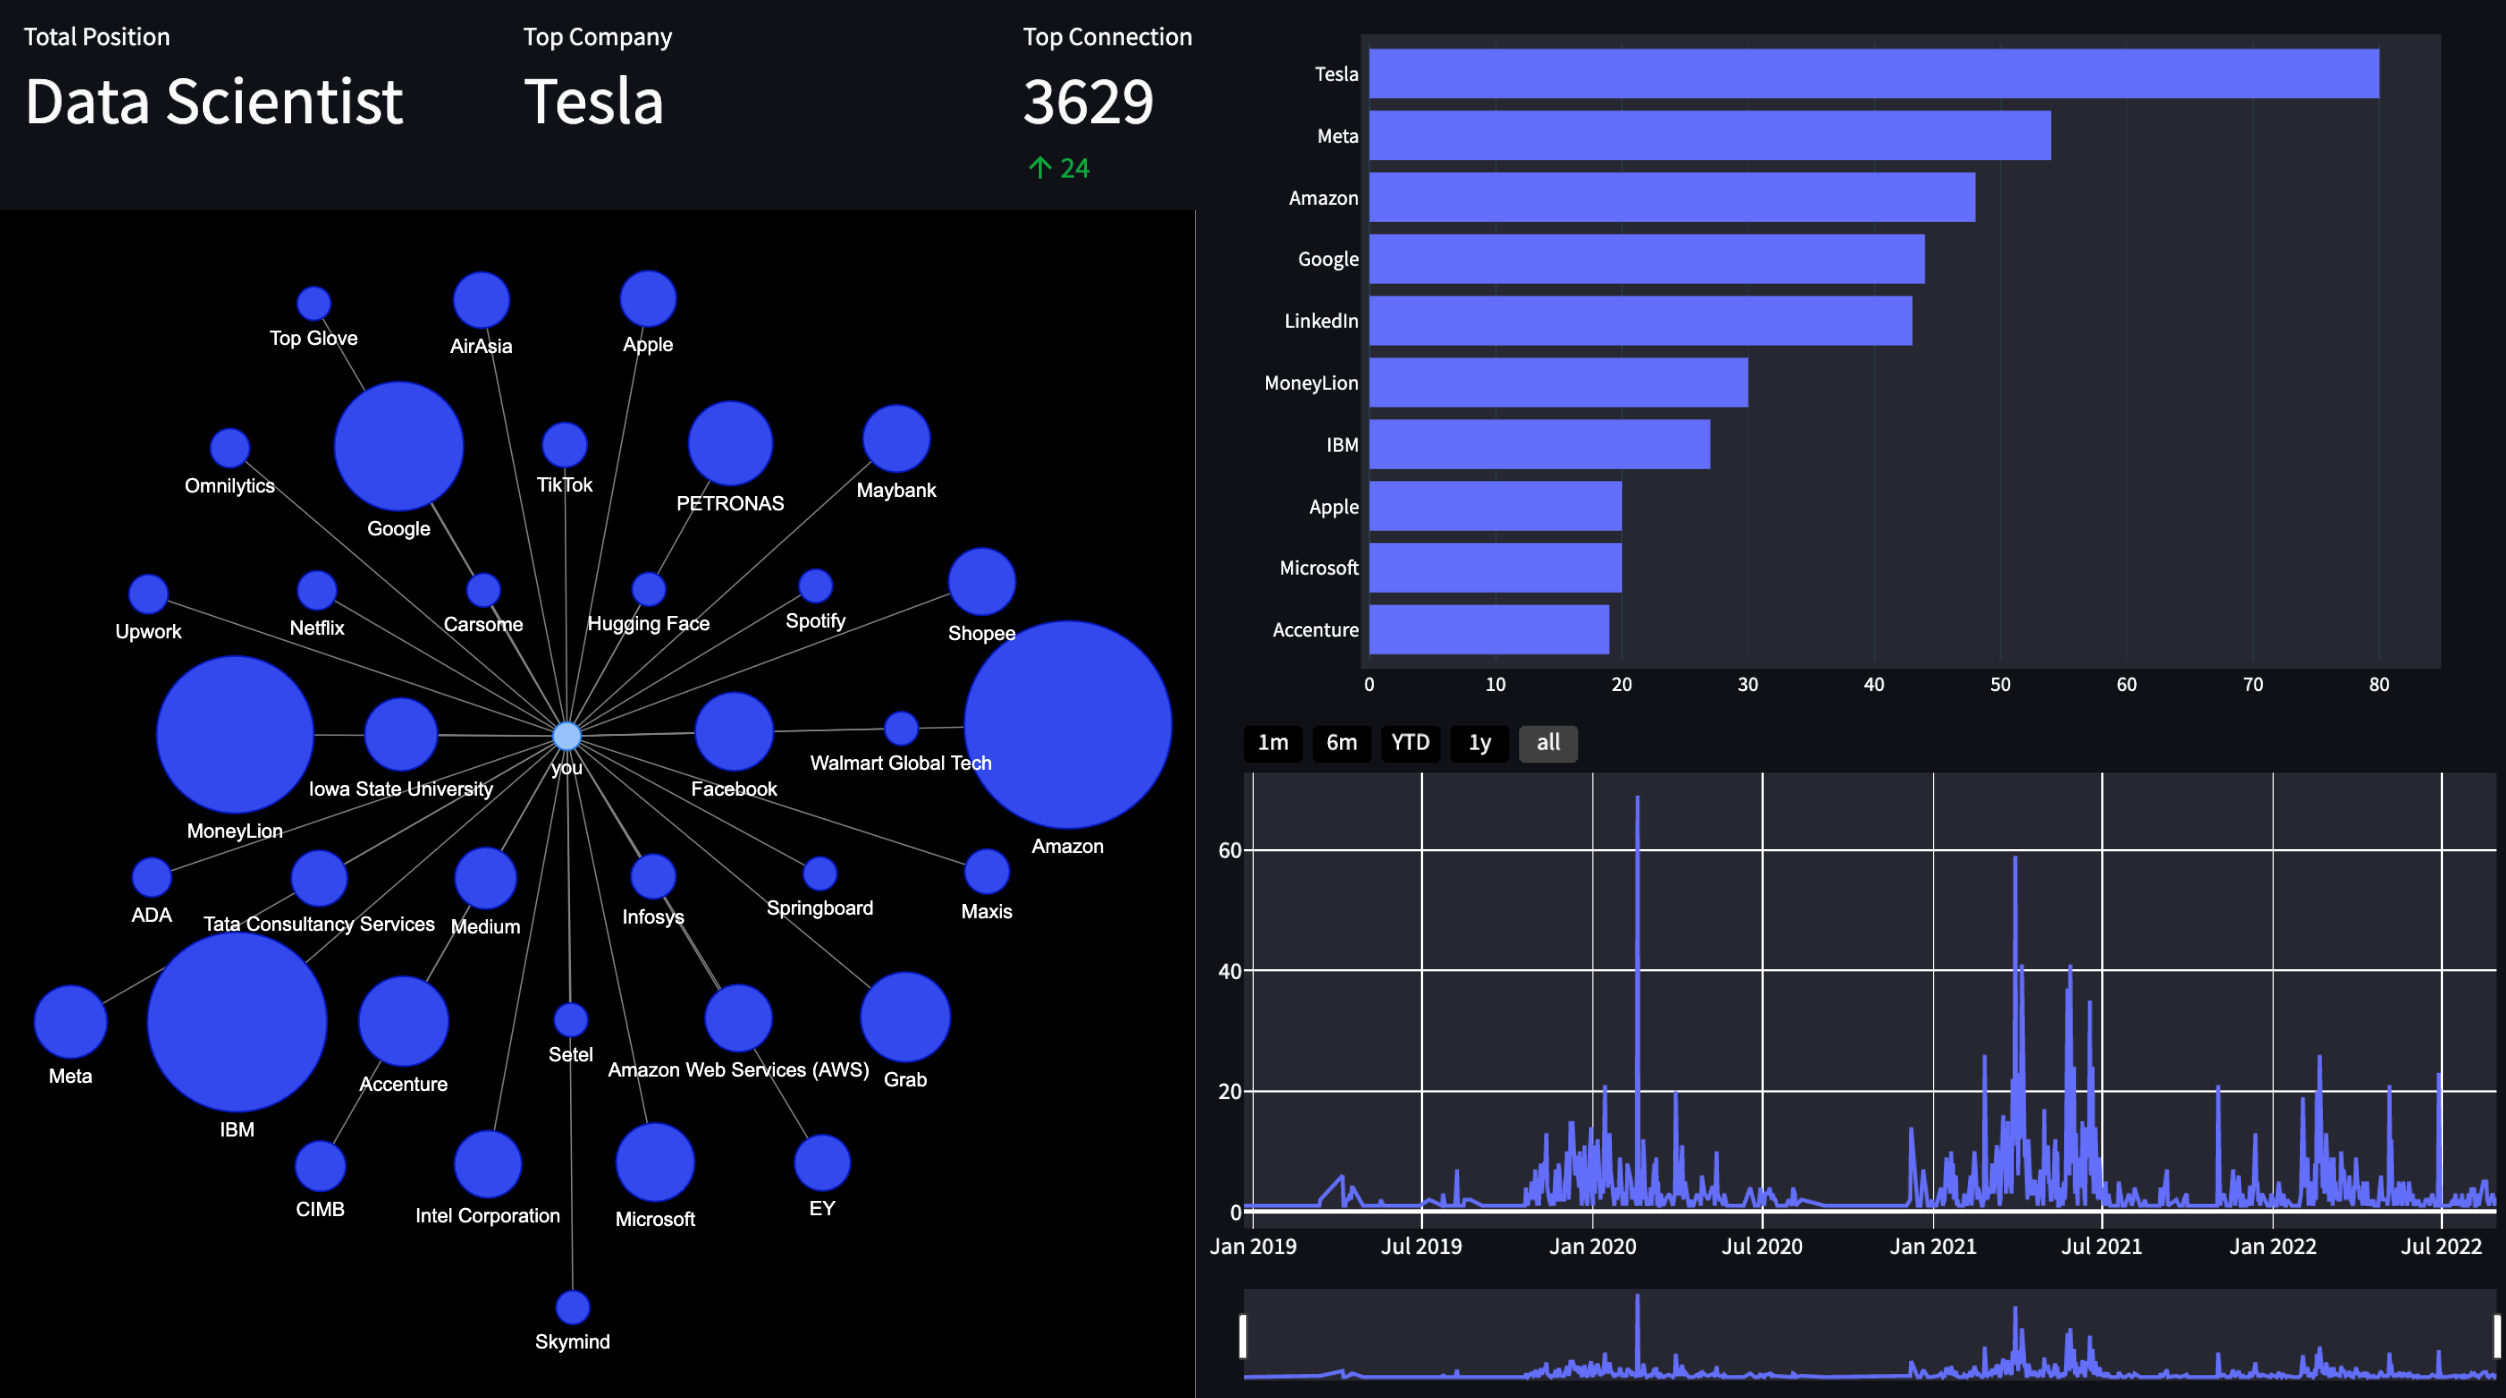
Features
This app tells you the information below
- Total connections on LinkedIn
- Where most of your connections work at
- Who most of your connections are (what job title they hold)
- Who you last connected with
- Who you first connected with (send them a message!)
- Bar chart of top companies and positions
- Time series plot of your connections over time (find out when you had the most connections)
- A graph/network of your connections (see your connections in a graph)
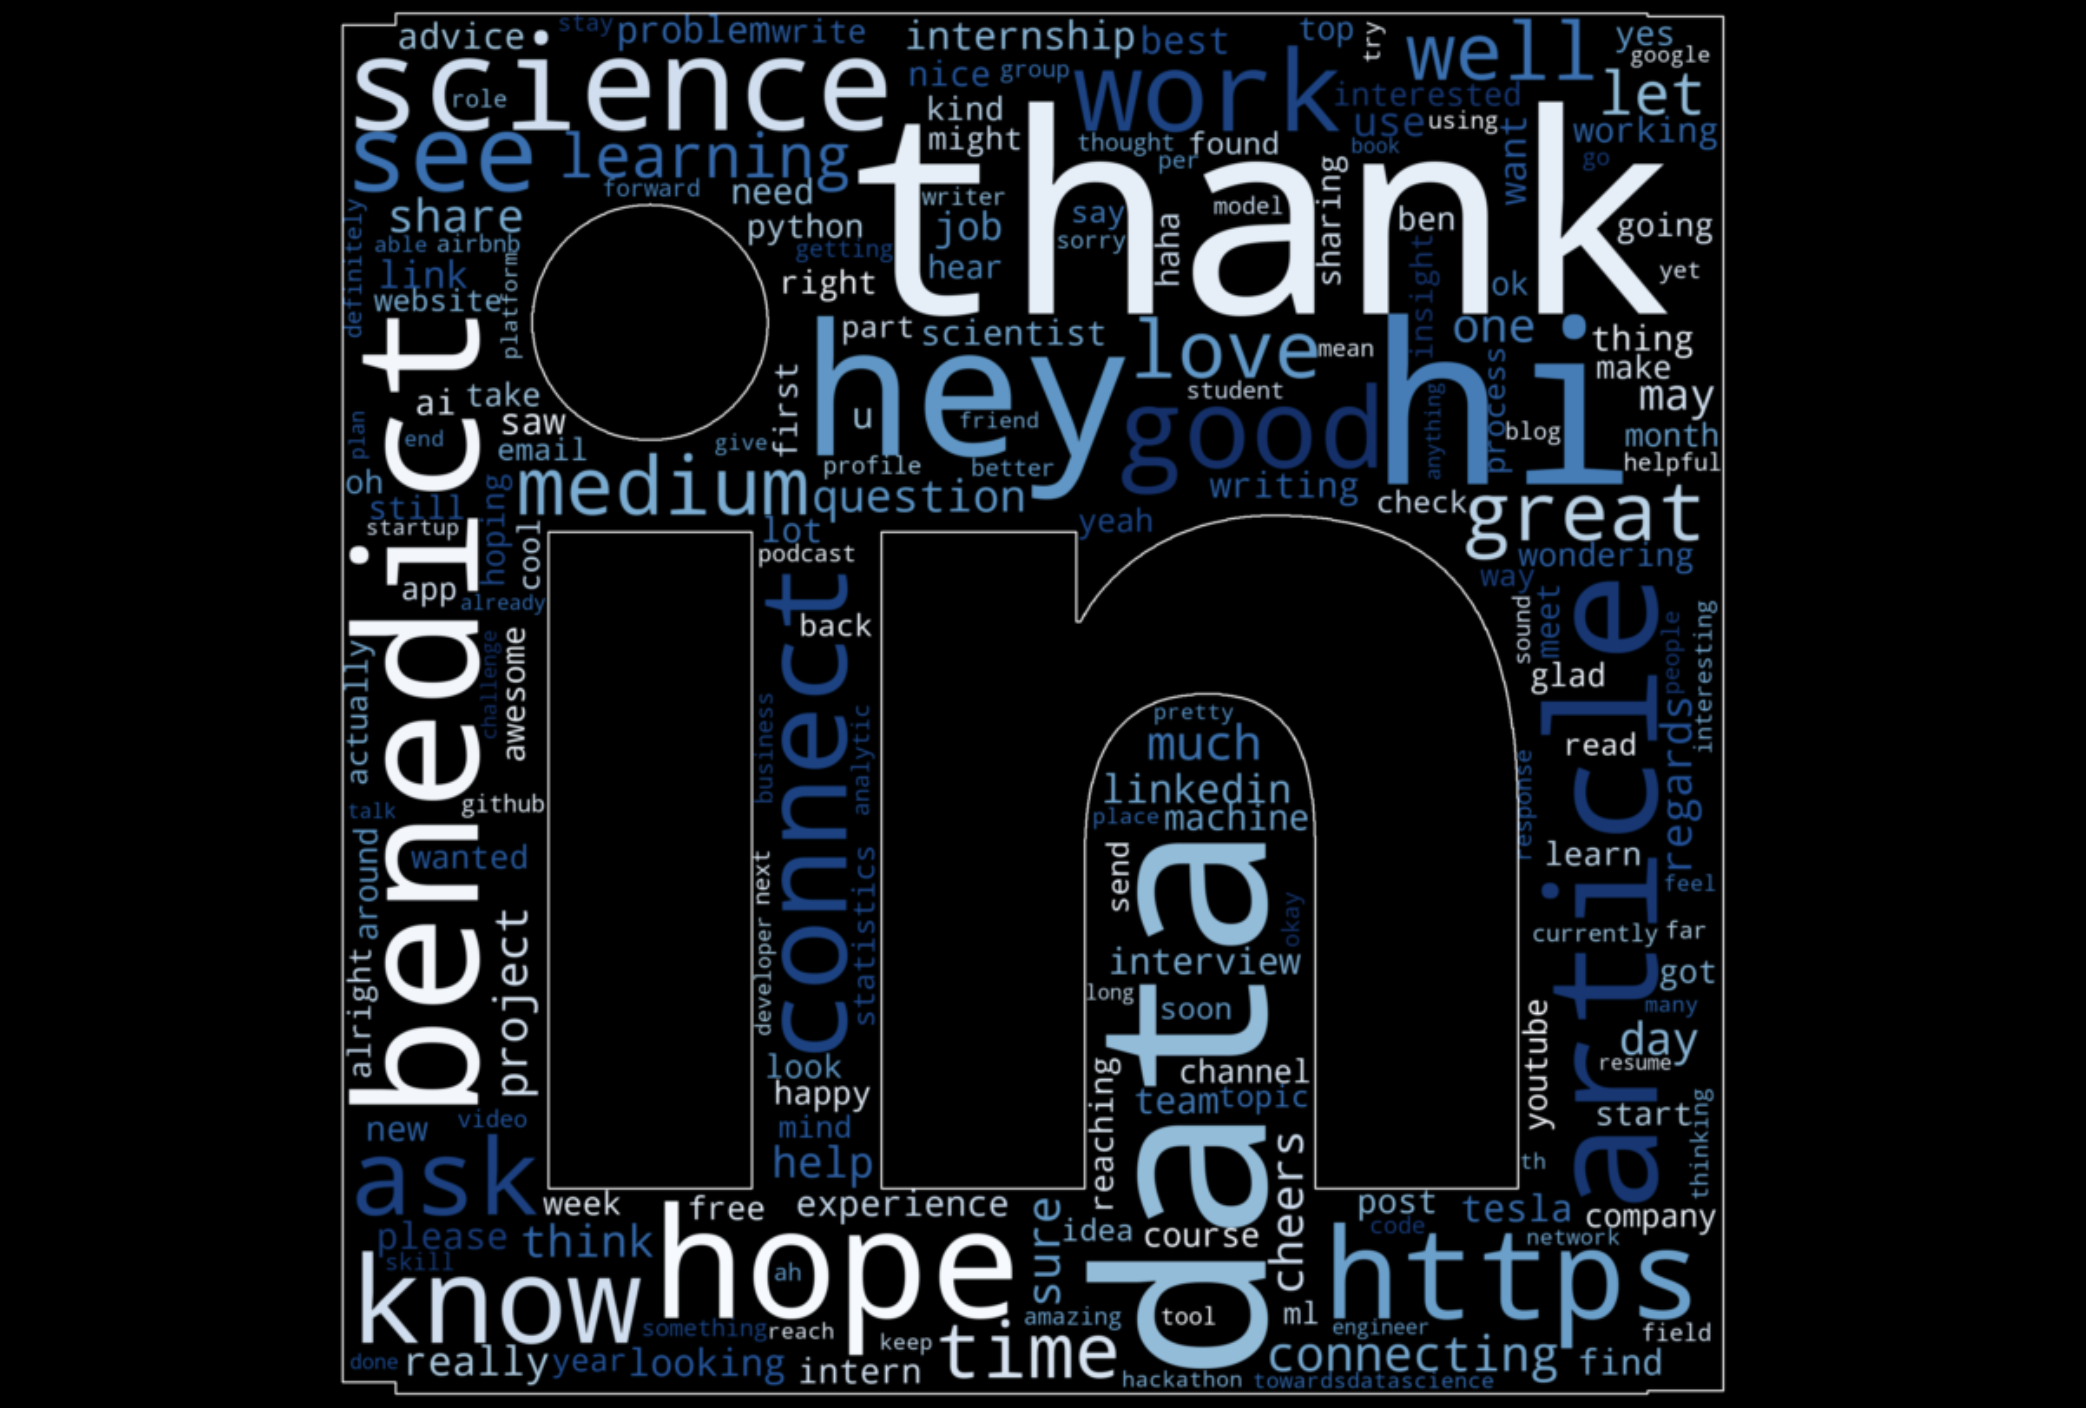
- A wordcloud of your chat messages with your connections (new!)
- Last but not least, a "who you can cold email" section that provides a list of emails of your connections (perks of LinkedIn connections!)
Word Cloud (New Feature!)
Run Locally
Clone the project
git clone https://github.com/benthecoder/linkedin-visualizer.git
Go to the project directory
cd linkedin-visualizer
Using Docker
Build an Image
docker build -t linkedin-visualizer:1.0 .
Run the Image
docker run -p 8501:8501 linkedin-visualizer:1.0
The app is now live on http://localhost:8501/
Using Conda
Create Conda environment
conda create --name env_name python=3.8
Activate the environment
conda activate env_name
Install requirements
pip install -r requirements.txt
Run streamlit
streamlit run app.py
Using Poetry
first make sure you have python 3.8
poetry install
poetry run streamlit run app.py
Contributing
Contributions are always welcome!
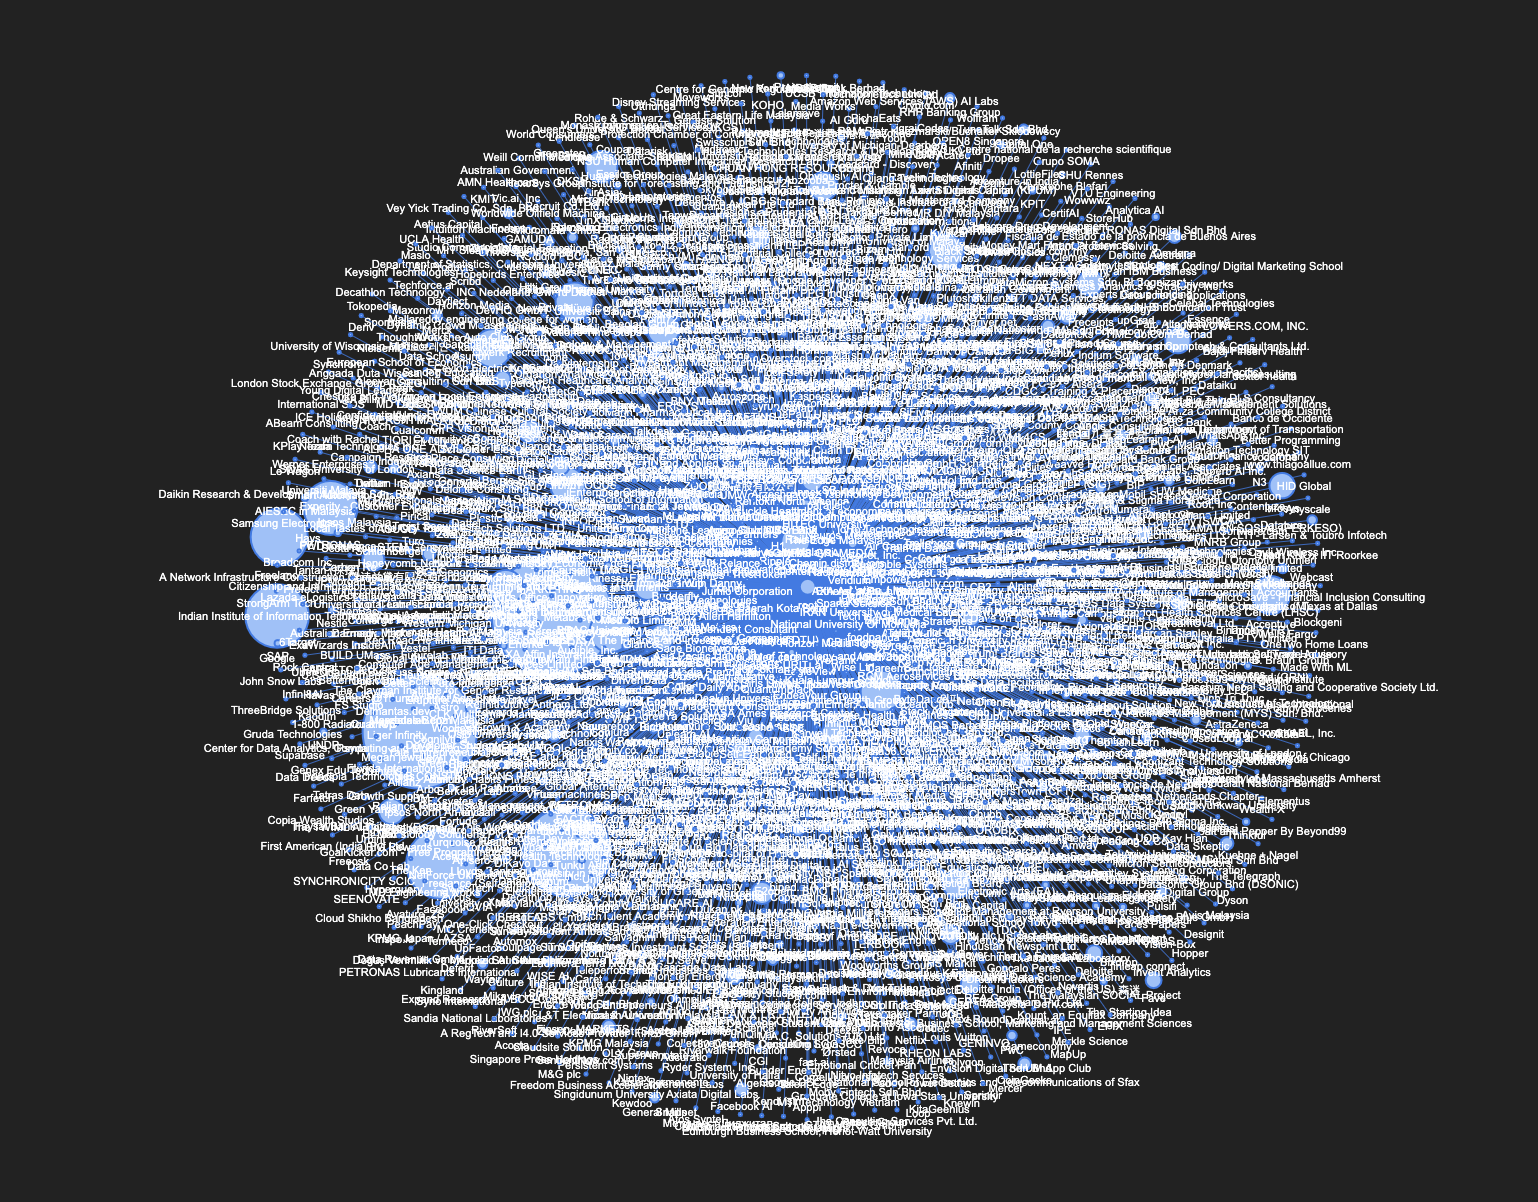
All connections
Here's what happens when I display all of the companies where my connections work at
관련 프로젝트 살펴보기
Asabeneh/30-Days-Of-Python
30 Days of Python 프로그래밍 챌린지는 Python 프로그래밍 언어를 30일 동안 배우기 위한 단계별 가이드입니다. 이 챌린지는 100일 이상 걸릴 수 있습니다. 자신의 속도에 맞춰 진행하세요. 다음 동영상도 도움이 될 수 있습니다: https://www.youtube.com/channel/UC7PNRuno1rzYPb1xLa4yktw
78,618 스타grafana/grafana
개방적이고 조합 가능한 옵저버빌리티 및 데이터 시각화 플랫폼입니다. Prometheus, Loki, Elasticsearch, InfluxDB, Postgres 등 여러 소스의 메트릭, 로그, 트레이스를 시각화합니다.
77,859 스타redis/redis
실시간 데이터 기반 애플리케이션을 구축하는 개발자에게 Redis는 가장 선호되고, 가장 빠르며, 기능이 가장 풍부한 캐시, 데이터 구조 서버이자 문서 및 벡터 쿼리 엔진입니다.
77,472 스타apache/superset
Apache Superset는 데이터 시각화 및 데이터 탐색 플랫폼입니다.
75,495 스타