
antvis/AVA has 1,614 GitHub stars and 169 forks. GitHot measured +19 in 7 days. Last checked 2026-11-10 02:18 UTC. Last push 2026-11-02.
👾 에이전트를 위해 구축된 AI 네이티브 시각 분석 프레임워크입니다.
측정된 스타 증가
- in 24h
- 업데이트 지연
- in 7 days
- +19
- in 15 days
- 업데이트 지연
- in 1 month
- 업데이트 지연
서로 겹치는 기간의 순증가량이며 일별 합계가 아닙니다. 측정값이 없으면 비워 둡니다. 스타는 관심도를 나타내며 품질을 보장하지 않습니다.
README.md
OriginalAVA, AI-native Visual Analytics


AVA (
[!NOTE] Think of AVA as PandasAI for JavaScript. 💬📊🤖
It brings natural-language data analysis and visualization to your apps and AI agents.
✨ Why AVA?
🔌 Unified data accessConnect files and databases through one interface. Data sources → |
🔎 Grounded answersInspect the queries and results behind each answer. Trusted analysis → |
📊 Smart visualizationGet charts guided by your question and data. Visualization → |
💻 Local executionChoose where analysis runs and which model endpoint it uses. Execution engines → |
🎯 Published benchmarksCheck accuracy against reference answers under published test conditions. Benchmarks → |
🤖 Agent integrationYour agent reasons; AVA executes the data workflow. Agent integration → |
🚀 Getting started
Install AVA 4.0 with Node.js 22.13+:
npm install @antv/ava@4
💻 Usage
Download sales.csv and configure your model:
import { AVA } from '@antv/ava';

const ava = new AVA({
  llm: {
    model: '<your-model>',
    apiKey: '<your-api-key>',
    // baseURL: '<your-provider-api-url>',
  },
});
1. Load
await ava.source({ type: 'csv-file', options: { path: './sales.csv' } });
[!NOTE] Data preview
First 3 of 240 rows, selected columns:
order_date product sales 2025-01-01 Monitor 224.10 2025-01-02 Office Chair 680.20 2025-01-04 Monitor 2,191.20
2. Explore
Inspect the structure and data quality, then add business definitions:
const schema = await ava.schema();
const profile = await ava.profile({ metrics: ['row_count', 'null_count'] });
await ava.semantic(undefined, () => ({
  description: 'Use the sales column for amounts after discounts and order_date for monthly comparisons.',
}));
[!NOTE] Analysis context
Context Details Structure data: 12 columnsQuality 240 rows; 1 missing regionand 1 missingquantitySemantics salesis after discounts; monthly comparisons useorder_date
3. Suggest
const suggestions = await ava.suggest(3);
[!NOTE] Suggested questions (examples)
- How did sales change from January to February 2025?
- Which products contributed most to the sales decline?
- How do sales and profit vary by region?
4. Analyze
const result = await ava.analyze(
  'Compare January and February 2025 sales by product. Show both months and the change, ordered by the largest decline.'
);
[!NOTE] Analysis result
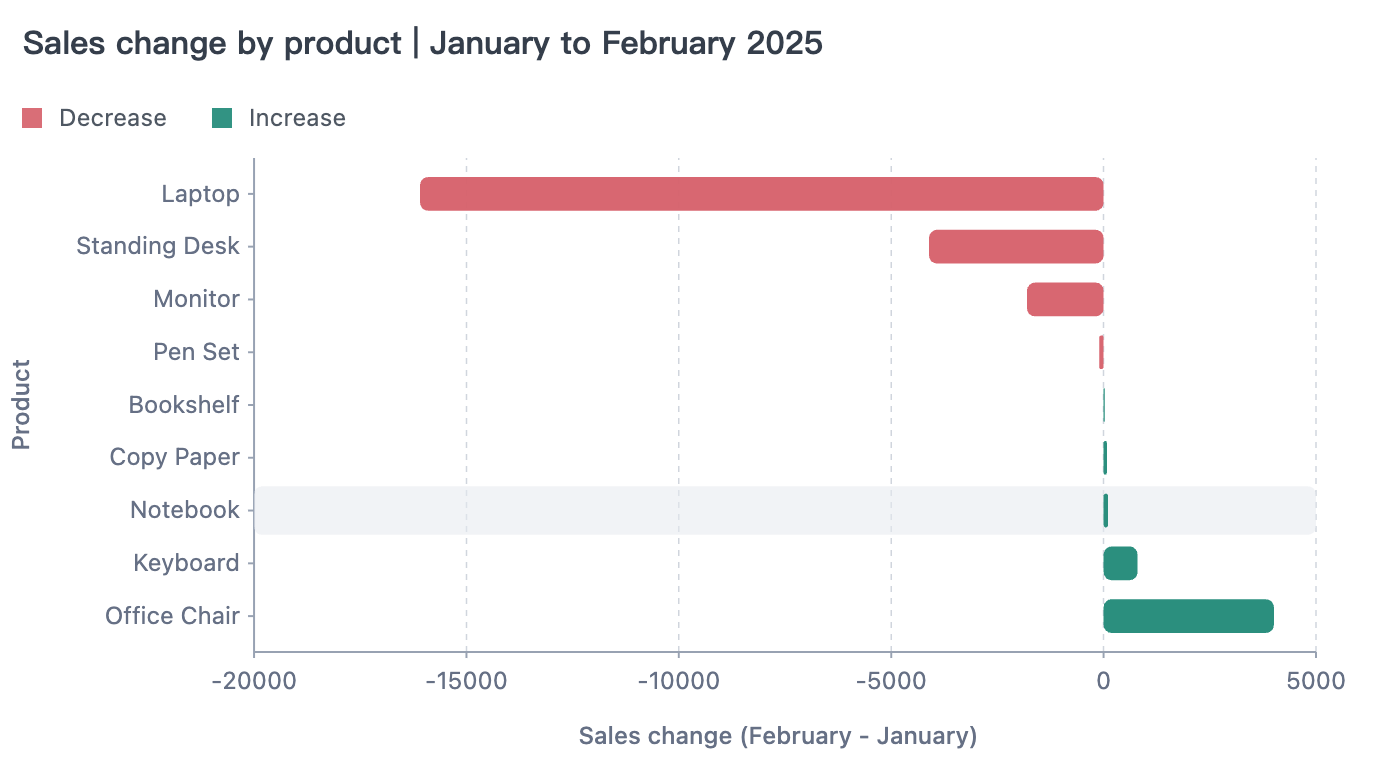
Total sales fell 43.94%, led by a 16,092.10 decline in laptop sales.
First 3 of 9 products:
Product January sales February sales Change Laptop 19,688.10 3,596.00 −16,092.10 Standing Desk 9,655.80 5,546.10 −4,109.70 Monitor 6,536.25 4,731.00 −1,805.25
5. Visualize
const chart = await ava.visualize({
  query: 'Plot the sales change by product from January to February 2025 as a bar chart.',
  data: result.data,
});
[!NOTE] Chart preview
Powered by GPT-Vis.
🔌 Connect your data
 CSV |
 JSON |
 Parquet |
 Excel |
 Text |
 Feishu Bitable |
 Tencent Docs |
 SQLite |
 MySQL |
 PostgreSQL |
 SQL Server |
 MongoDB |
 Supabase |
 ClickHouse |
[!TIP] Missing a data source? 💡🛠️
🎯 Benchmarks
We evaluate AVA on established benchmarks to measure the accuracy and efficiency of its data analysis.

Evaluation setup and reports →
🧩 More ways to use AVA
The agent and CLI workflows run on Node.js 22.13+ on macOS or Linux.
Use with an Agent
Ask your AI agent:
Install the AVA skill with `npx skills add antvis/AVA`, then follow its setup instructions.
Use from the CLI
Load and analyze data from your terminal:
ava source ./sales.csv
ava analyze '<dataset-id>' 'Compare January and February 2025 sales by product.'
See the CLI guide for setup and commands.
📚 Resources
- Documentation — Guides and examples
- Analysis strategies — Direct and loop execution
- API Reference — Methods and configuration
- AI — Try out AVA in the browser environment
- Benchmarks — Evaluation results
- Issues — Bug reports and feature requests
🤝🛠️ Contributing
Contributions are welcome. Include tests, examples, and documentation with new features.
Run npm test to test your changes. For model-backed tests, copy .env.example to .env and add your model settings.
📑 Papers
VizLinter - Chen, Q., Sun, F., Xu, X., Chen, Z., Wang, J. and Cao, N., 2021. VizLinter: A Linter and Fixer Framework for Data Visualization. IEEE transactions on visualization and computer graphics, 28(1), pp.206-216.
《数据可视化设计的类型学实践》(Exploring the Typology of Visualization Design) - 蓝星宇, 王嘉喆. 数据可视化设计的类型学实践, 《美术大观》, 2022(3), 149-152.
⚖️ License
MIT
관련 프로젝트 살펴보기
Asabeneh/30-Days-Of-Python
30 Days of Python 프로그래밍 챌린지는 Python 프로그래밍 언어를 30일 동안 배우기 위한 단계별 가이드입니다. 이 챌린지는 100일 이상 걸릴 수 있습니다. 자신의 속도에 맞춰 진행하세요. 다음 동영상도 도움이 될 수 있습니다: https://www.youtube.com/channel/UC7PNRuno1rzYPb1xLa4yktw
78,486 스타grafana/grafana
개방적이고 조합 가능한 옵저버빌리티 및 데이터 시각화 플랫폼입니다. Prometheus, Loki, Elasticsearch, InfluxDB, Postgres 등 여러 소스의 메트릭, 로그, 트레이스를 시각화합니다.
77,790 스타redis/redis
실시간 데이터 기반 애플리케이션을 구축하는 개발자에게 Redis는 가장 선호되고, 가장 빠르며, 기능이 가장 풍부한 캐시, 데이터 구조 서버이자 문서 및 벡터 쿼리 엔진입니다.
77,332 스타apache/superset
Apache Superset는 데이터 시각화 및 데이터 탐색 플랫폼입니다.
75,455 스타