
Yous3ry/Python_Automated_DCA
Yous3ry/Python_Automated_DCA has 26 GitHub stars and 13 forks. Star changes are not measured yet. Last checked 2026-11-14 03:44 UTC. Last push 2026-11-11.
측정된 스타 증가
- in 24h
- 기록 수집 중
- in 7 days
- 기록 수집 중
- in 15 days
- 기록 수집 중
- in 1 month
- 기록 수집 중
서로 겹치는 기간의 순증가량이며 일별 합계가 아닙니다. 측정값이 없으면 비워 둡니다. 스타는 관심도를 나타내며 품질을 보장하지 않습니다.
소개
Python Automatic Decline Curve Analysis (DCA) For Petroleum Producing wells
데이터README.md
OriginalPython Automatic Decline Curve Analysis (DCA) For Petroleum Producing wells
Table of Contents
About The Project
Decline Curve Analysis (DCA) is a widely accepted method for analyzing declining production rates and forecasting future performance of oil and gas wells. [1] For oil fields with hundreds or even thousands of wells updating the production forecast for each well based on DCA could be very time consuimg. Here's why:
- Typically curve fitting to estimate the decline rate and initial rate is done graphically which could be very time consuming, and
- Over the life of a conventional oil producing well, decline rates may change over time with changes in operating conditions, e.g. start of water injection, aritifical lift methodlogy or effciency changes, etc. Thus the history of the well could be divided into different distinct regions and DCA parameters should only be estimated based on the last stable producing conditions rather than average fitting of all the historical performance.
Workflow
- Connect to production database to read well data (Python File here)
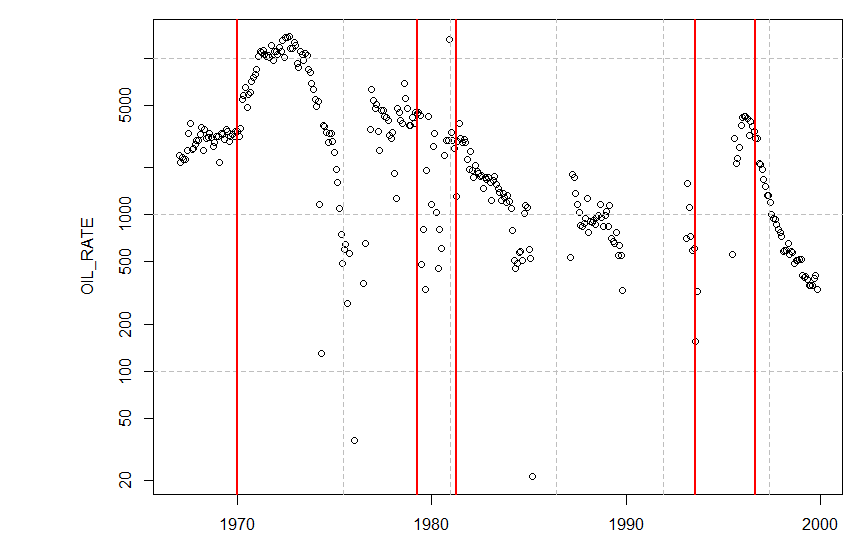
- Use R to detect change points assuming a piecewise linear trend using EnvCpt Package[2] as shown in example below (R File here)
- Finally an integrated Python file (Final Python File here) is used to a) Load Well Data b) detect change points using R via Rpy2 c) fit exponential or Hyperbolic decline based on user input on the last stable period d) Forecast production rate. Note forecast is limited by user minimum rate and forecast period.
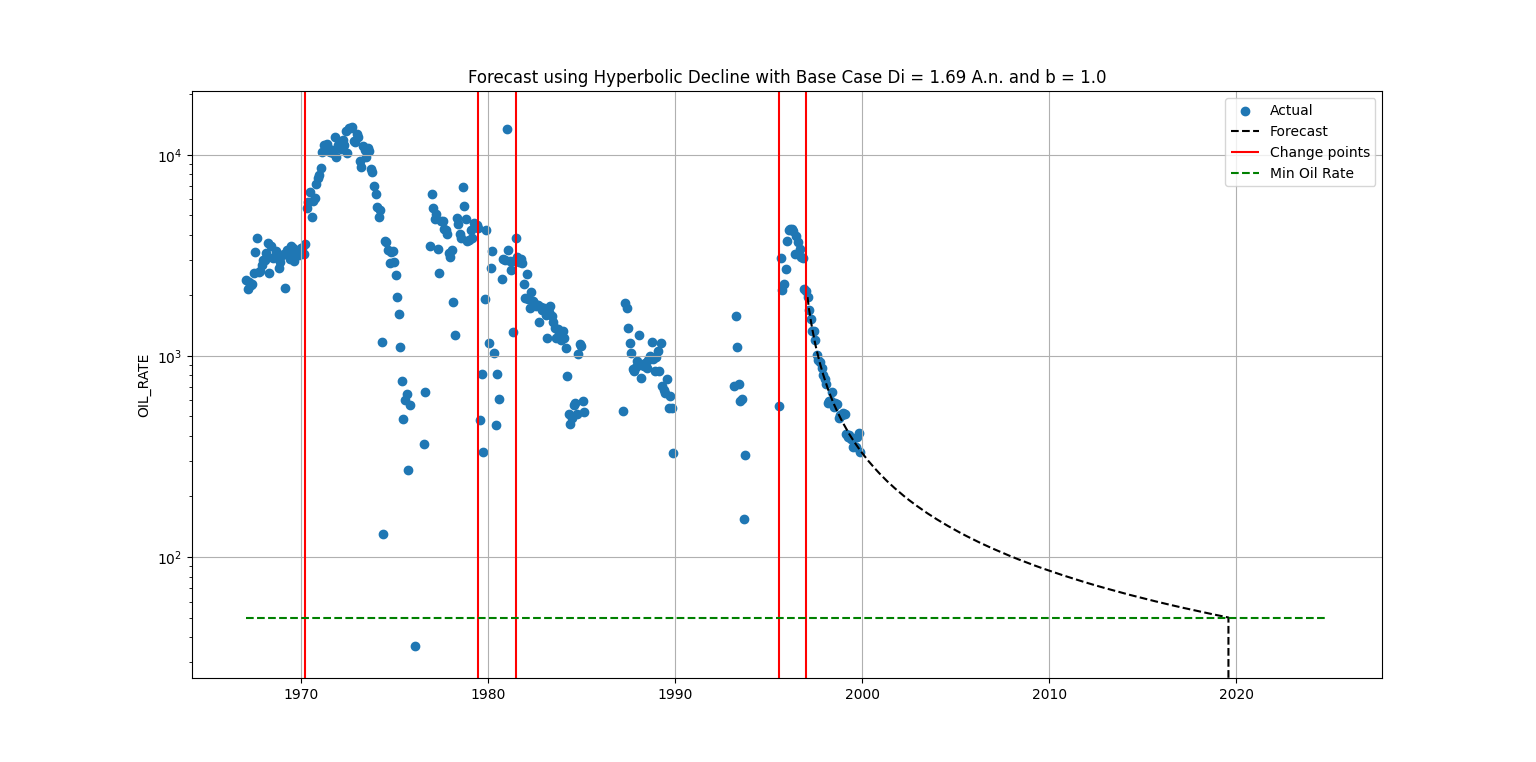
NOTE A compiled Python Script integrates all previous steps and loops through all the wells in the database and exports the total field/company forecast. (Compiled Python File here)
Dependencies
Python Packages <- sqlalchemy, scipy, matplotlib, pandas, numpy, json, rpy2
R Packages <- EnvCpt
References
[1]
https://petrowiki.spe.org/Production_forecasting_decline_curve_analysis#:~:text=Decline%20curve%20analysis%20(DCA)%20is,fluids%2C%20are%20usually%20the%20cause.
[2]
https://rdrr.io/cran/EnvCpt/man/envcpt.html
관련 프로젝트 살펴보기
Asabeneh/30-Days-Of-Python
30 Days of Python 프로그래밍 챌린지는 Python 프로그래밍 언어를 30일 동안 배우기 위한 단계별 가이드입니다. 이 챌린지는 100일 이상 걸릴 수 있습니다. 자신의 속도에 맞춰 진행하세요. 다음 동영상도 도움이 될 수 있습니다: https://www.youtube.com/channel/UC7PNRuno1rzYPb1xLa4yktw
78,711 스타grafana/grafana
개방적이고 조합 가능한 옵저버빌리티 및 데이터 시각화 플랫폼입니다. Prometheus, Loki, Elasticsearch, InfluxDB, Postgres 등 여러 소스의 메트릭, 로그, 트레이스를 시각화합니다.
77,894 스타redis/redis
실시간 데이터 기반 애플리케이션을 구축하는 개발자에게 Redis는 가장 선호되고, 가장 빠르며, 기능이 가장 풍부한 캐시, 데이터 구조 서버이자 문서 및 벡터 쿼리 엔진입니다.
77,490 스타apache/superset
Apache Superset는 데이터 시각화 및 데이터 탐색 플랫폼입니다.
75,522 스타