
SigNoz/signoz
SigNoz/signoz has 32,563 GitHub stars and 2,587 forks. GitHot measured +53 in 7 days and +108 in 15 days. Last checked 2026-11-10 01:34 UTC. Last push 2026-11-06.
SigNoz는 팀과 팀의 AI 에이전트를 위한 오픈 소스 OpenTelemetry 네이티브 옵저버빌리티 플랫폼입니다. 하나의 도구에서 로그, 메트릭, 트레이스를 확인할 수 있으며 APM, 분산 추적, 로그 관리, 인프라 모니터링 등의 기능을 제공합니다. SigNoz MCP 및 네이티브 AI 팀메이트(SigNoz Cloud에서 제공)와 함께 사용하면 더욱 복원력 높은 앱을 구축하는 데 도움이 됩니다.
What you can do
- OpenTelemetry-native Instrument once with open standards and keep ownership of your telemetry.
- Correlated signals Move from service charts to traces, logs, infra metrics, and exceptions without switching tools.
- Single columnar database Built for high-cardinality, high-volume observability workloads.
- Predictable pricing No per-host pricing, no user-seat pricing, and no special pricing for custom metrics.
측정된 스타 증가
- in 24h
- 업데이트 지연
- in 7 days
- +53
- in 15 days
- +108
- in 1 month
- 업데이트 지연
서로 겹치는 기간의 순증가량이며 일별 합계가 아닙니다. 측정값이 없으면 비워 둡니다. 스타는 관심도를 나타내며 품질을 보장하지 않습니다.
README.md
Original





SigNoz is an open-source observability platform built on OpenTelemetry. We’re building an enterprise-grade alternative to fragmented monitoring stacks, with logs, metrics, traces, alerts, and dashboards in one place.
Choose how to run SigNoz
SigNoz Cloud (Recommended)
Fully managed SigNoz with a 30-day free trial, no credit card required, usage-based pricing that starts at $49, and regional data hosting.
Enterprise
Enterprise Cloud, BYOC, or Enterprise Self-Hosted with compliance, support, custom retention, RBAC, ingestion controls, data residency, and region selection.
Community
Free open-source SigNoz that runs in your own infrastructure. Deploy with Docker, Kubernetes, or Linux and keep full control of your data plane.
What can you monitor?
SigNoz helps teams debug production issues faster by connecting logs, metrics, traces, alerts, dashboards, exceptions, and agent-native workflows in one place.
APM Overview
Monitor service latency, error rate, throughput, Apdex, top endpoints, database calls, and external calls.
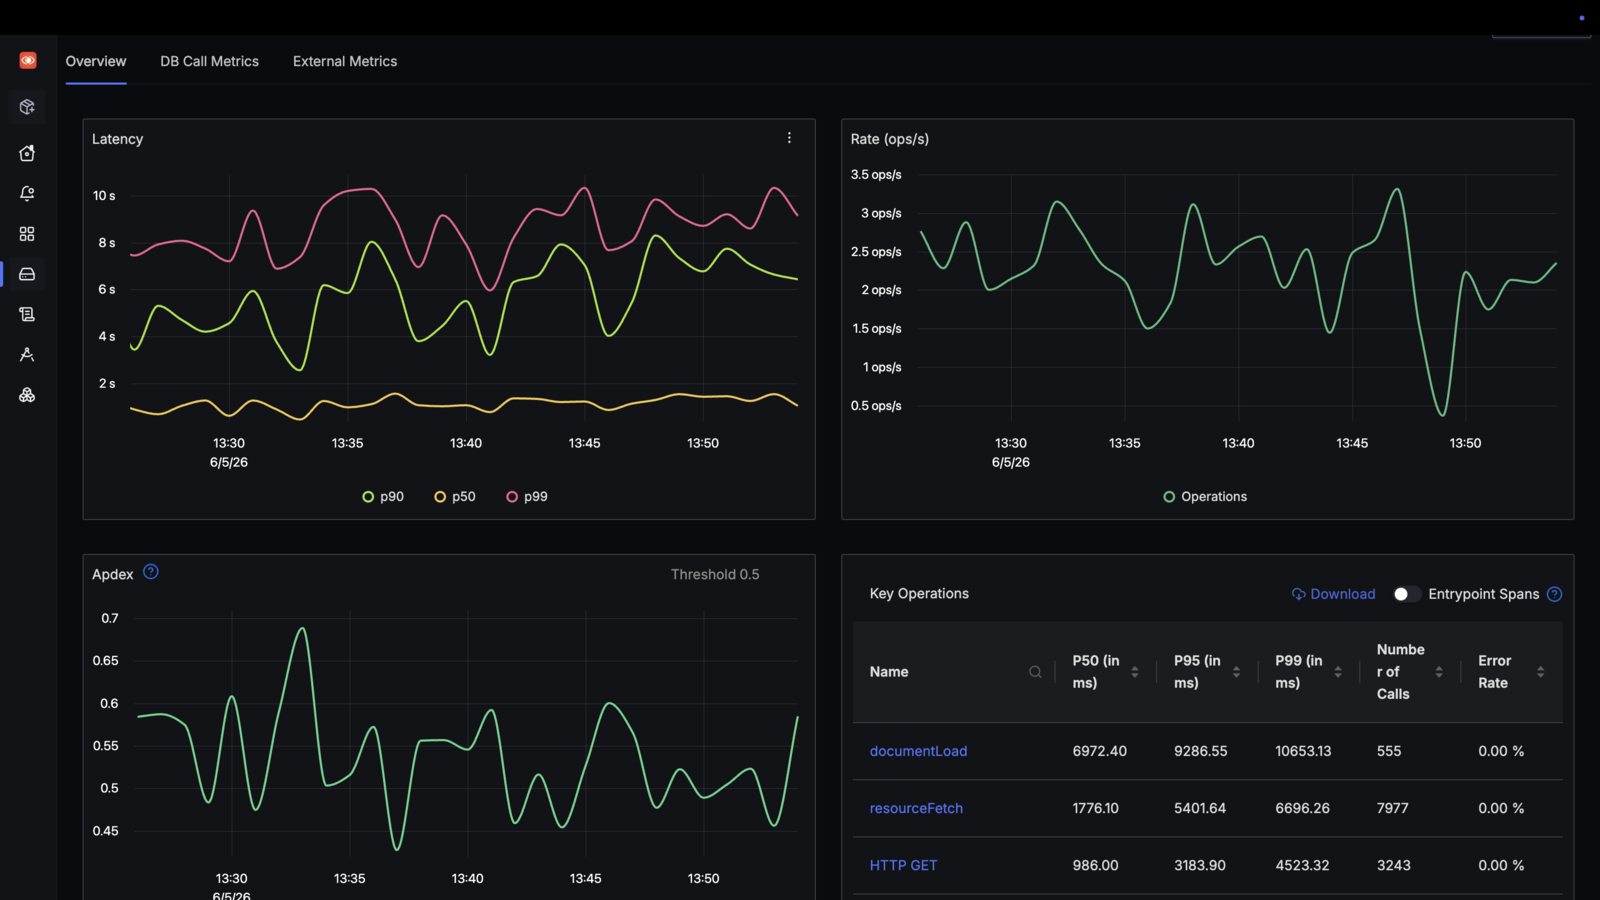
Learn more: APM documentation
Log Management
Ingest, search, aggregate, and correlate logs with traces and metrics using a visual query builder.

Learn more: Log management documentation
Metrics and Dashboards
Build dashboards for application, infrastructure, and custom metrics using Query Builder, PromQL, or ClickHouse SQL.
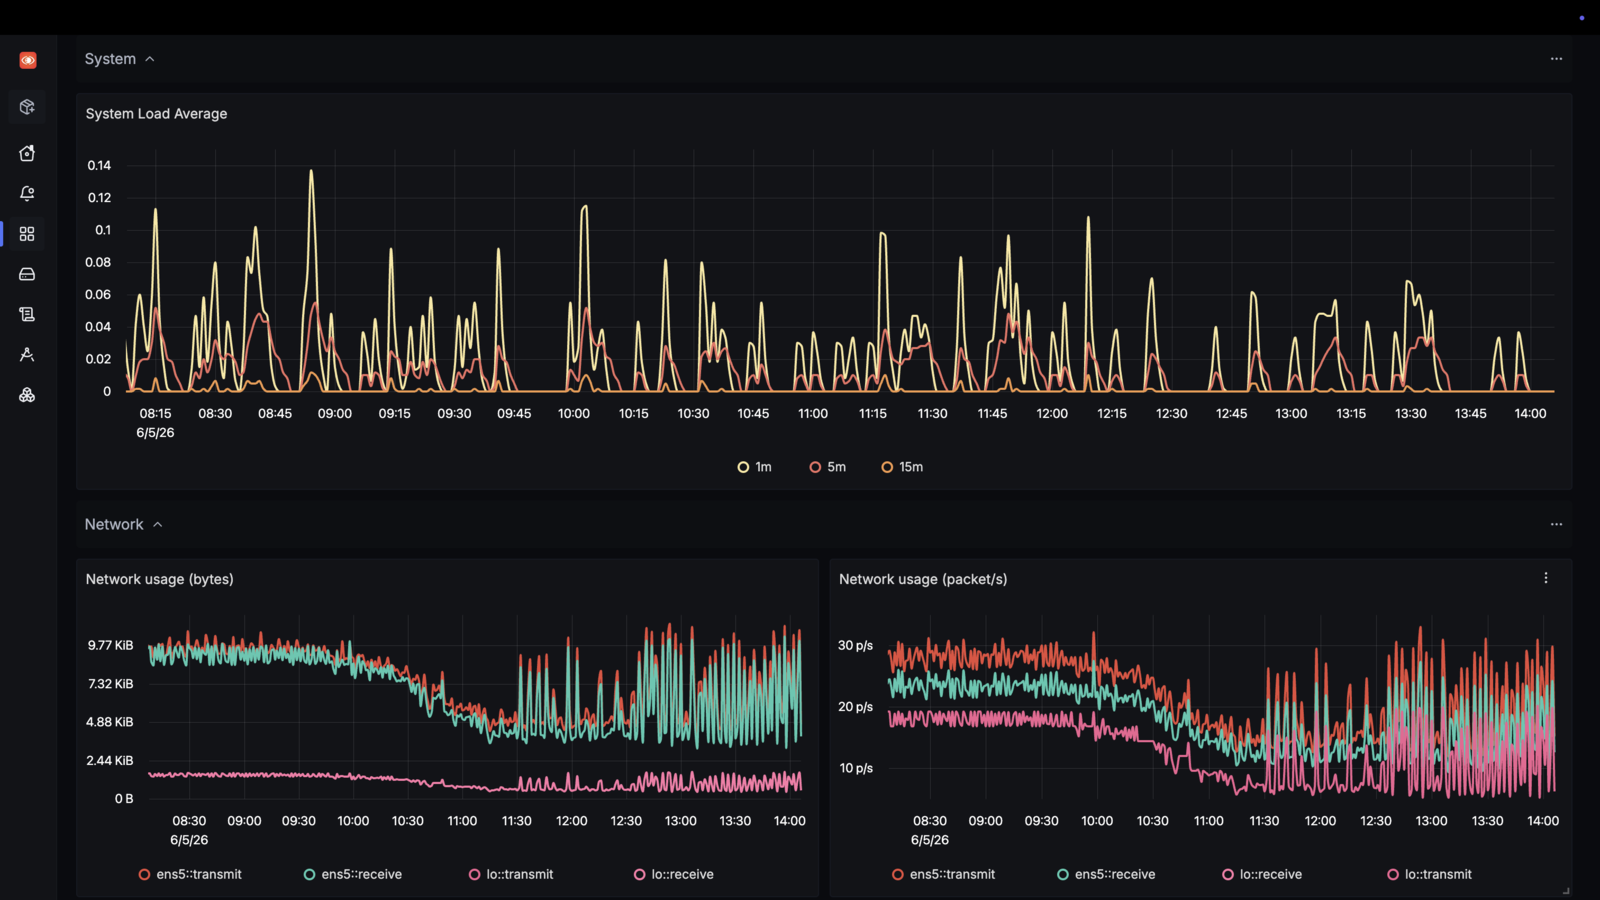
Learn more: Metrics documentation
Infrastructure Monitoring
Monitor Kubernetes clusters, pods, nodes, workloads, and host-level CPU, memory, disk, network, logs, and traces.
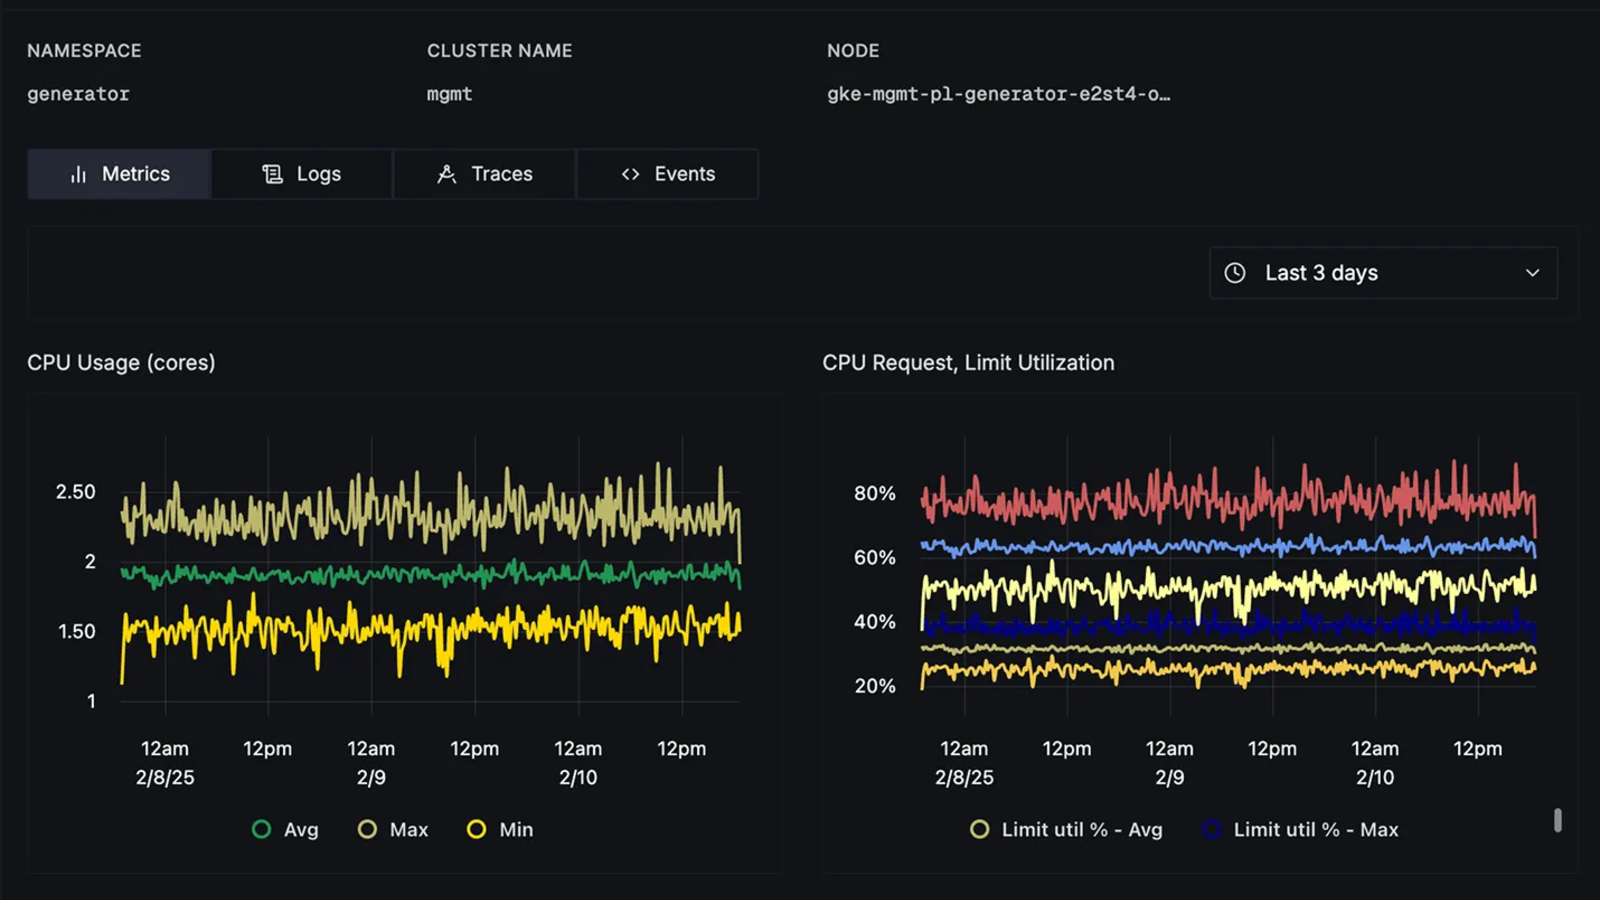
Learn more: Infrastructure monitoring documentation
LLM and AI Observability
Trace LLM apps, RAG pipelines, prompts, tool calls, tokens, latency, and costs alongside application and infrastructure telemetry.
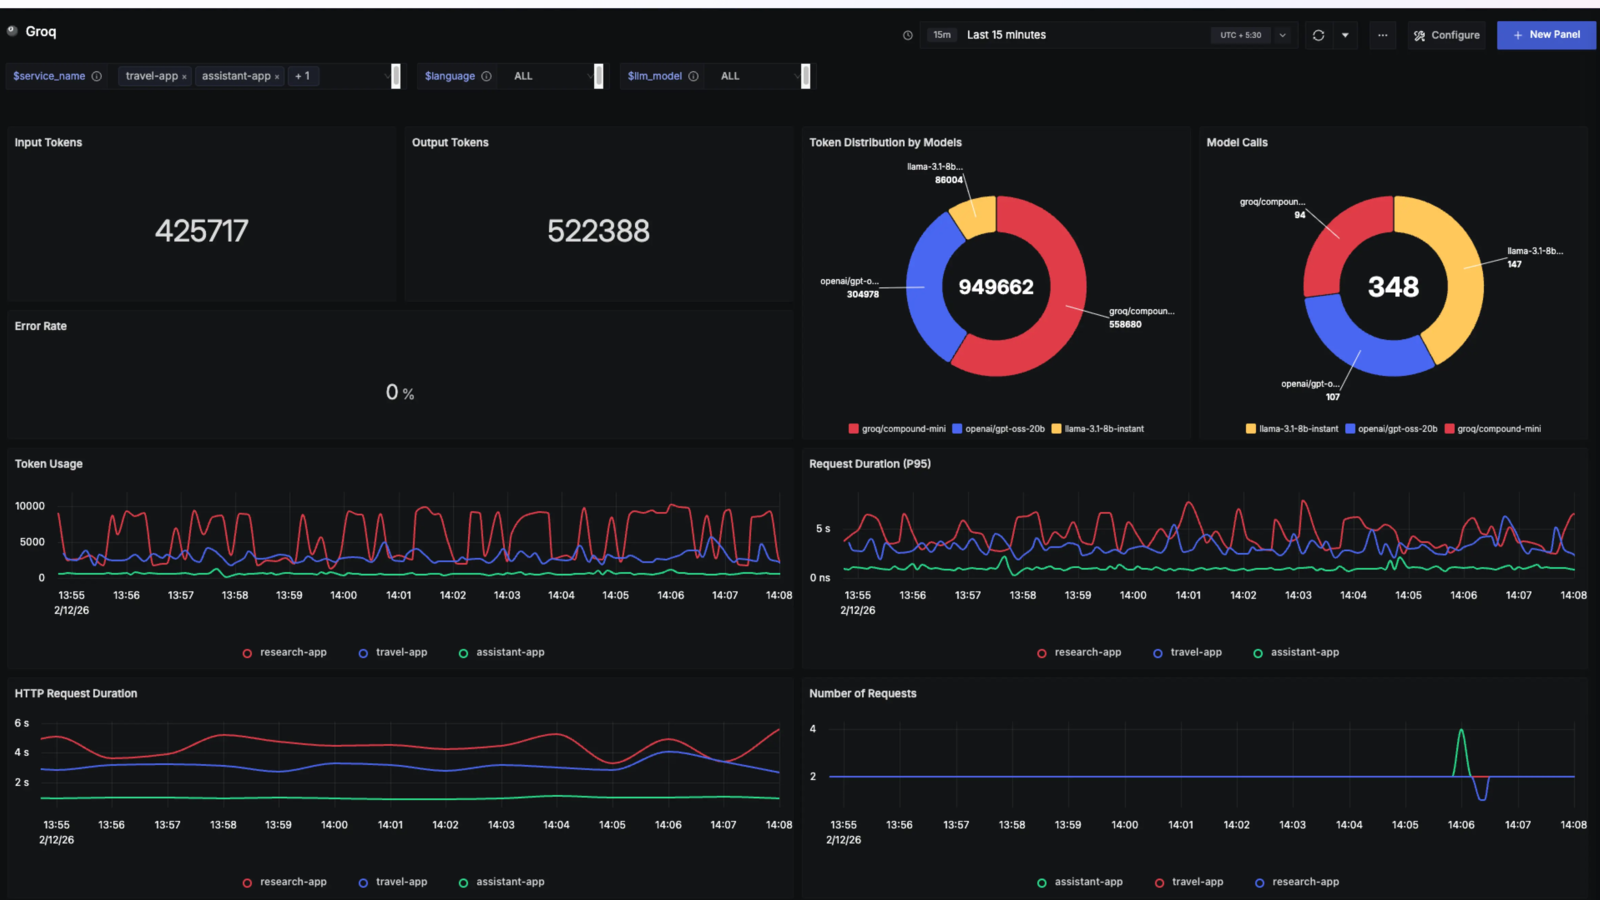
Learn more: LLM observability documentation
Agent-Native Observability and MCP
Use the SigNoz MCP server to bring telemetry into coding agents, or use Noz inside SigNoz to investigate incidents, tune alerts, and build dashboards with production context. Noz is available only on SigNoz Cloud.
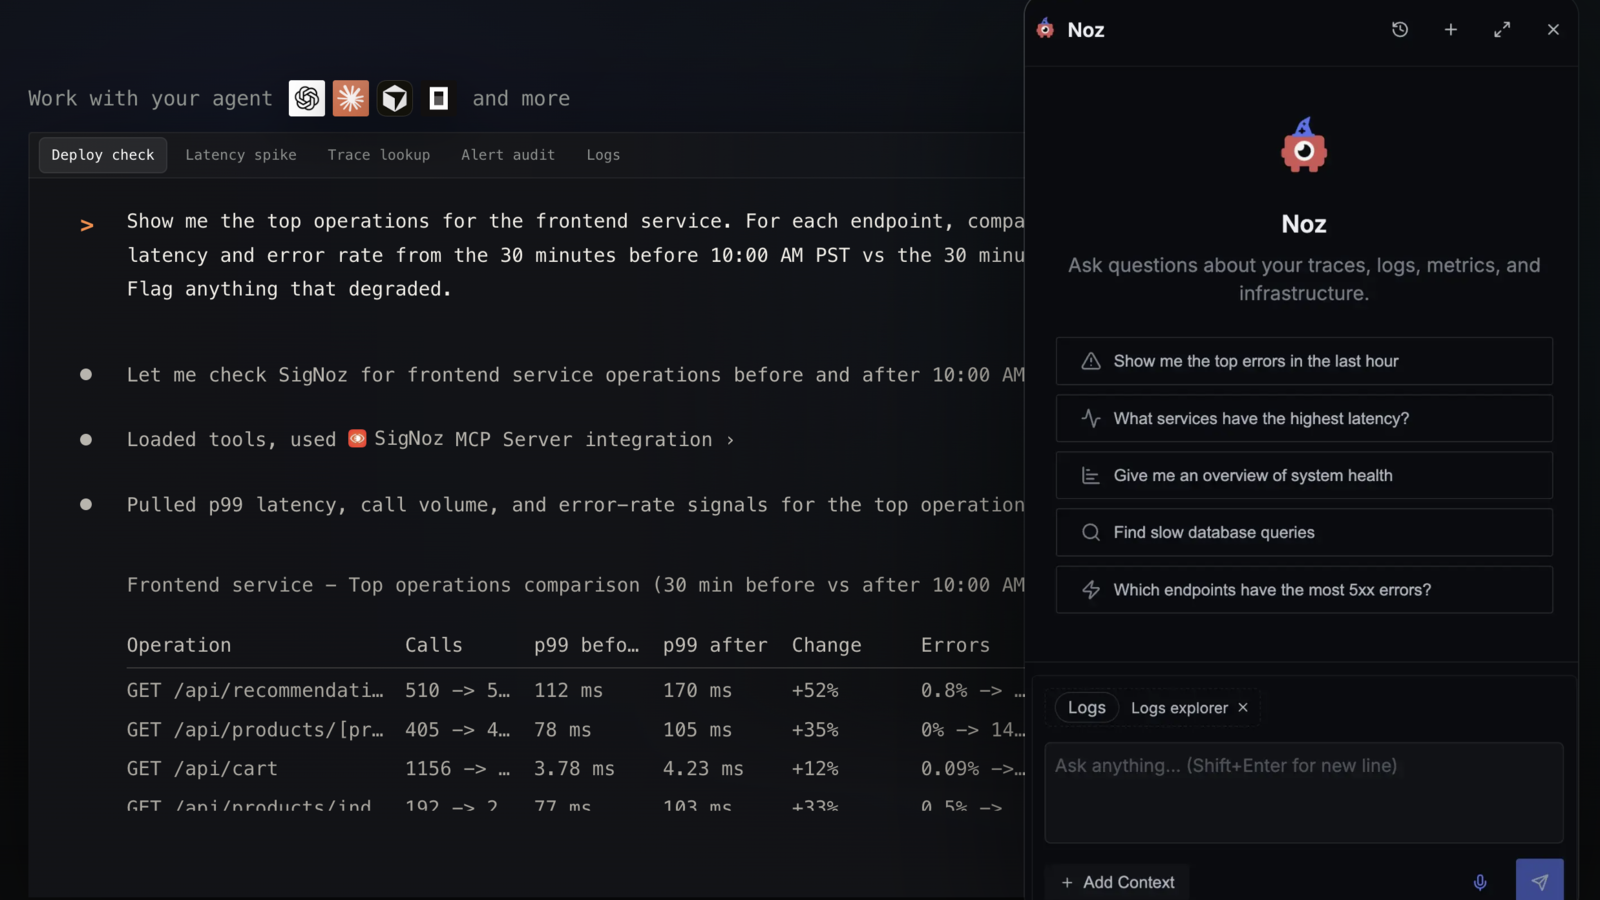
Learn more: SigNoz MCP server docs · Agent skills docs
Distributed Tracing
Follow requests across services with flamegraphs, waterfalls, span events, filters, and trace analytics.
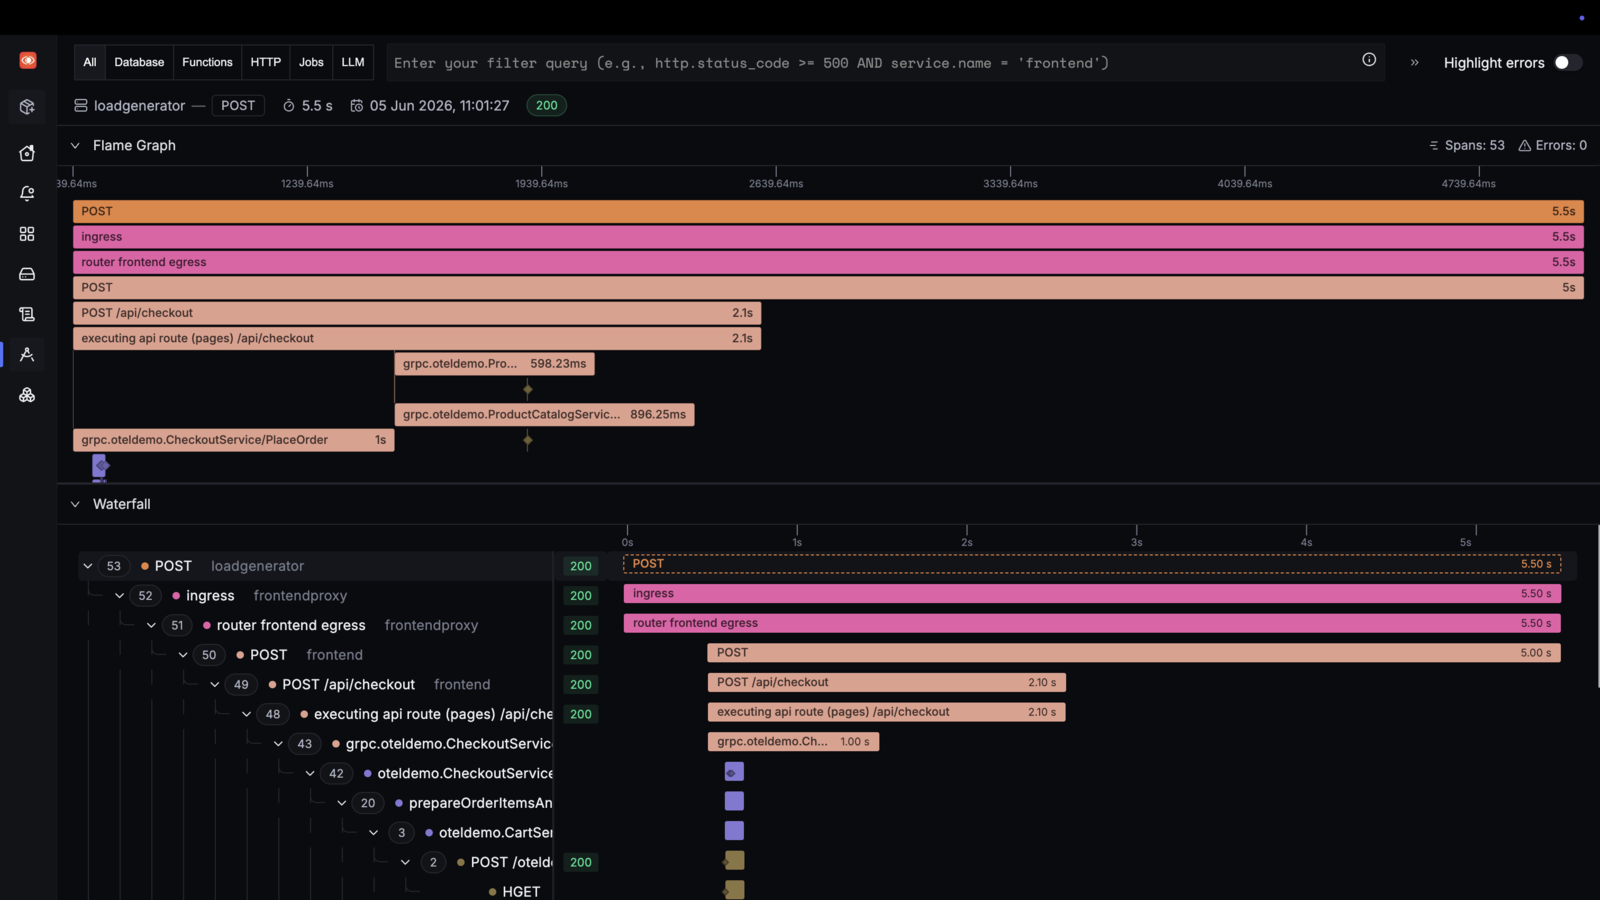
Learn more: Distributed tracing documentation
Trace Funnels
Create funnels from traces to understand request-flow drop-offs, failed transitions, and systemic workflow issues.
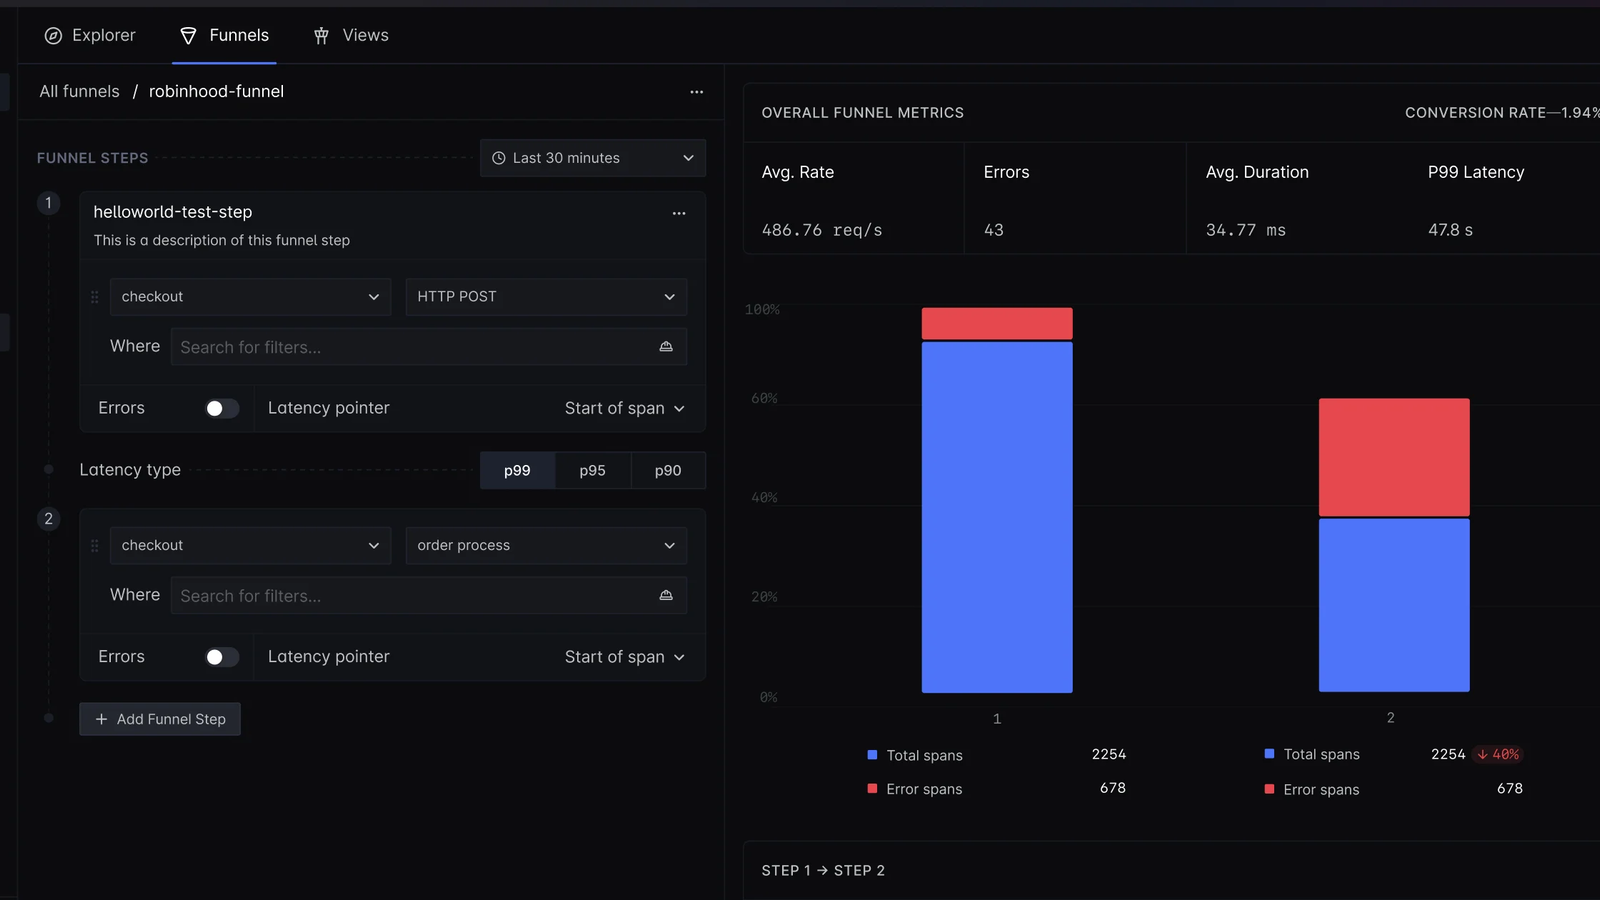
Learn more: Trace funnels documentation
Also monitor: exceptions, alerts, external APIs, and integrations for OpenTelemetry, Prometheus, Kubernetes, cloud providers, language SDKs, application frameworks, databases, and LLM tools.
Why teams use SigNoz
- OpenTelemetry-native
Instrument once with open standards and keep ownership of your telemetry. - Correlated signals
Move from service charts to traces, logs, infra metrics, and exceptions without switching tools. - Single columnar database
Built for high-cardinality, high-volume observability workloads. - Predictable pricing
No per-host pricing, no user-seat pricing, and no special pricing for custom metrics. - Enterprise ready
SOC 2 Type II and HIPAA compliance, RBAC, ingestion controls, custom retention, support, BYOC, and self-hosting.
Getting started
Start on Cloud
Create a managed SigNoz workspace and get your first dashboard without running observability infrastructure.
Self-host SigNoz
Run SigNoz in your own infrastructure with Foundry, Docker, Kubernetes, or Linux.
Foundry · Docker · Kubernetes · Linux
Send data
Instrument applications and infrastructure with OpenTelemetry, Prometheus, language SDKs, and integrations.
Instrumentation · Integrations
Comparisons to familiar tools
SigNoz is often adopted by teams moving from a stack of single-purpose tools or commercial platforms with unpredictable pricing.
Prometheus
Good if you just need metrics. SigNoz keeps metrics, logs, traces, dashboards, and alerts together so teams can debug with correlated context.
Jaeger
Jaeger only does distributed tracing. SigNoz adds metrics, logs, trace analytics, dashboards, alerts, exceptions, and trace-to-log workflows.
Elastic
SigNoz uses columnar database for efficient observability analytics and high-cardinality log workloads, with 50% lower resource requirement compared to Elastic during ingestion. Check the detailed study.
Loki
In the linked benchmark, SigNoz indexed all keys in the test setup, while Loki hit max stream errors when more labels were added. Check the detailed study.
Contributing
We ❤️ contributions big or small. Please read CONTRIBUTING.md to get started with making contributions to SigNoz.
Not sure how to get started? Just ping us on #contributing in our slack community.
As always, thanks to our amazing contributors!
관련 프로젝트 살펴보기
freeCodeCamp/freeCodeCamp
freeCodeCamp.org의 오픈 소스 코드베이스와 커리큘럼입니다. 수학, 프로그래밍, 컴퓨터 과학을 무료로 배울 수 있습니다.
458,973 스타donnemartin/system-design-primer
대규모 시스템 설계 방법을 배우고 시스템 설계 면접을 준비할 수 있습니다. Anki 플래시카드가 포함되어 있습니다.
377,634 스타react/react
웹과 네이티브 사용자 인터페이스를 위한 라이브러리.
252,548 스타vuejs/vue
Vue 2 저장소입니다. Vue 3은 https://github.com/vuejs/core를 방문하세요.
212,623 스타