
Rello/analytics
Rello/analytics has 138 GitHub stars and 39 forks. GitHot measured 0 stars in 24 hours and 0 in 7 days. Last checked 2026-11-11 02:09 UTC. Last push 2026-11-03.
Analytics - Open source data warehouse and reporting for Nextcloud
측정된 스타 증가
- in 24h
- 0
- in 7 days
- 0
- in 15 days
- 업데이트 지연
- in 1 month
- 업데이트 지연
서로 겹치는 기간의 순증가량이며 일별 합계가 아닙니다. 측정값이 없으면 비워 둡니다. 스타는 관심도를 나타내며 품질을 보장하지 않습니다.
README.md
OriginalAnalytics for Nextcloud
Business intelligence and reporting within Nextcloud.
Turn operational data into a shared basis for decisions. Analytics helps business teams connect data sources, monitor key performance indicators, and publish interactive reports and management dashboards in their existing Nextcloud environment.
From recurring departmental reports to executive overviews, Analytics brings data preparation, visualization, and collaboration into one workflow. Your Analytics datasets and reports are hosted in your Nextcloud instance, under your organization's control.
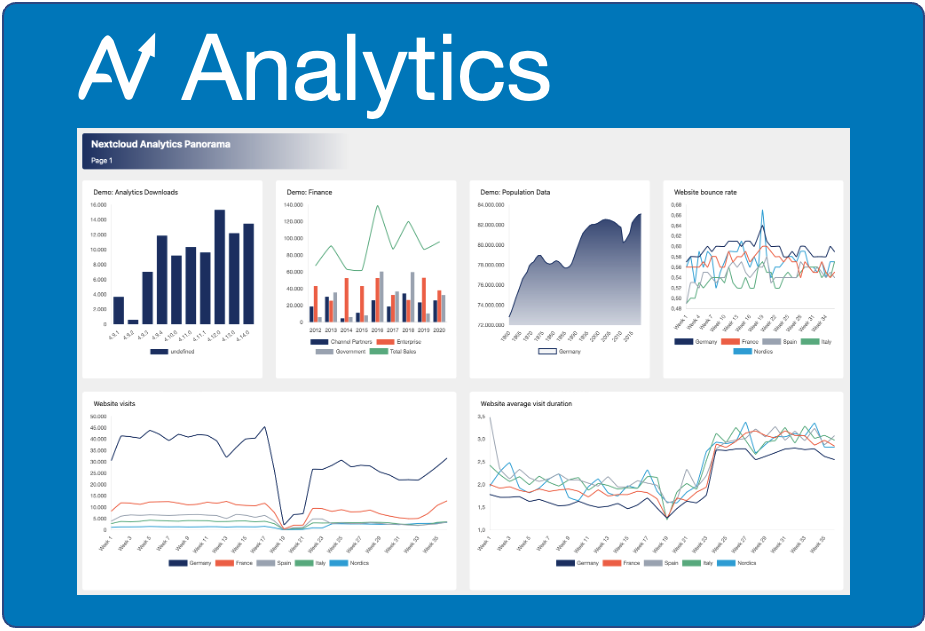
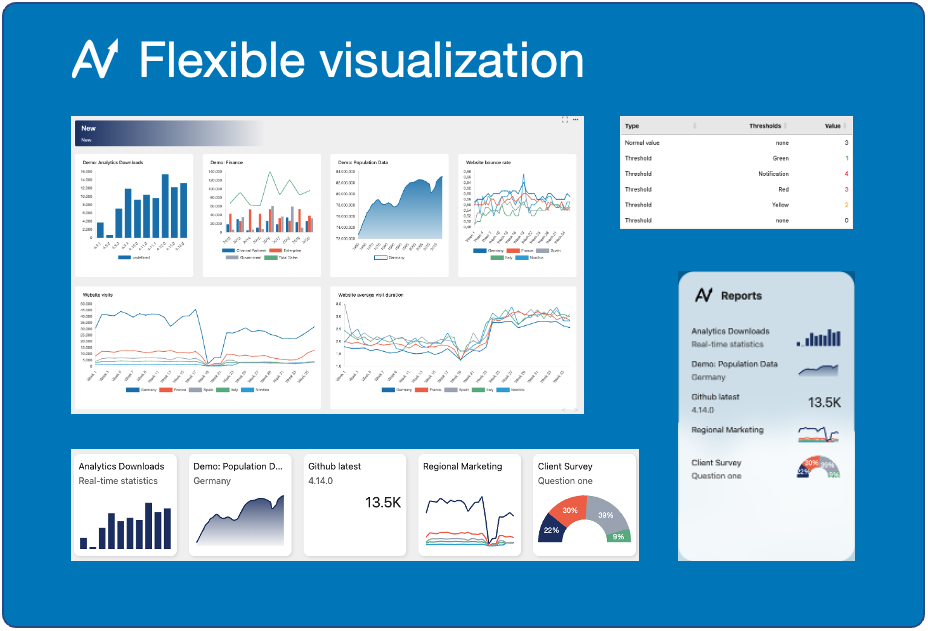
Business value
- Give teams a shared view of performance. Bring reports together in panoramas: multi-page dashboards combining charts, tables, text, and images.
- Reduce recurring reporting work. Reuse datasets across reports and schedule data loads instead of repeating manual imports.
- Explore the drivers behind the numbers. Filter, drill down, aggregate, and calculate measures using visual configuration and live previews.
- Keep reporting close to collaboration. Share reports and panoramas with Nextcloud users and groups, or reach external audiences through share links.
- Retain control of your reporting environment. Run Analytics within Nextcloud and choose which data sources to connect and which reports to share.
Typical business applications
| Team | Example use |
|---|---|
| Management | Combine departmental KPIs and commentary into a shared performance overview. |
| Finance and controlling | Compare revenue, costs, and budget figures from connected files or imported datasets. |
| Operations | Track volumes, service metrics, and trends; highlight values that cross defined thresholds. |
| Project and service teams | Turn survey responses and structured operational data into progress and quality reports. |
Capabilities
Connect and prepare data
- Bring together spreadsheets, business systems, and data from Nextcloud Files, Forms, and Tables.
- Configure data sources visually with intuitive field selection and live data previews.
- Combine current figures and historical data for recurring reporting and long-term comparisons.
- Reuse your data across reports to give teams a consistent basis for analysis.
Analyze and present
- Build interactive charts and tables with visual configuration and live previews.
- Explore performance with filters, drilldowns, calculated measures, and trends.
- Assemble multi-page panoramas with reports, explanatory text, and images.
- Export dashboards and charts for meetings, presentations, and stakeholder updates.
Automate and collaborate
- Keep reports current with scheduled updates and automated workflows.
- Highlight exceptions with color coding and notifications.
- Share with teams and external stakeholders while controlling access to your reports.
- Bring live charts and tables into everyday work across Nextcloud.
- Explore deeper insights with Nextcloud Assistant. Ask questions about your data in natural language.
Documentation
Languages
Support translations on Transifex.
Maintainers
- Marcel Scherello (author, project leader)


관련 프로젝트 살펴보기
Asabeneh/30-Days-Of-Python
30 Days of Python 프로그래밍 챌린지는 Python 프로그래밍 언어를 30일 동안 배우기 위한 단계별 가이드입니다. 이 챌린지는 100일 이상 걸릴 수 있습니다. 자신의 속도에 맞춰 진행하세요. 다음 동영상도 도움이 될 수 있습니다: https://www.youtube.com/channel/UC7PNRuno1rzYPb1xLa4yktw
78,560 스타grafana/grafana
개방적이고 조합 가능한 옵저버빌리티 및 데이터 시각화 플랫폼입니다. Prometheus, Loki, Elasticsearch, InfluxDB, Postgres 등 여러 소스의 메트릭, 로그, 트레이스를 시각화합니다.
77,830 스타redis/redis
실시간 데이터 기반 애플리케이션을 구축하는 개발자에게 Redis는 가장 선호되고, 가장 빠르며, 기능이 가장 풍부한 캐시, 데이터 구조 서버이자 문서 및 벡터 쿼리 엔진입니다.
77,395 스타apache/superset
Apache Superset는 데이터 시각화 및 데이터 탐색 플랫폼입니다.
75,473 스타