
yuankunzhang/charming
yuankunzhang/charming has 2,610 GitHub stars and 120 forks. GitHot measured +1 stars in 24 hours and +2 in 7 days. Last checked 2026-11-12 14:40 UTC. Last push 2026-10-31.
A visualization library for Rust
計測したスター増加
- 24時間
- +1
- 7日間
- +2
- 15日間
- 履歴を収集中
- 1か月
- 履歴を収集中
期間ごとの純増数です。期間は重複しており、日別の値ではありません。未計測の値は空欄です。スター数は注目度の指標であり、品質の保証ではありません。
README.md
オリジナルCharming - A Rust Visualization Library


Charming is a powerful and versatile chart rendering library for Rust that leverages the power of Apache ECharts to deliver high-quality data visualizations. Built with the Rust programming language, this library aims to provide the Rust ecosystem with an intuitive and effective way to generate and visualize charts, using a declarative and user-friendly API.
Highlights:
- Easy-to-use, declarative API.
- Abundant chart types with rich and customizable chart themes and styles.
- Ready to use in WebAssembly environments.
- Rendering to multiple formats, including HTML, SVG, PNG, JPEG, GIF, WEBP, PNM, TIFF, TGA, DDS, BMP, ICO, HDR, OPENEXR, FARBFELD, AVIF, and QOI.
JavaScript callbacks and saved charts
The next incompatible release (planned for 0.7.0) stores JavaScript source in
the same form on native and WASM targets. This change does not bump the package
version or publish a release. JsFunction::from accepts a complete function
expression; JsFunction::new_with_args(args, body) builds one. Construction,
cloning and serialization do not execute JavaScript. Equality compares source
text and ordering is lexicographic.
Save charts with serde_json::to_string(&chart) and read them with
serde_json::from_str::<Chart>(...). Function fields use
{"type":"function","source":"function(value) { return value * 2; }"}.
Dataset transform expressions use {"type":"expression","source":"..."}.
Both tags are checked on read. Formatter strings remain strings, including
literal #*#*#*# markers. Old callback JSON is no longer accepted as code;
there is no legacy reader. Dataset sources must precede transforms.
Chart no longer implements Display. Replace chart.to_string() with
chart.to_javascript()? to export an expression that creates runtime ECharts
options, or use Serde for JSON. HTML and SSR use that same expression.
WasmRenderer::update(&instance, &chart) now returns Result<(), EchartsError>;
handle it as you would render.
Only supply trusted JavaScript source. HTML requires inline scripts to be
allowed. HTML extension/theme registration also uses eval; exported option
expressions alone do not. Export and HTML generation do
not check JavaScript syntax: errors appear when the browser executes the code.
Serialization failures return SerializationError, SSR execution failures
return JsRuntimeError, and synchronous WASM preparation or ECharts call
failures return WasmError. WASM evaluates source with eval, so its page
must allow it. Preparation finishes before ECharts initialization or update.
On setOption failure, WASM disposes an instance created by that render call
and retains an existing instance. Updates do not promise rollback. Errors from
later interactive callbacks belong to the JavaScript runtime.
Charming now uses ECharts 6.1.0 and GL 2.1.0 with the v6 default appearance. See the ECharts 6 migration guide for calendar arrays, named Custom renderers, new chart/layout options, resource registration and browser instance methods. The DataZoom and callback integration from #221 remains part of this foundation, with PanagiotisS and Yuankun's contribution credits preserved.
Themes
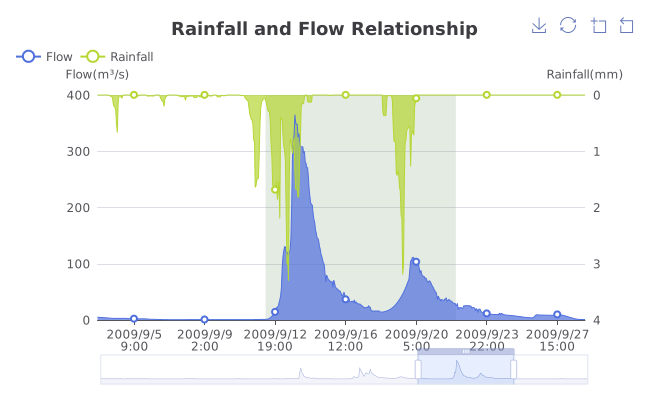 Default |
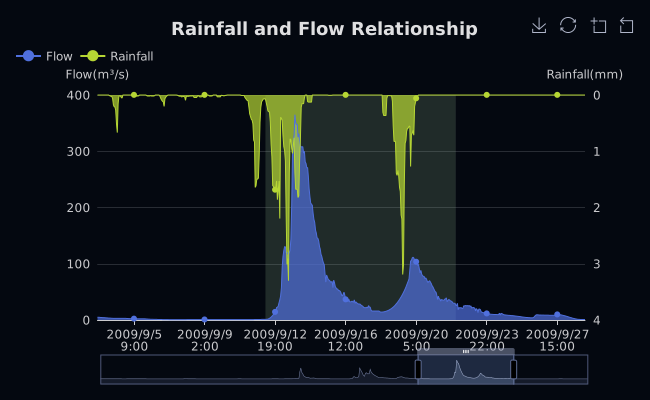 Dark |
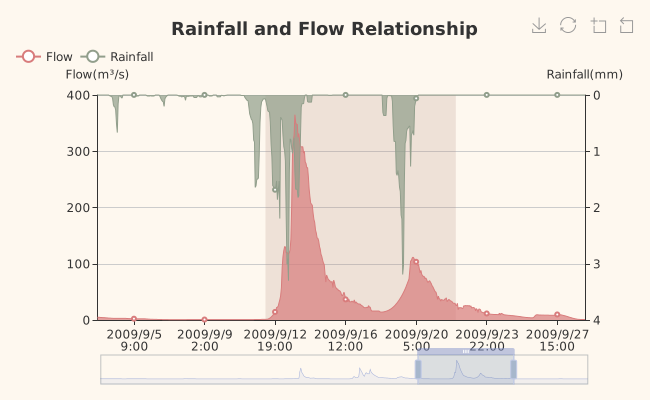 Vintage |
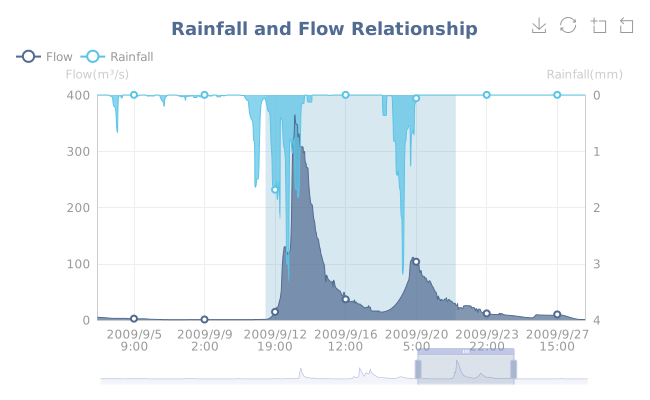 Westeros |
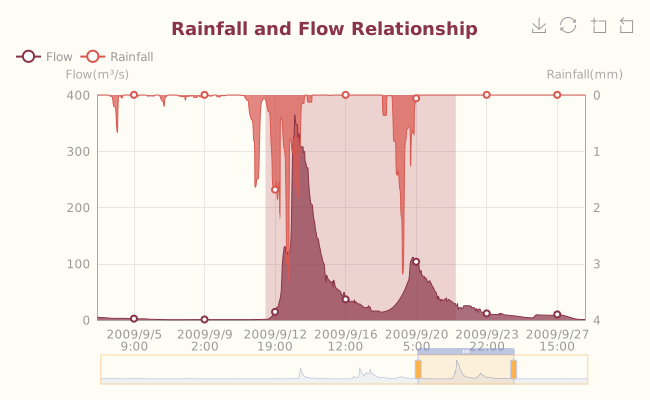 Essos |
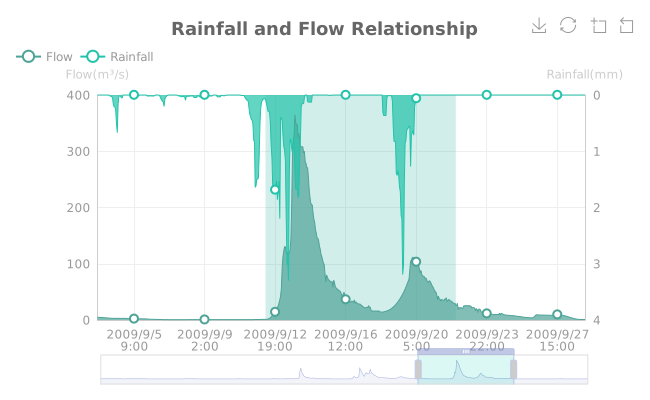 Wonderland |
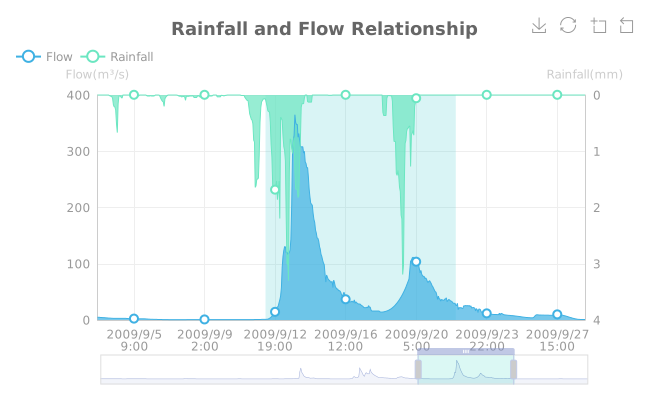 Walden |
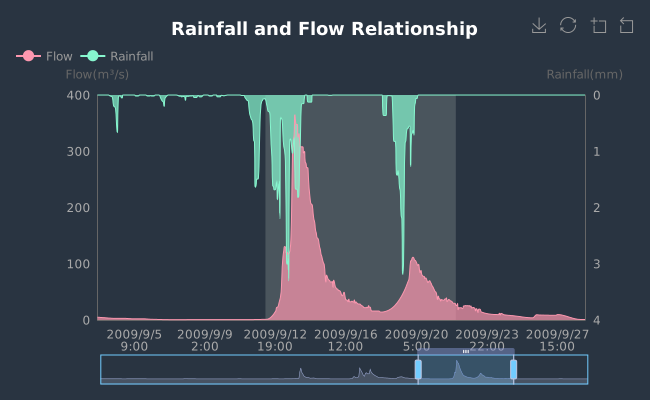 Chalk |
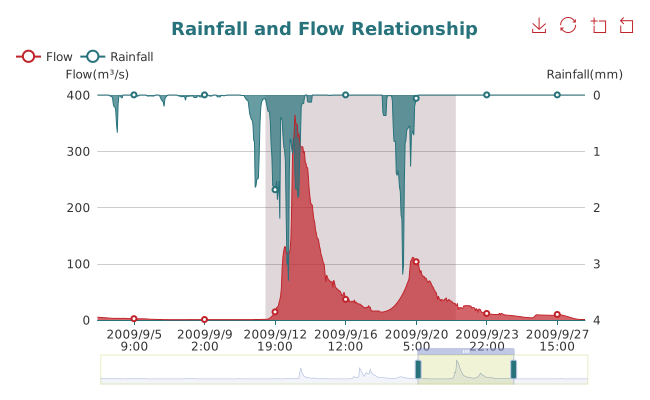 Infographic |
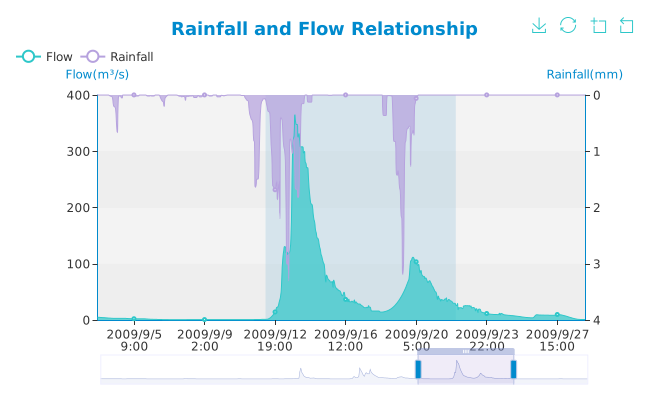 Macarons |
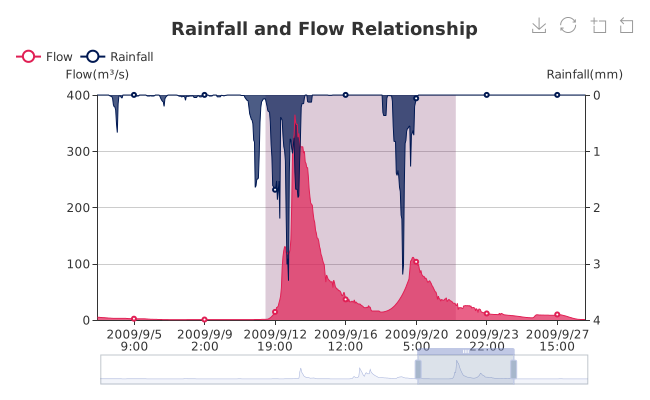 Roma |
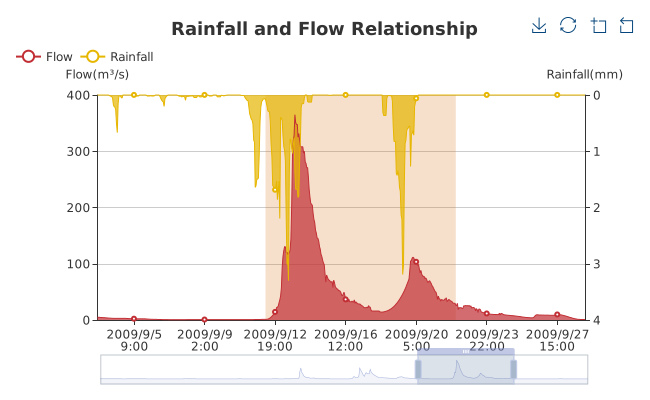 Shine |
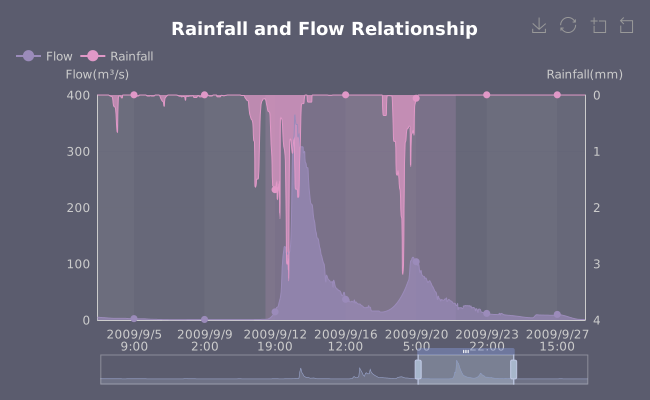 Purple Passion |
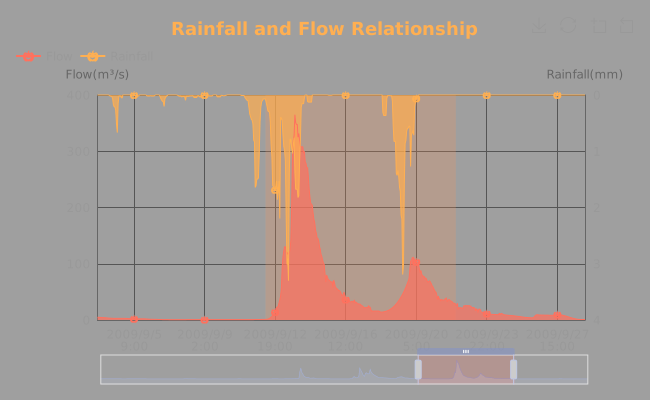 Halloween |
Future versions of Charming will support custom themes.
Basic Usage
Add charming as a dependency:
$ cargo add charming
Refer to the documentation of the Chart struct for how to create a chart with various components.
Once you create a chart, you can render it into various format. Charming provides three types of renderers:
- HTML renderer:
HtmlRendererrenders a chart into an HTML fragments and offloads the actual rendering to user's web browser for an interactive, seamless experience. This renderer is useful when you want to render a chart on the client side, e.g., in a web application. - Image renderer:
ImageRendererrenders a chart into an image file. This renderer makes use of an embed deno_core engine to execute the JavaScript code of Echarts and generate an image file. This renderer is disabled by default, and you need to enable thessr(Server-Side Rendering) feature to use it. - WASM renderer:
WasmRendererrenders a chart in a WebAssembly runtime. This renderer is disabled by default, and you need to enable thewasmfeature to use it. Note that thewasmfeature andssrfeature are mutually exclusive.
Here is an example of drawing a simple pie chart into an SVG file:
use charming::{
    component::Legend,
    element::ItemStyle,
    series::{Pie, PieRoseType},
    Chart, ImageRenderer
};

fn main() {
    let chart = Chart::new()
        .legend(Legend::new().top("bottom"))
        .series(
            Pie::new()
                .name("Nightingale Chart")
                .rose_type(PieRoseType::Radius)
                .radius(vec!["50", "150"])
                .center(vec!["50%", "50%"])
                .item_style(ItemStyle::new().border_radius(8))
                .data(vec![
                    (40.0, "rose 1"),
                    (38.0, "rose 2"),
                    (32.0, "rose 3"),
                    (30.0, "rose 4"),
                    (28.0, "rose 5"),
                    (26.0, "rose 6"),
                    (22.0, "rose 7"),
                    (18.0, "rose 8"),
                ]),
        );

    let mut renderer = ImageRenderer::new(1000, 800);
    renderer.save(&chart, "/tmp/nightingale.svg");
}
This code creates the following SVG file:

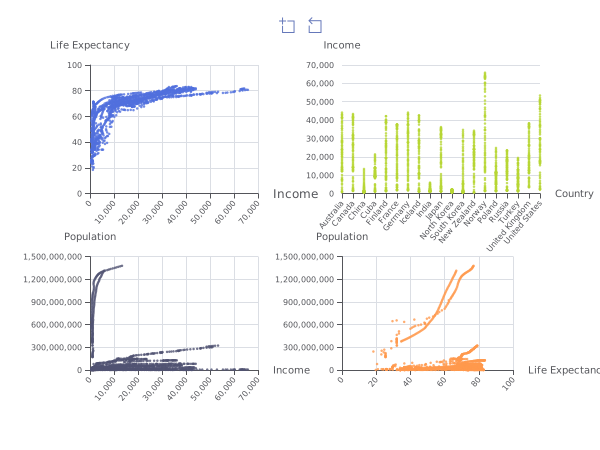
As another example, the code file gallery/src/dataset/encode_and_matrix.rs draws a complex chart with four sub-charts:
MSRV
The minimum supported Rust version (MSRV) is declared in charming/Cargo.toml. The fixed development toolchain in rust-toolchain.toml agrees with it. See CONTRIBUTING.md for the MSRV policy and verification commands.
For development, enter the Linux environment with nix develop and use
python3 scripts/check.py run all. Native all-features linting does not verify
the WASM target or every feature combination; CI checks WASM compilation and
the five examples separately.
Crate Feature Flags
The following feature flags are available, note that ssr and wasm can't be used together:
ssr- Enables theImageRenderer, which provides the capability to generate image files.ssr-rasterEnables raster support to theImageRenderer(png, jpg, etc.)wasm- Enables theWasmRenderer, which provides the capability to render charts in WebAssembly runtime.
Renderers
// Use HtmlRenderer.
use charming::HtmlRenderer;

// Chart dimension 1000x800.
let renderer = HtmlRenderer::new("my charts", 1000, 800);
// Render the chart as HTML string.
let html_str = renderer.render(&chart).unwrap();
// Save the chart as HTML file.
renderer.save(&chart, "/tmp/chart.html").unwrap();


// Use ImageRenderer. The `ssr` feature needs to be enabled.
use charming::{ImageRenderer, ImageFormat};

// Chart dimension 1000x800.
let mut renderer = ImageRenderer::new(1000, 800);
// Render the chart as SVG string.
renderer.render(&chart).unwrap();
// Render the chart as PNG bytes.
renderer.render_format(ImageFormat::Png, &chart).unwrap();
// Save the chart as SVG file.
renderer.save(&chart, "/tmp/chart.svg").unwrap();
// Save the chart as PNG file.
renderer.save_format(ImageFormat::Png, &chart, "/tmp/chart.png");


// Use WasmRenderer. The `wasm` feature needs to be enabled.
use charming::WasmRenderer;

// Chart dimension 1000x800.
let renderer = WasmRenderer::new(1000, 800);
// Render the chart in the WebAssembly runtime
renderer.render("my-chart-id", &chart).unwrap();
Themes
Charming supports a number of themes out of the box. You can use the Theme enum to specify a theme for your chart. For instance, the following code snippet shows how to use the Westeros theme:
use charming::{Chart, ImageRenderer};
use charming::theme::Theme;
use charming::component::Title;

ImageRenderer::new(1000, 800).theme(Theme::Westeros).save(
    &Chart::new().title(Title::new().text("Westeros")),
    "/tmp/westeros.svg",
);
Future versions of Charming will support custom themes.
Gallery
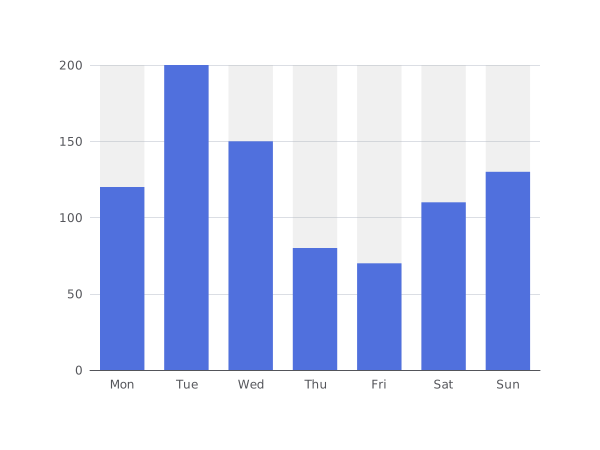
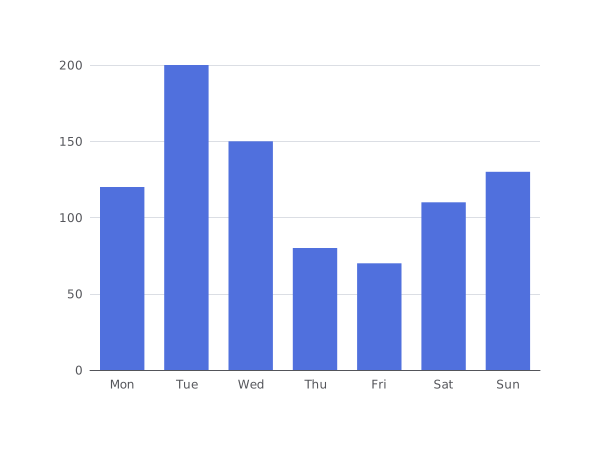
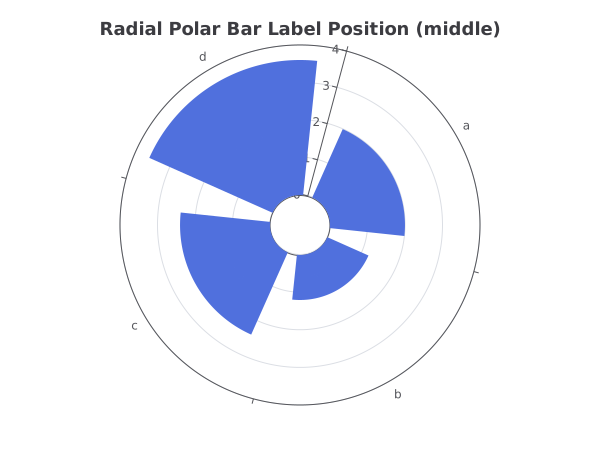
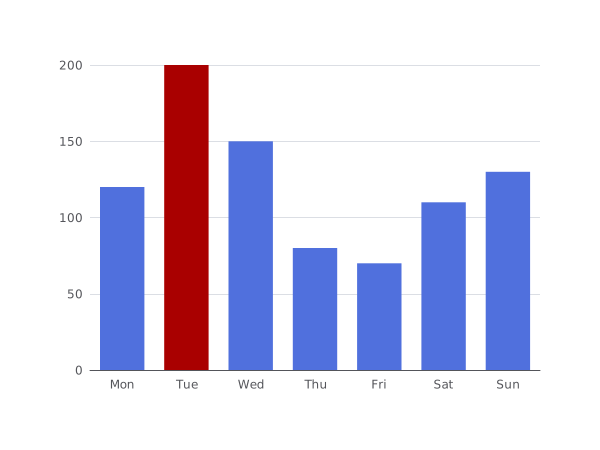
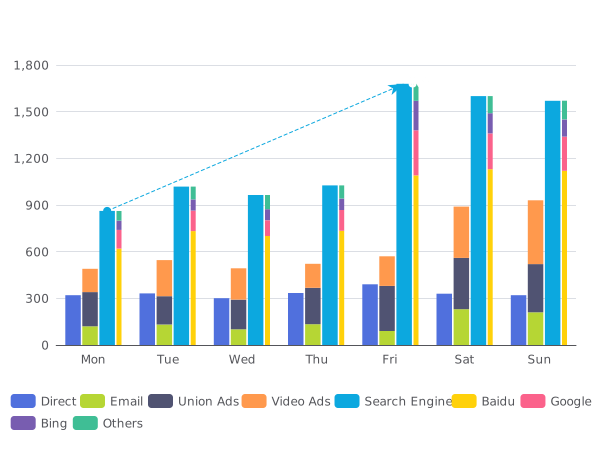
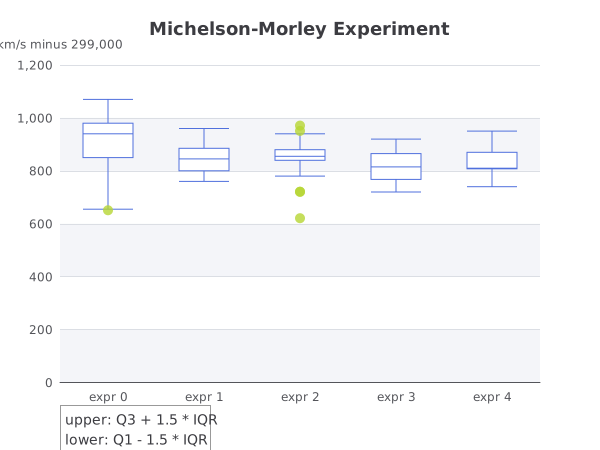
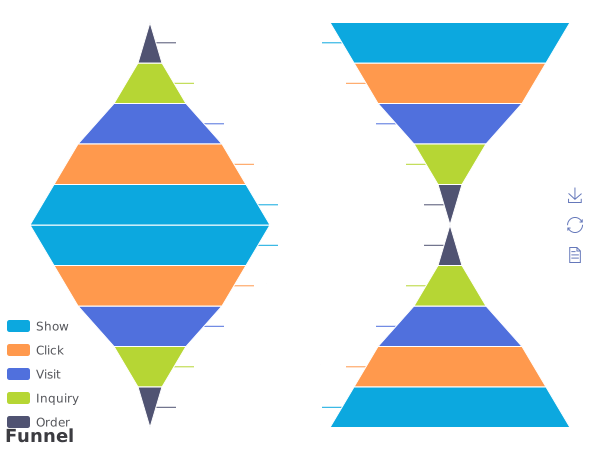
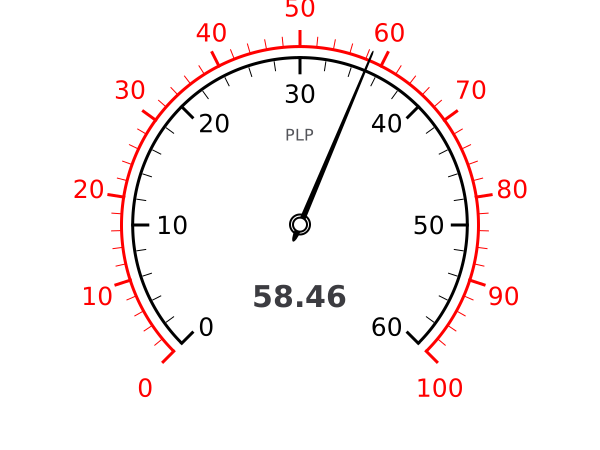
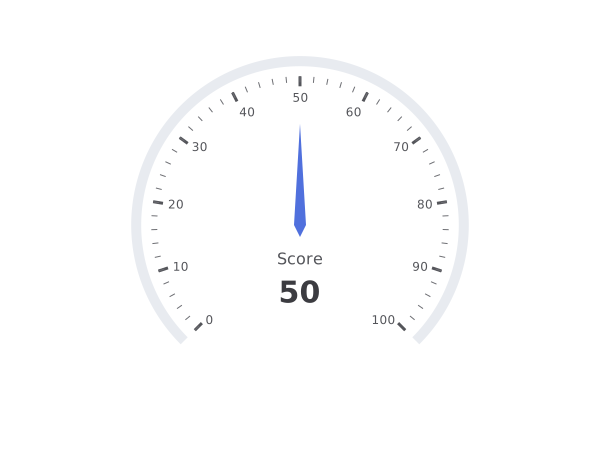
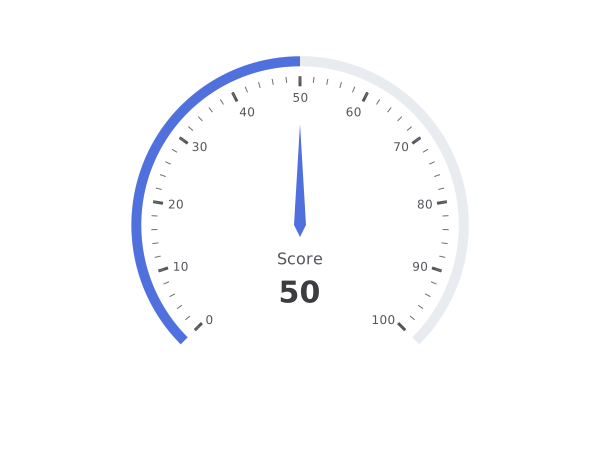
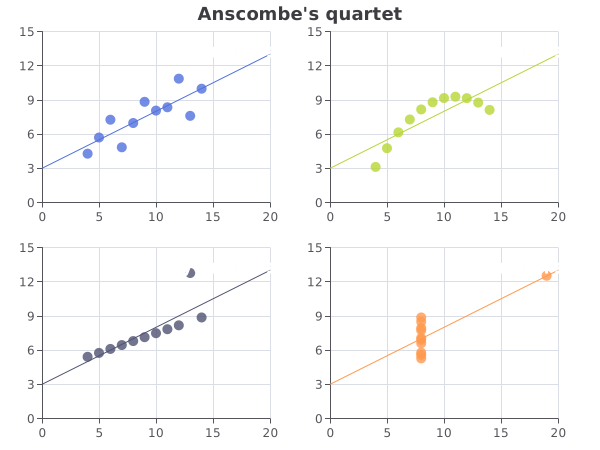
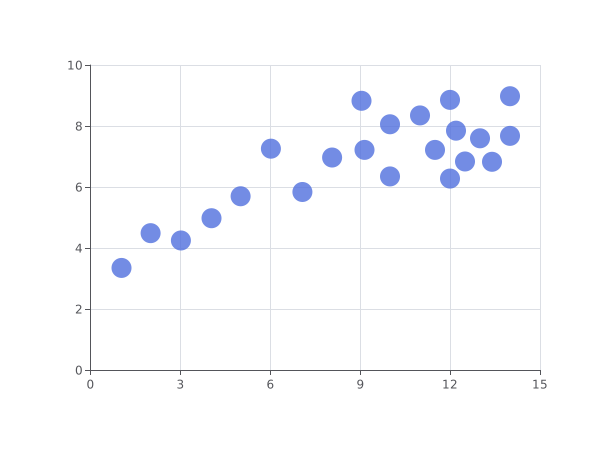
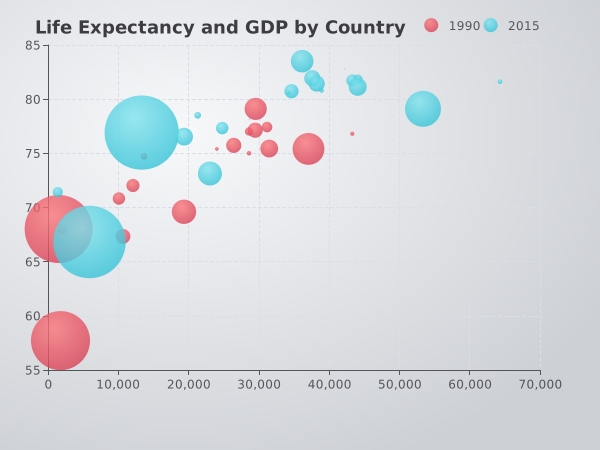
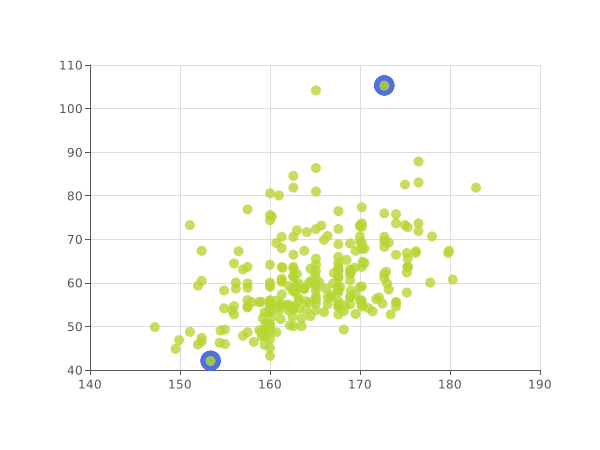
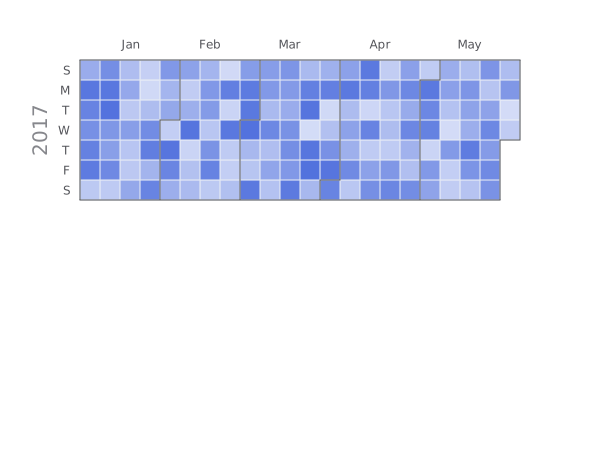
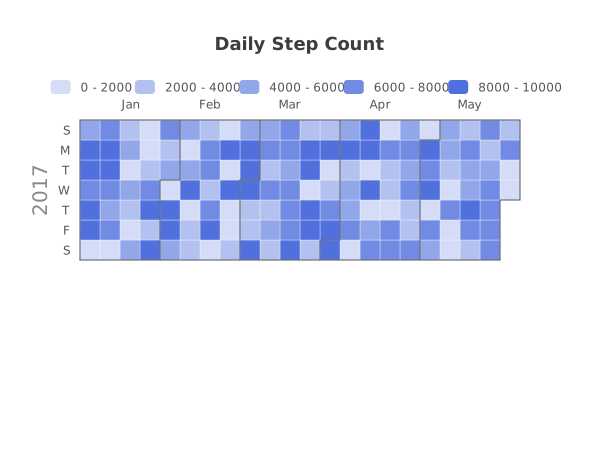
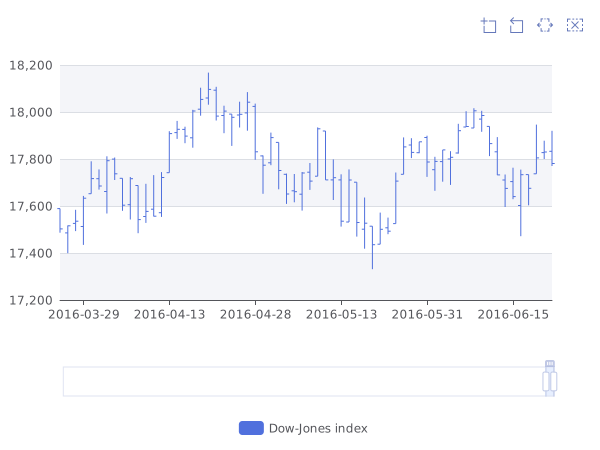
Here are some selected chart examples. Click on any single chart to view its source code file.
You can also clone the repo and run cargo run --bin gallery to view the interactive charts on the rendered HTML page.
Bar Charts
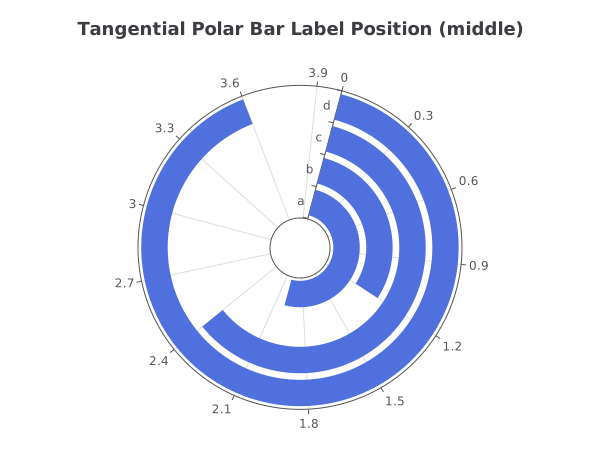
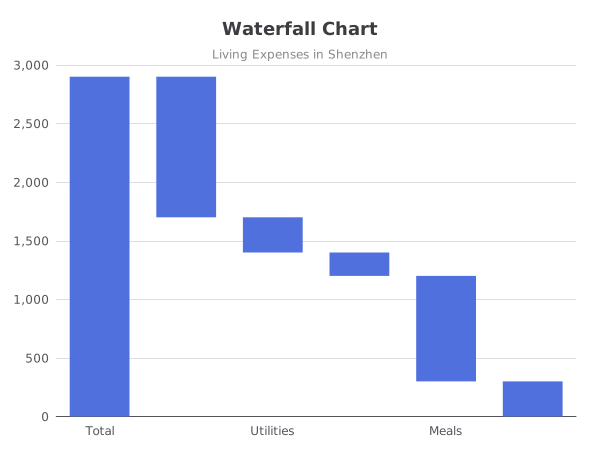
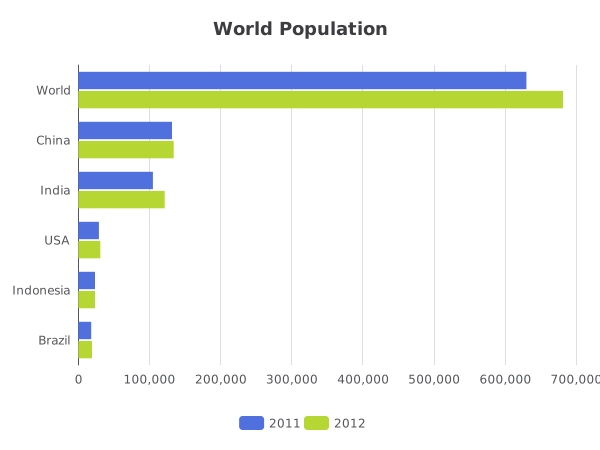
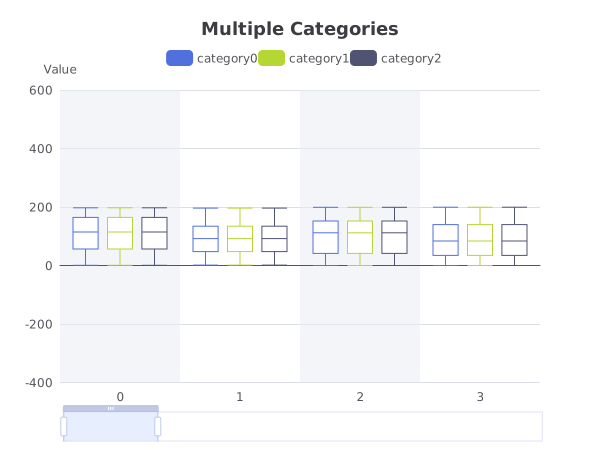
Boxplot Charts
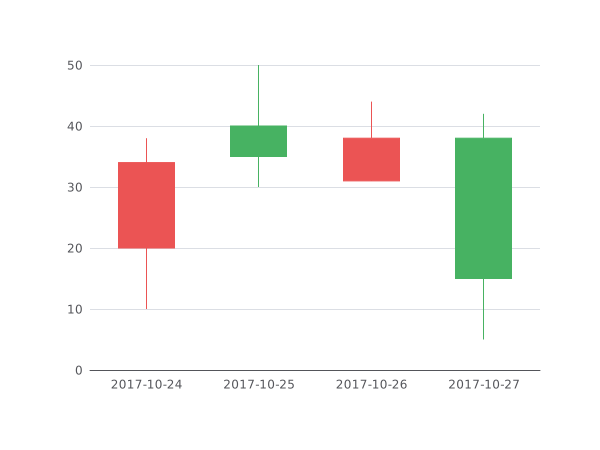
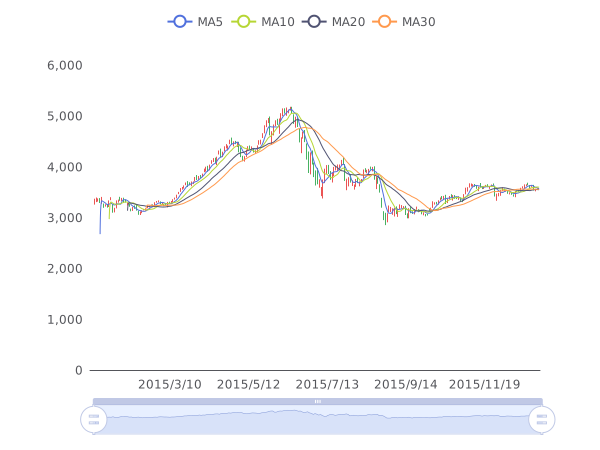
Candlestick Charts
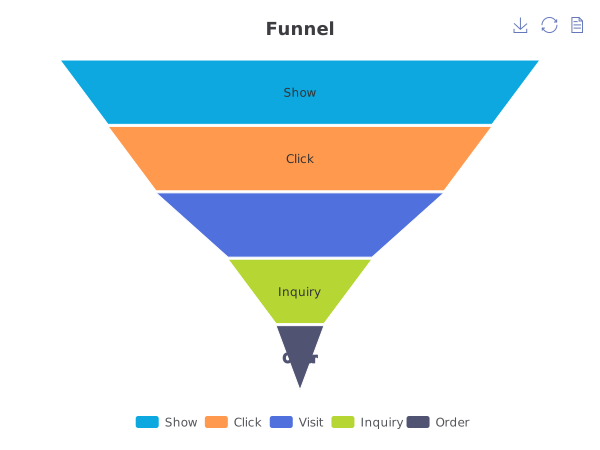
Funnel Charts
Gauge Charts
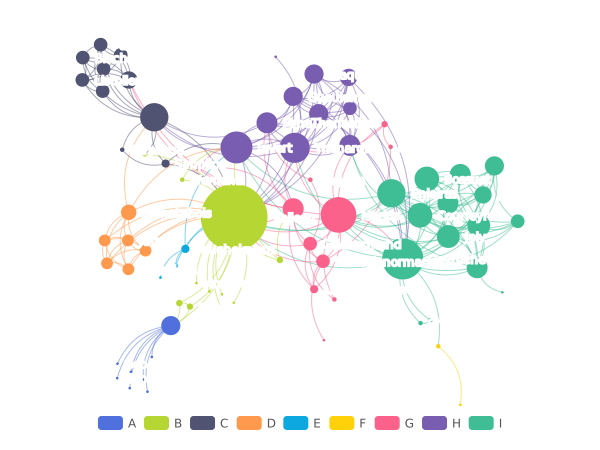
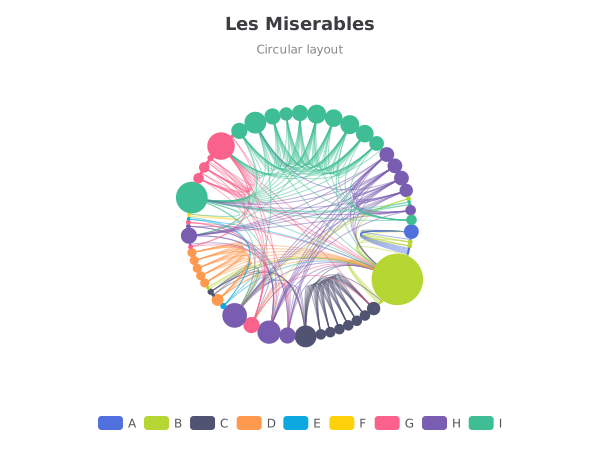
Graph Charts
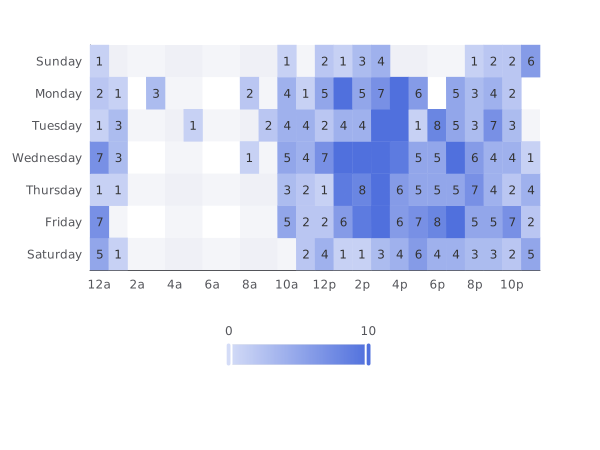
Heatmap Charts
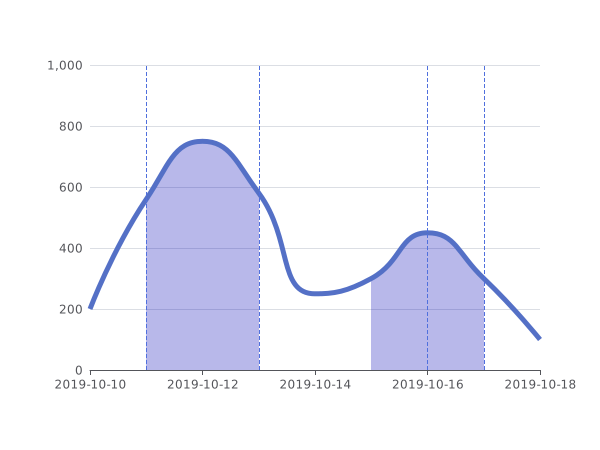
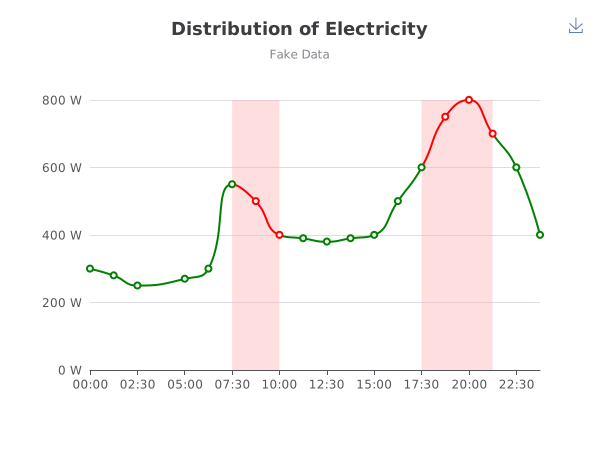
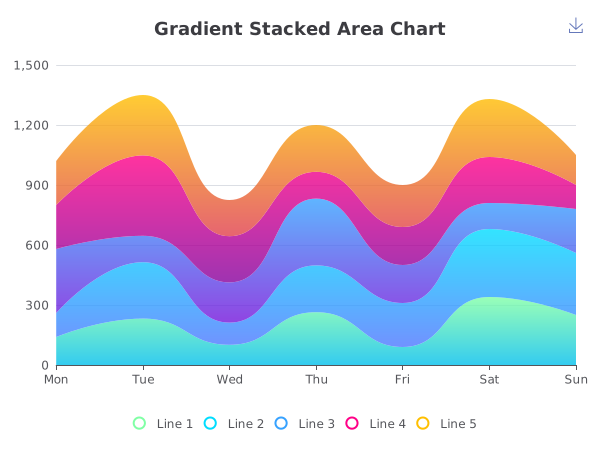
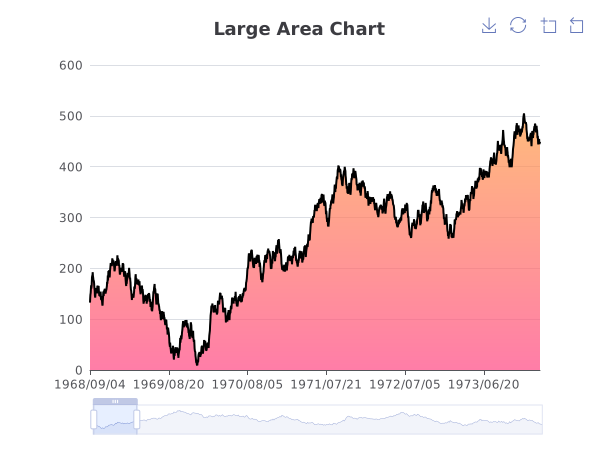
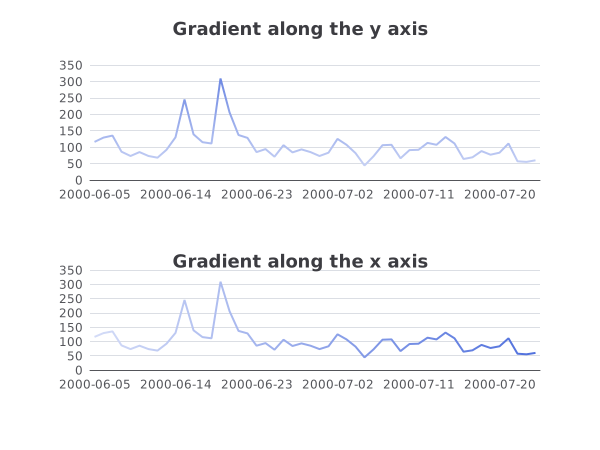
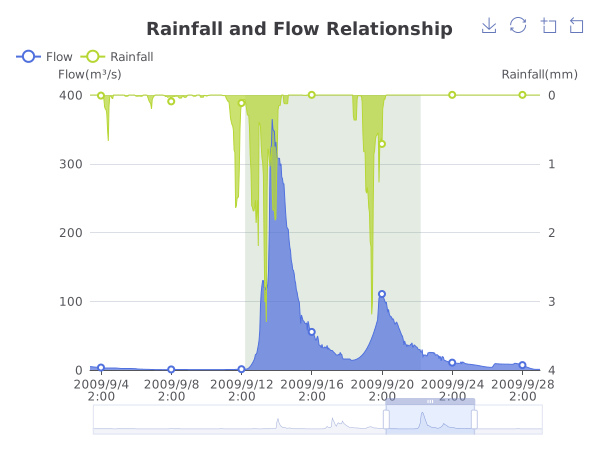
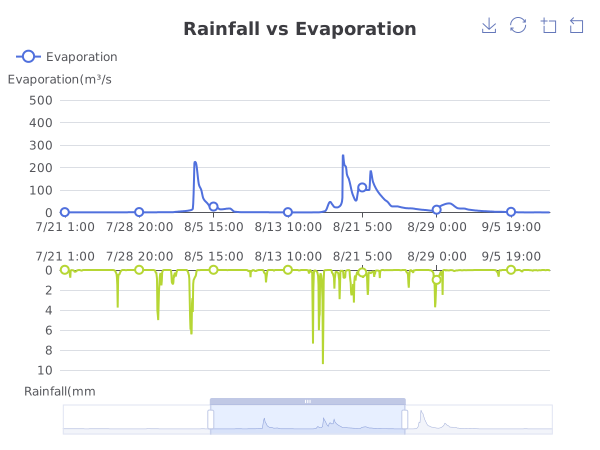
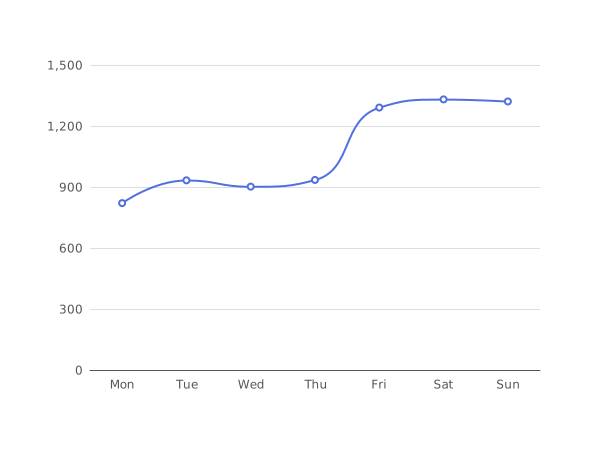
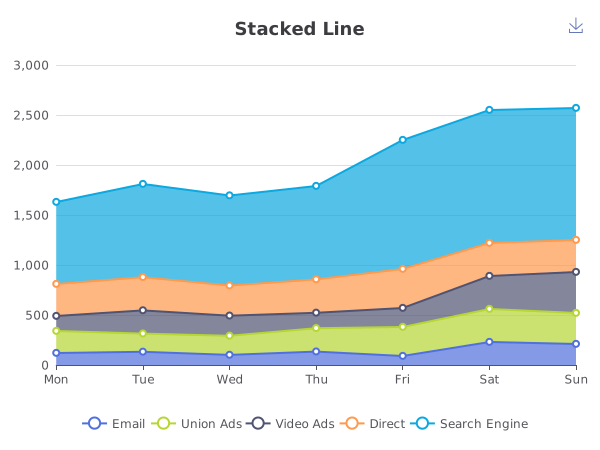
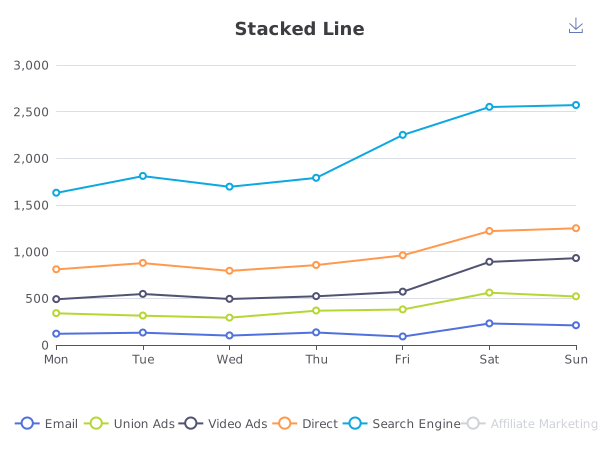
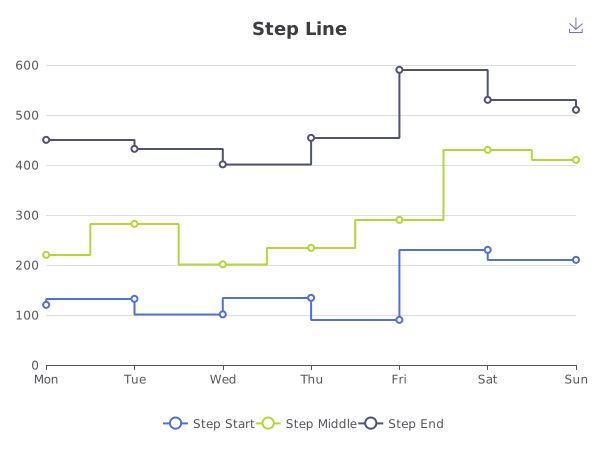
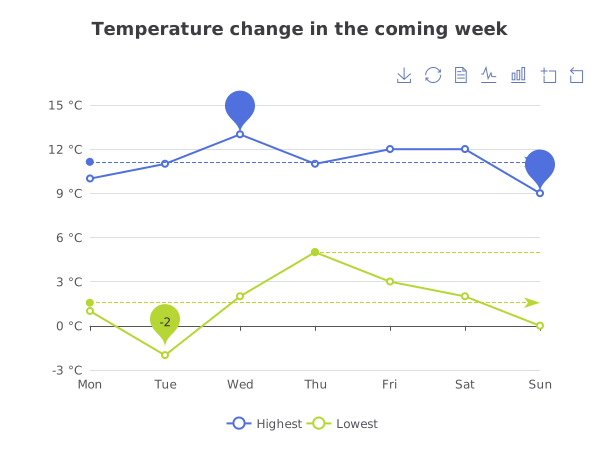
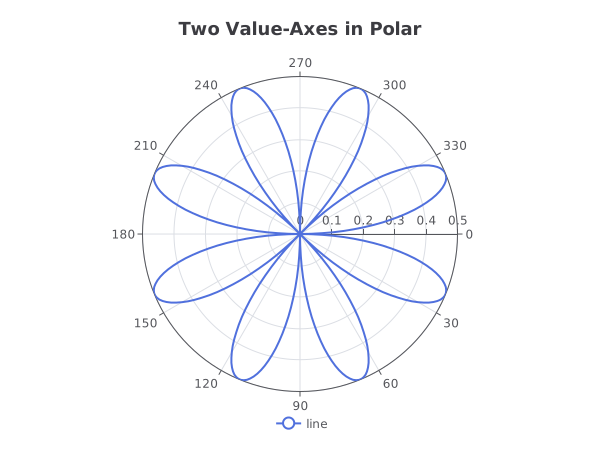
Line Charts
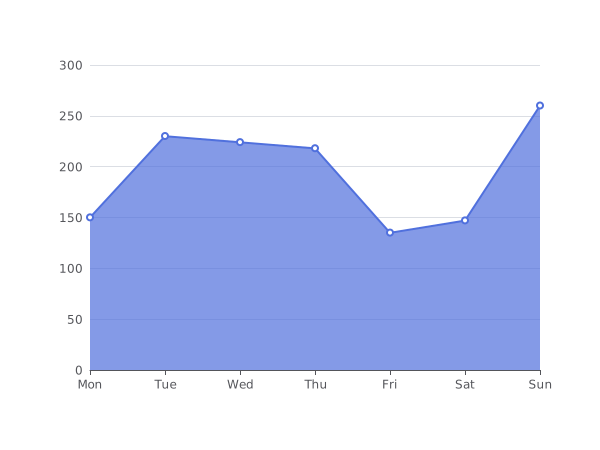
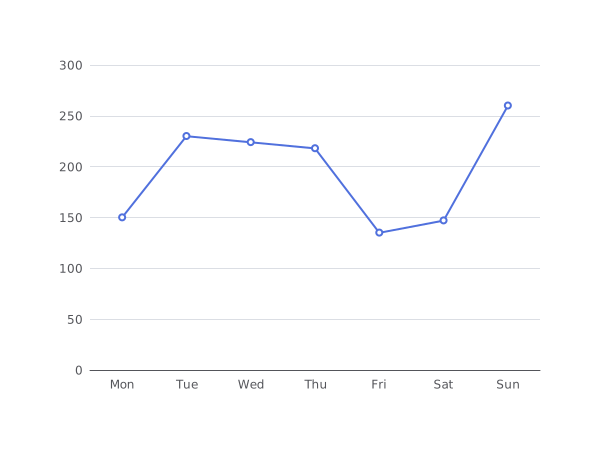
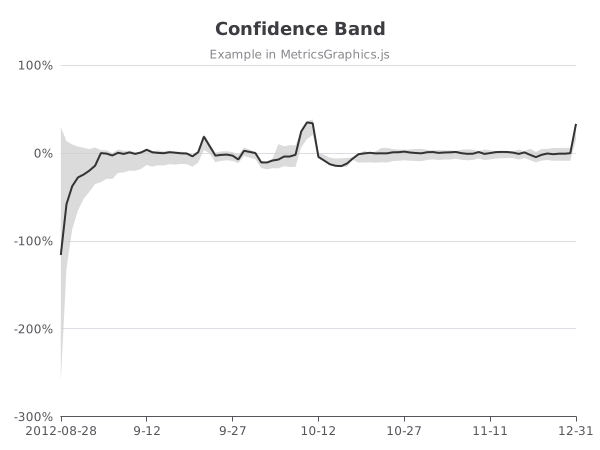
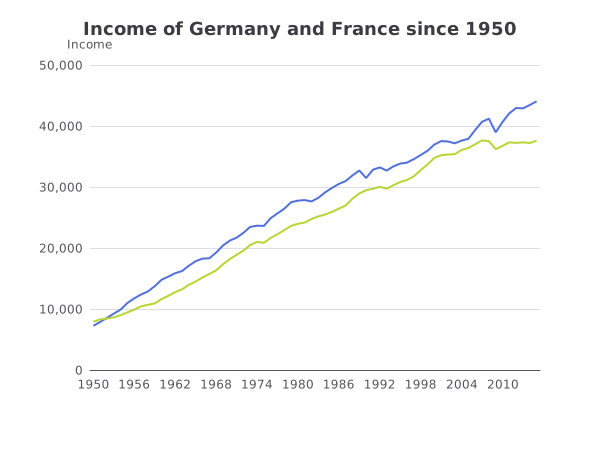
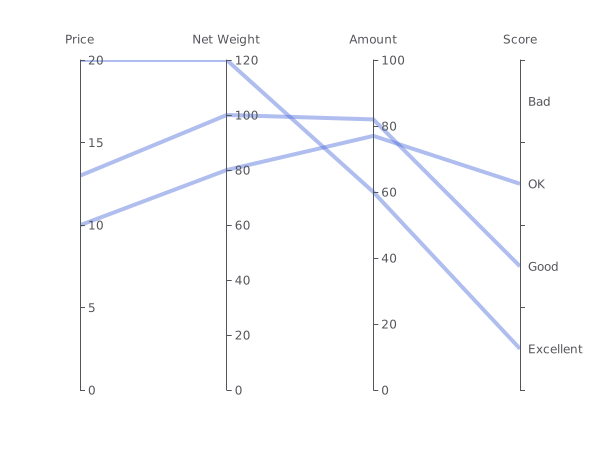
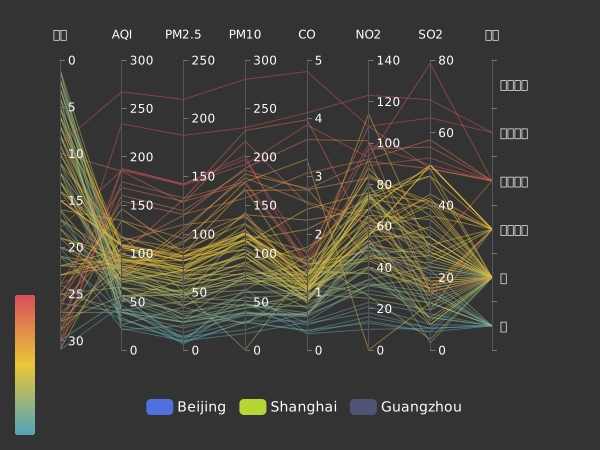
Parallel Charts
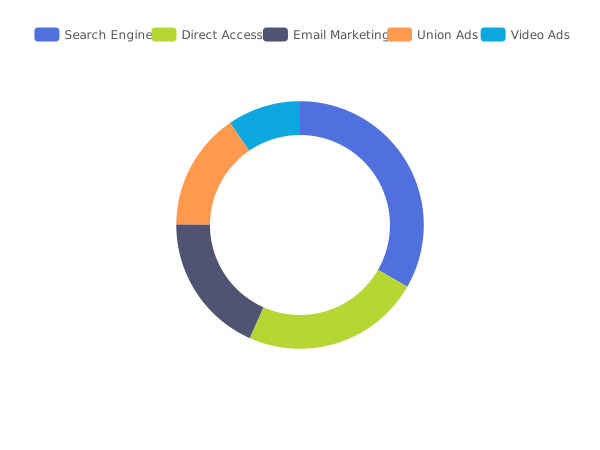
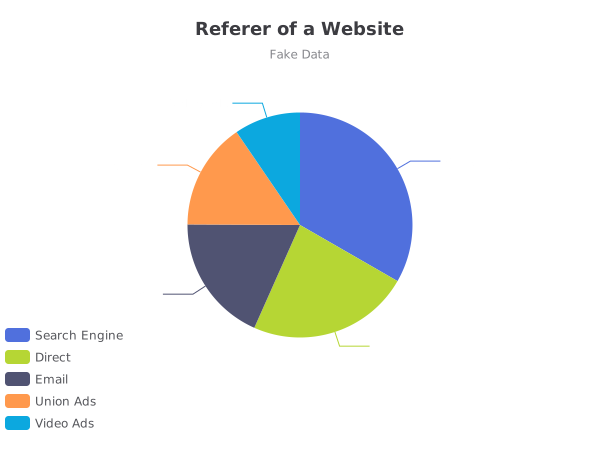
Pie Charts
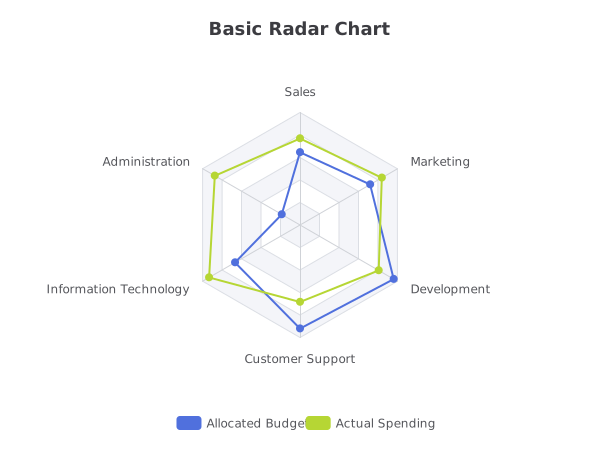
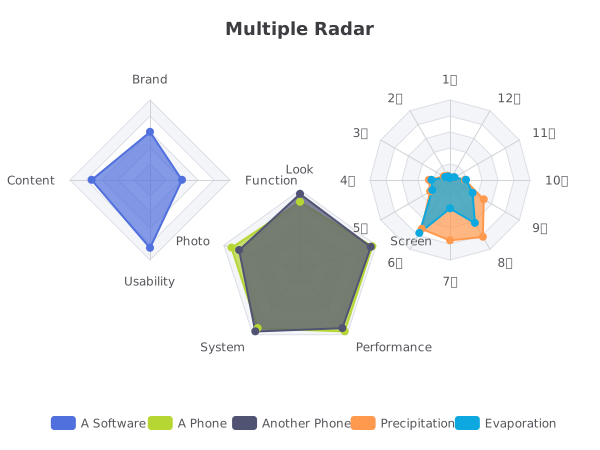
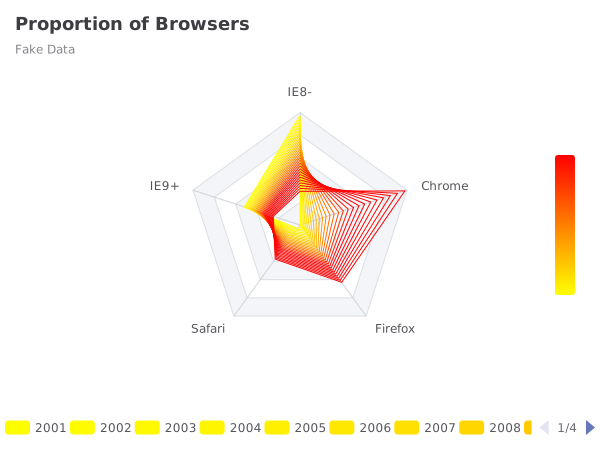
Radar Charts
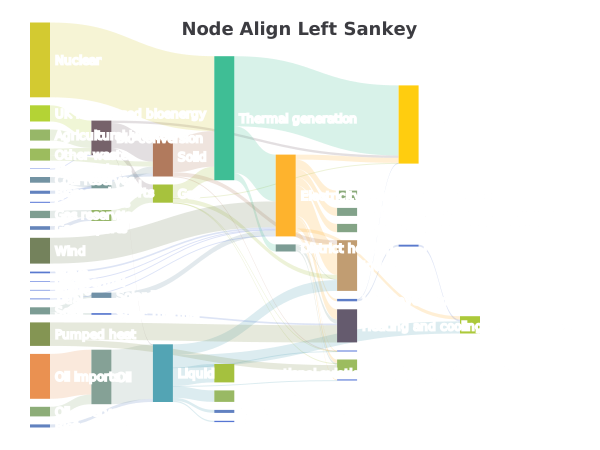
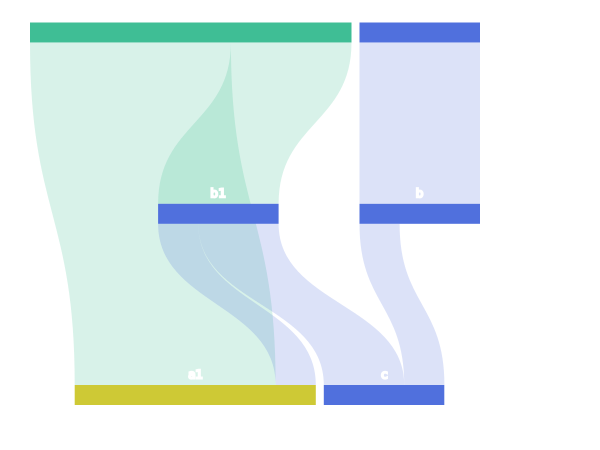
Sankey Charts

Scatter Charts
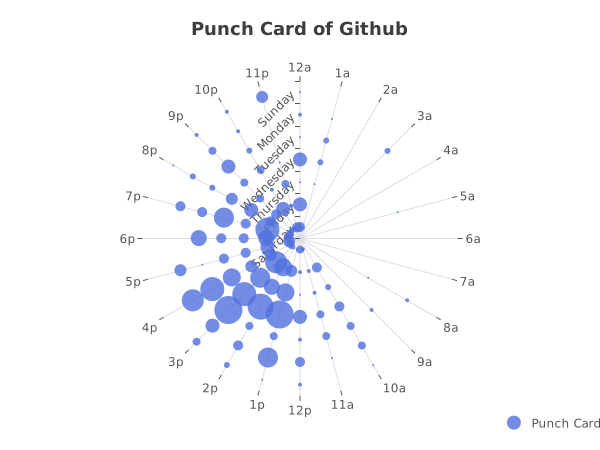
Calendar Charts
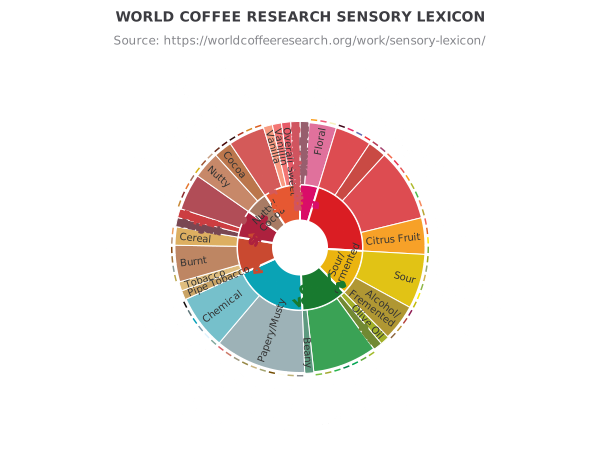
Sunburst Charts
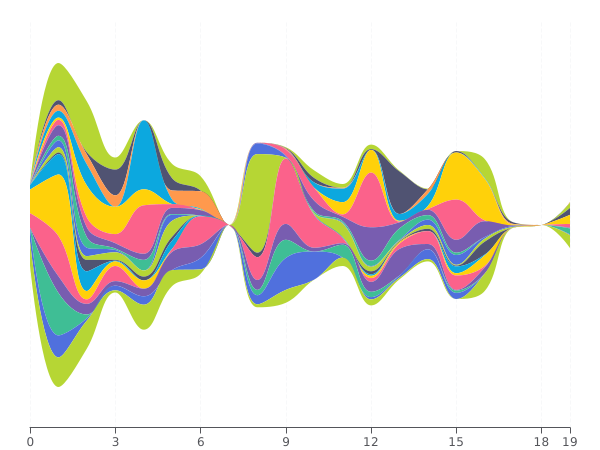
Theme River Charts
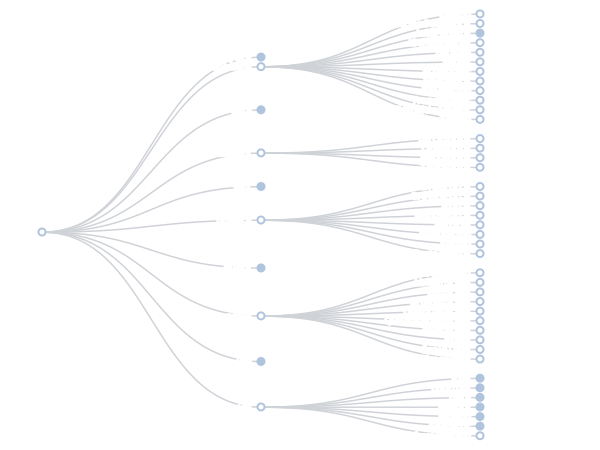
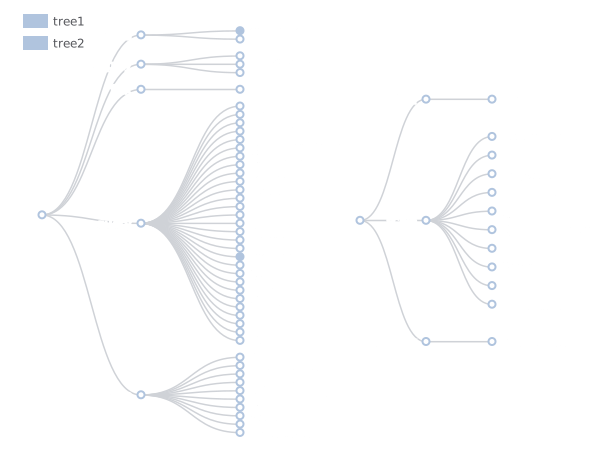
Tree Charts
Custom Charts
関連プロジェクトを探す
Asabeneh/30-Days-Of-Python
30 Days of Python プログラミングチャレンジは、Python プログラミング言語を 30 日で学ぶためのステップバイステップのガイドです。このチャレンジは 100 日以上かかることもあります。自分のペースで進めてください。こちらの動画も役立つかもしれません: https://www.youtube.com/channel/UC7PNRuno1rzYPb1xLa4yktw
78,618 スターgrafana/grafana
オープンで組み合わせ可能なオブザーバビリティおよびデータ可視化プラットフォームです。Prometheus、Loki、Elasticsearch、InfluxDB、Postgres など、複数のソースからメトリクス、ログ、トレースを可視化できます。
77,859 スターredis/redis
リアルタイムのデータ駆動型アプリケーションを構築する開発者にとって、Redis は最も選ばれ、最速で、機能が最も豊富なキャッシュ、データ構造サーバー、ドキュメントおよびベクトルクエリエンジンです。
77,472 スターapache/superset
Apache Superset は、データ可視化とデータ探索のためのプラットフォームです。
75,495 スター