
thesysdev/opendashboards has 140 GitHub stars and 14 forks. GitHot measured +75 stars in 24 hours. Last checked 2026-11-15 06:42 UTC. Last push 2026-11-13.
計測したスター増加
- 24時間
- +75
- 7日間
- 履歴を収集中
- 15日間
- 履歴を収集中
- 1か月
- 履歴を収集中
期間ごとの純増数です。期間は重複しており、日別の値ではありません。未計測の値は空欄です。スター数は注目度の指標であり、品質の保証ではありません。
概要
Open Source Claude Dashboards
データREADME.md
オリジナル

OpenDashboards
Ask any question. Get a live dashboard.
The open-source alternative to Claude Dashboards.


What is OpenDashboards
Connect your databases and tools, ask a question in plain words, and get a live, interactive dashboard that pulls from all of them. Filter it, drill down, and edit one chart without touching the rest.
OpenDashboards is open source (MIT). It builds dashboards with the OpenUI Dashboards API, so you can use any model and host it anywhere: at opendashboards.com, or on your own servers.
Product tour
One question, one dashboard, from every tool that has part of the answer.
| "How was revenue this month?" MRR, net new revenue and churn, from Stripe and Postgres. 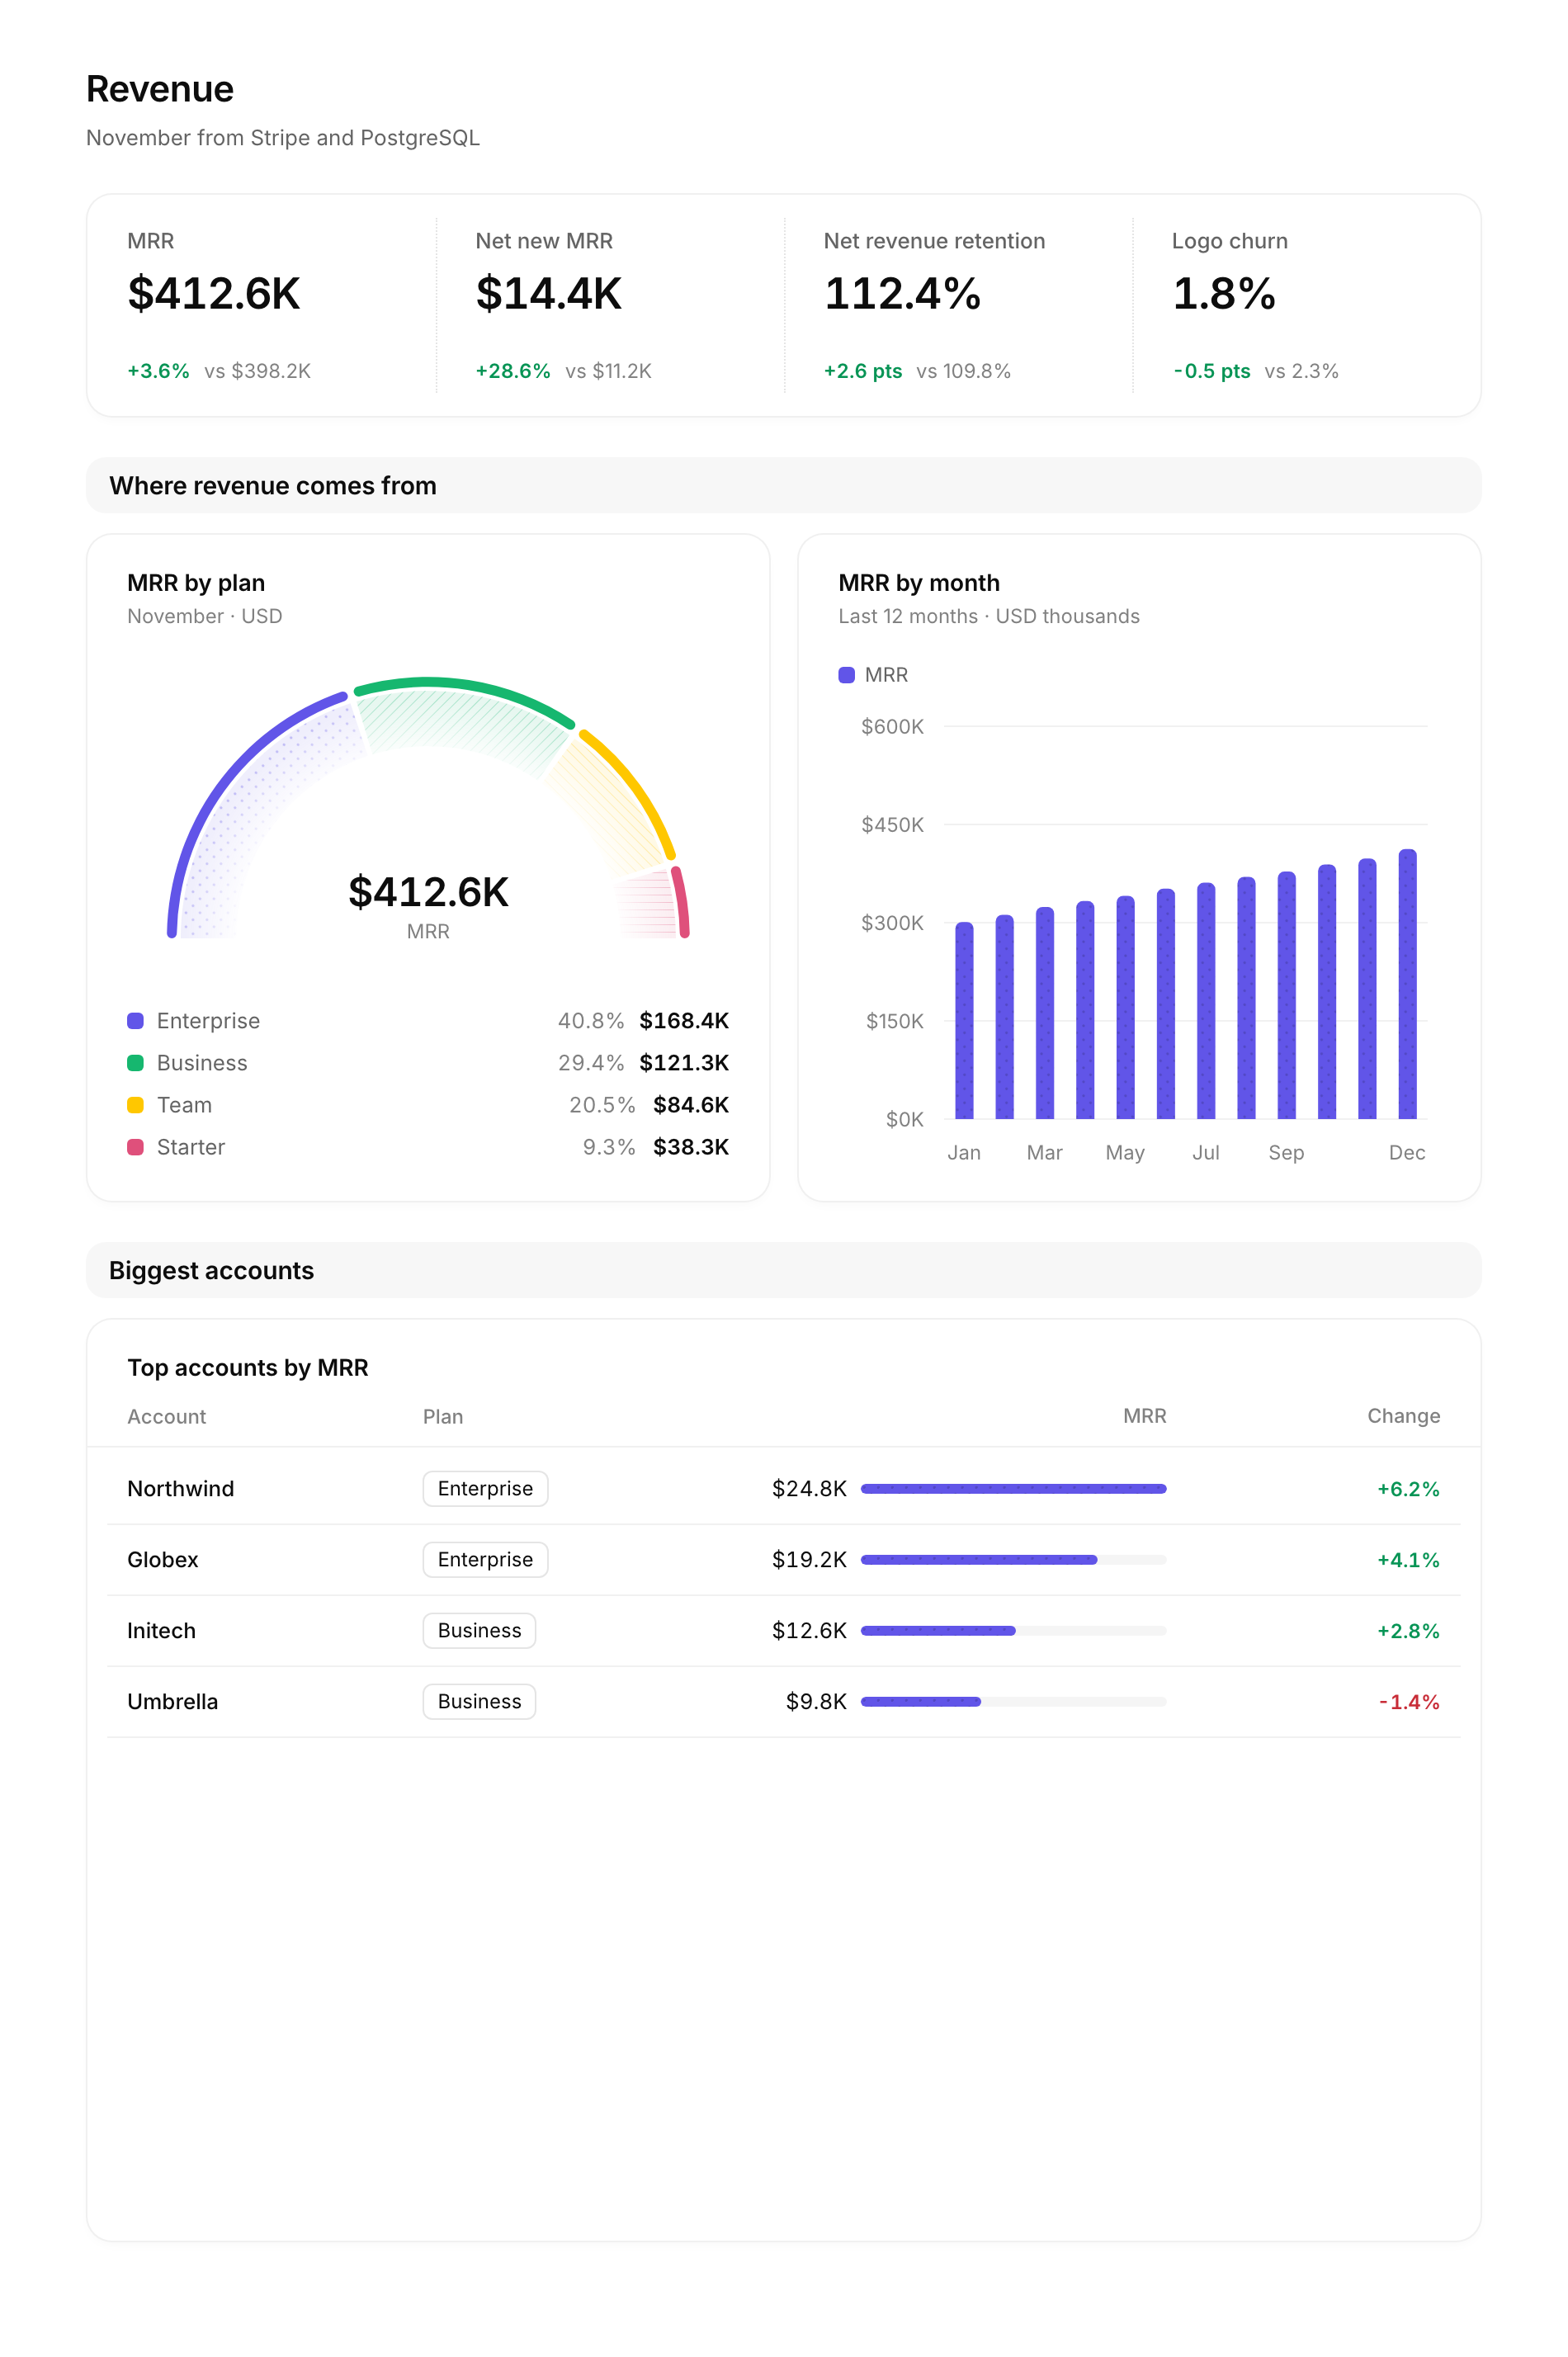 |
"How are my sales looking?" Pipeline by stage and rep, from HubSpot and Postgres. 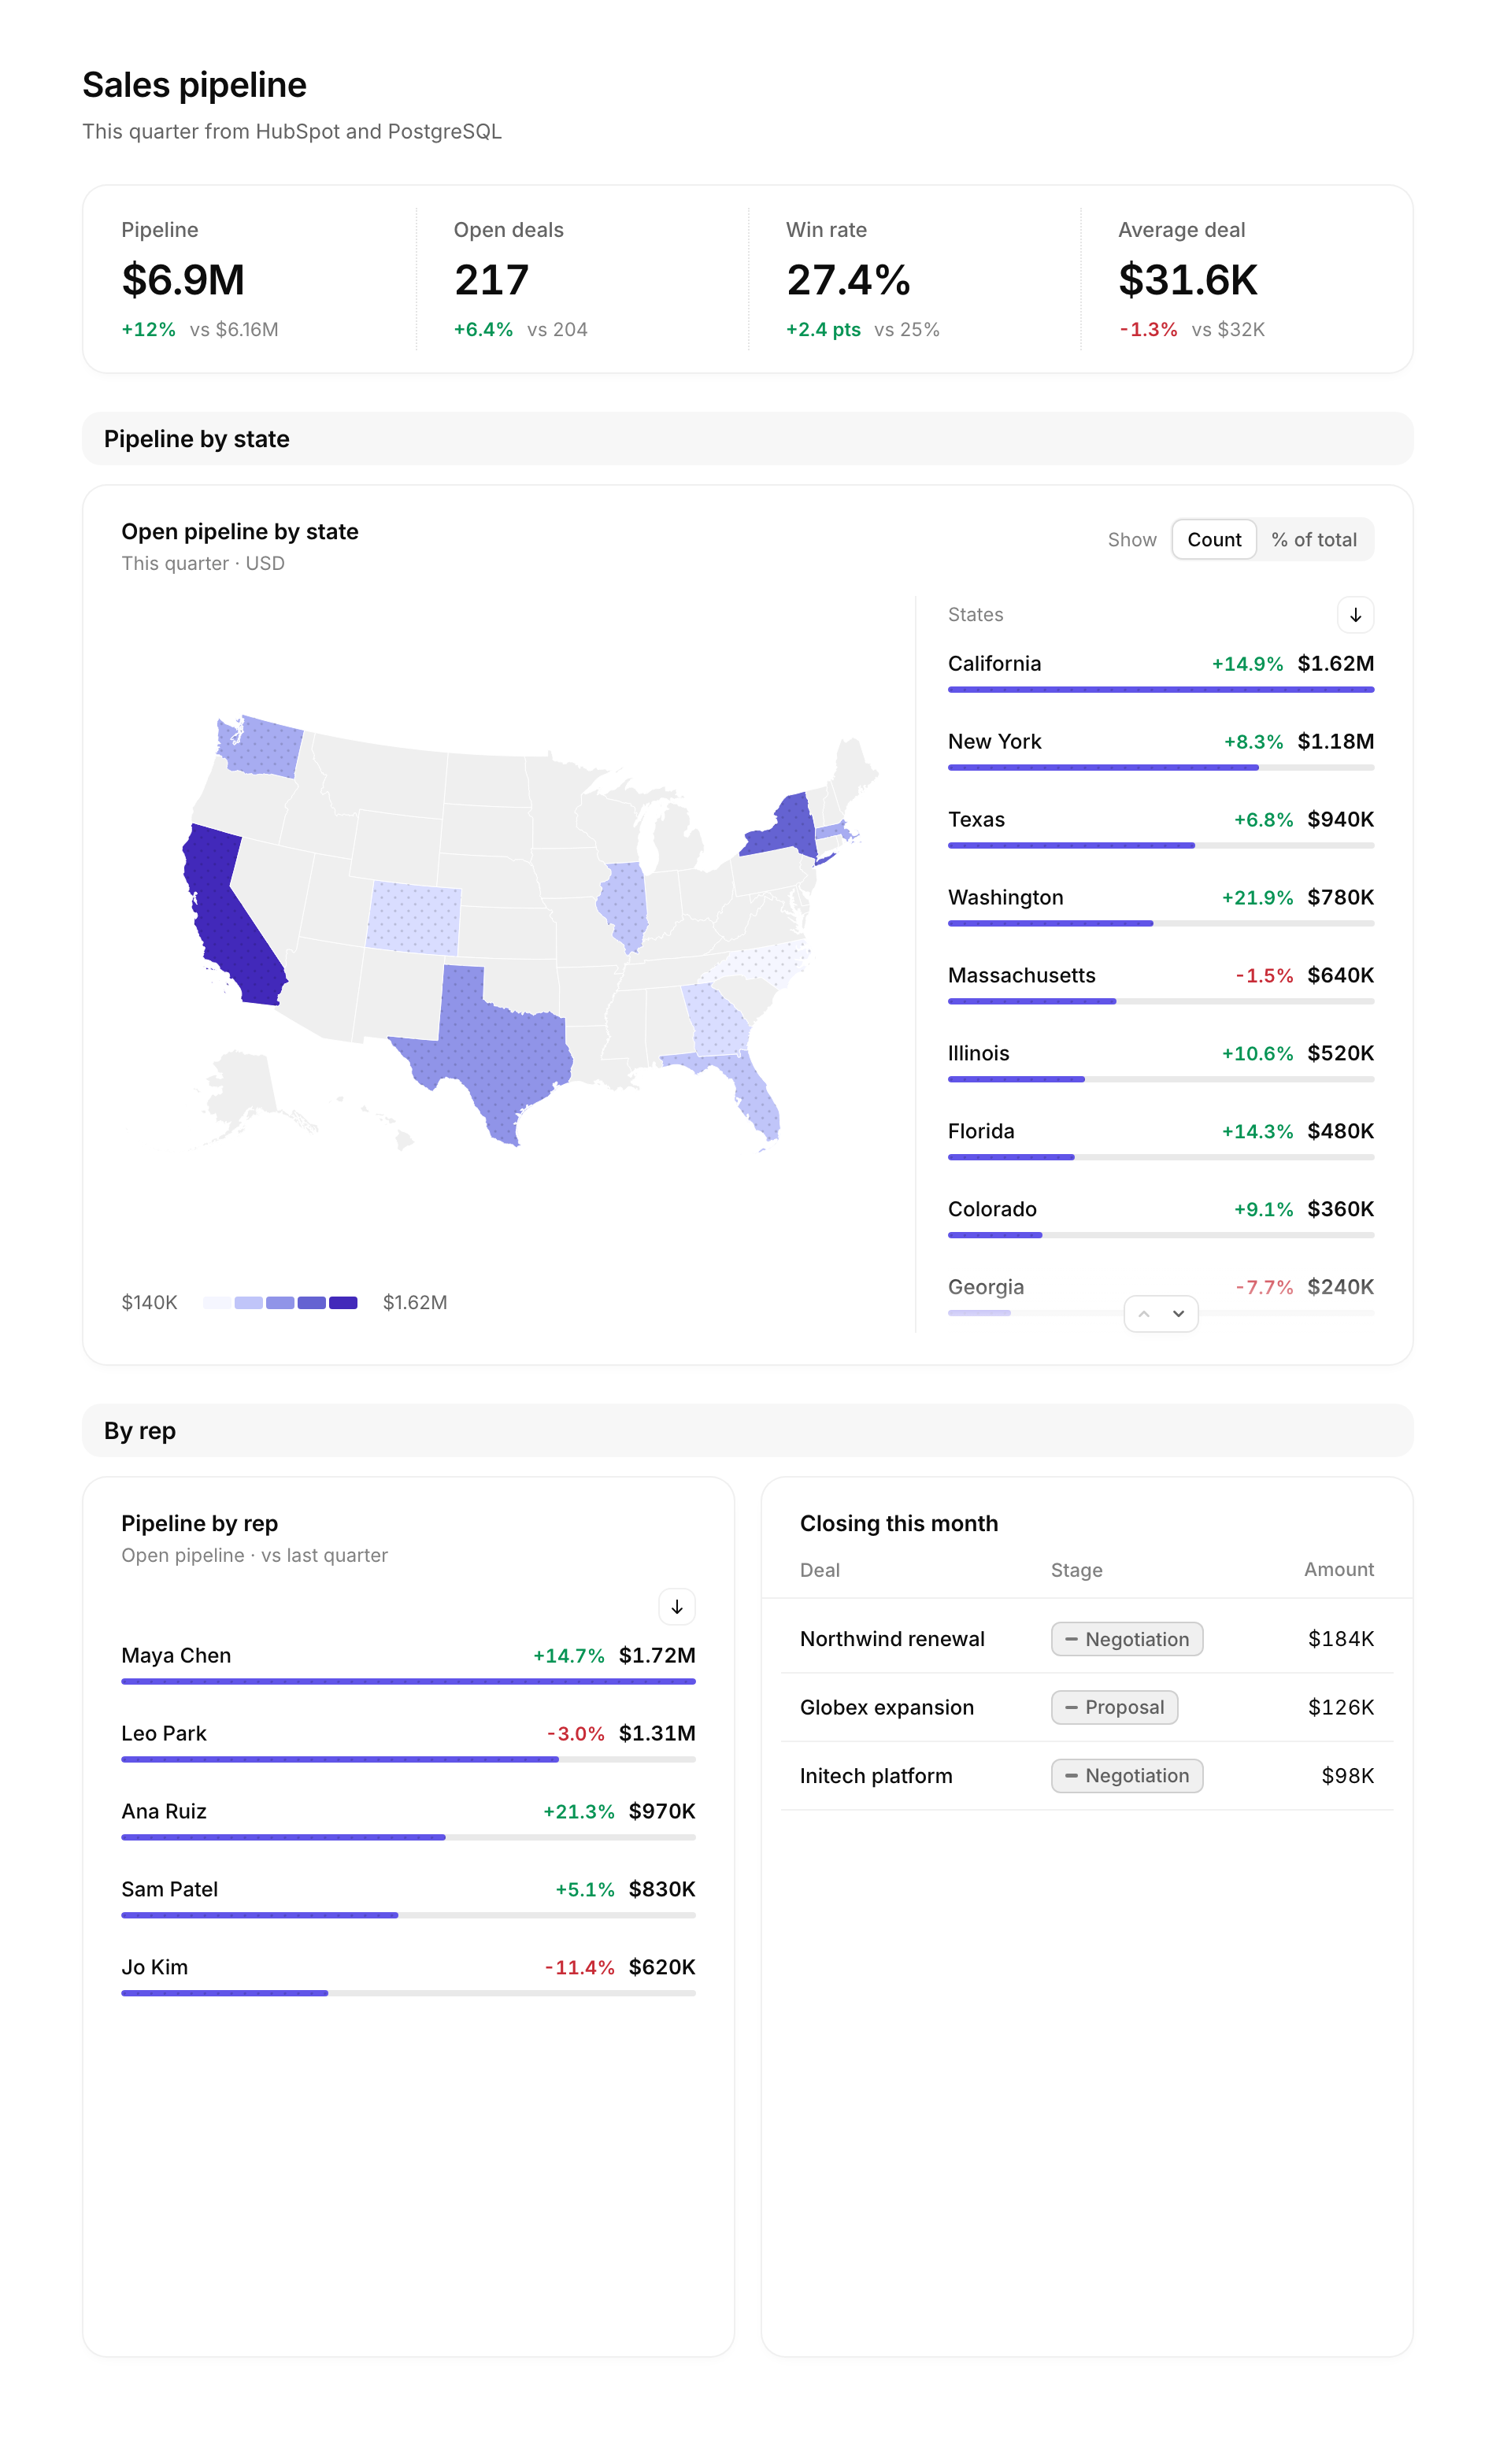 |
| "Which ads are actually working?" Cost per customer by channel, from Google Analytics, HubSpot and Stripe. 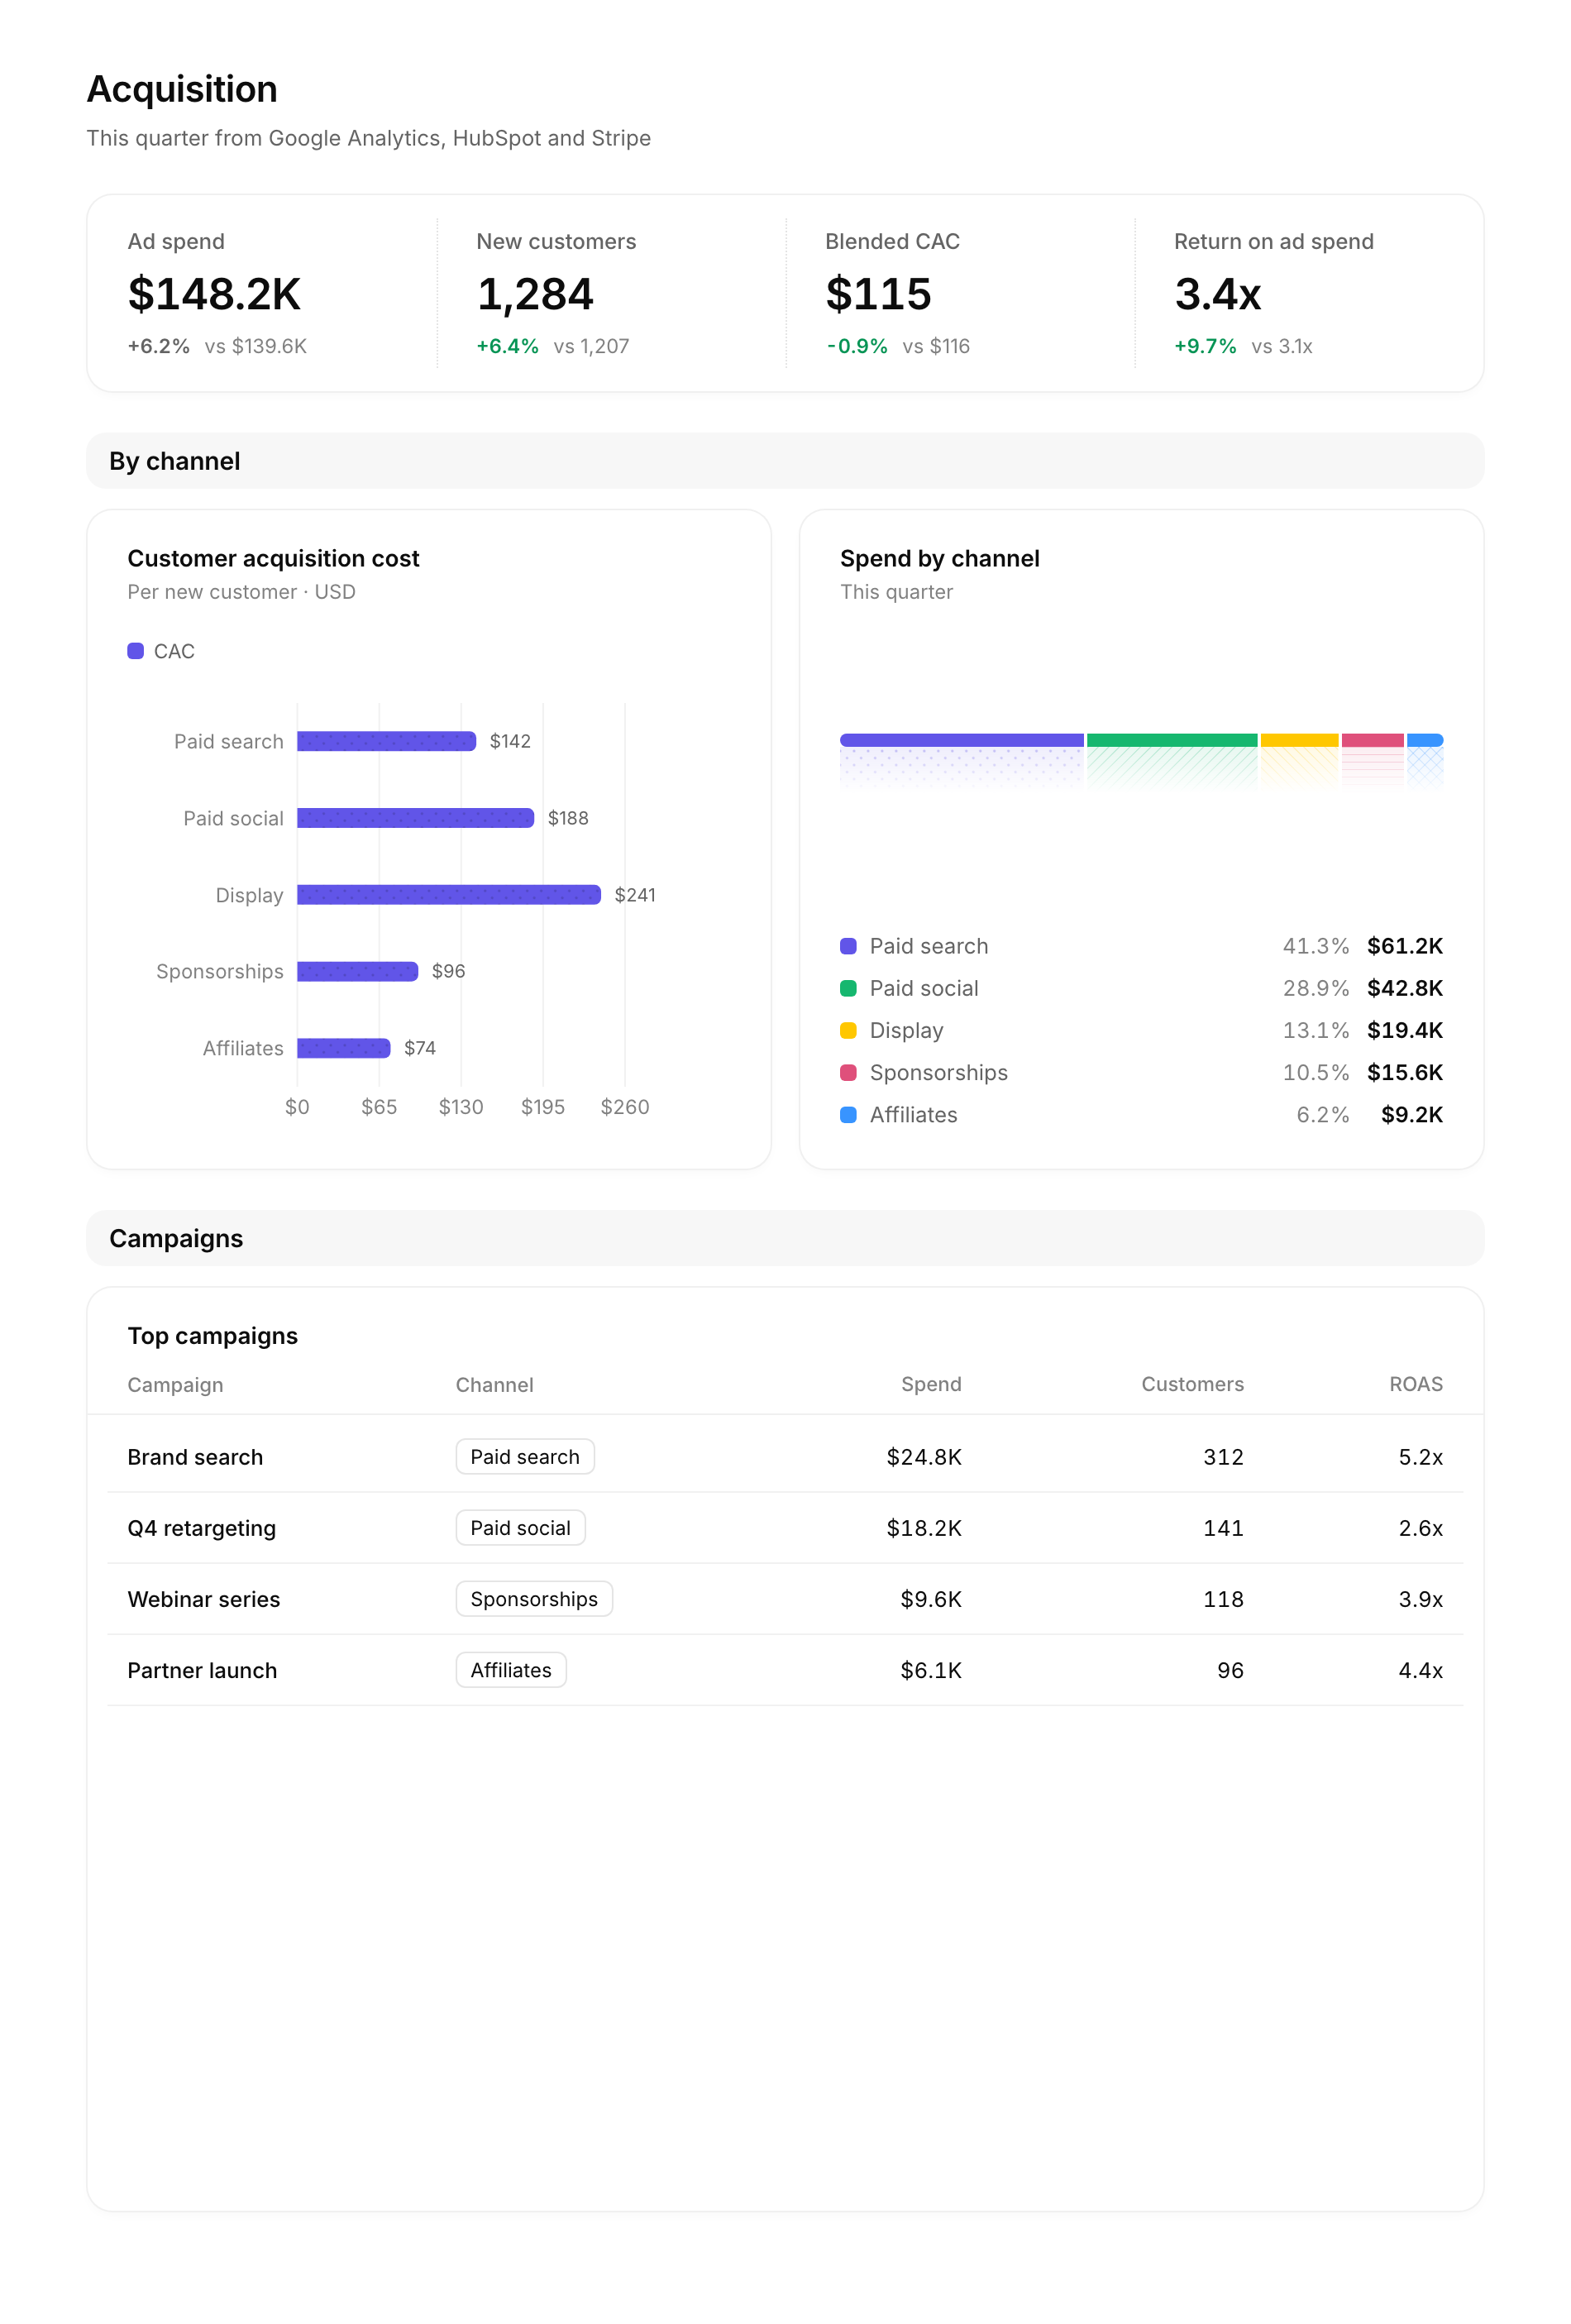 |
"Are signups turning into customers?" The signup-to-paid funnel by source, from PostHog, Stripe and Postgres. 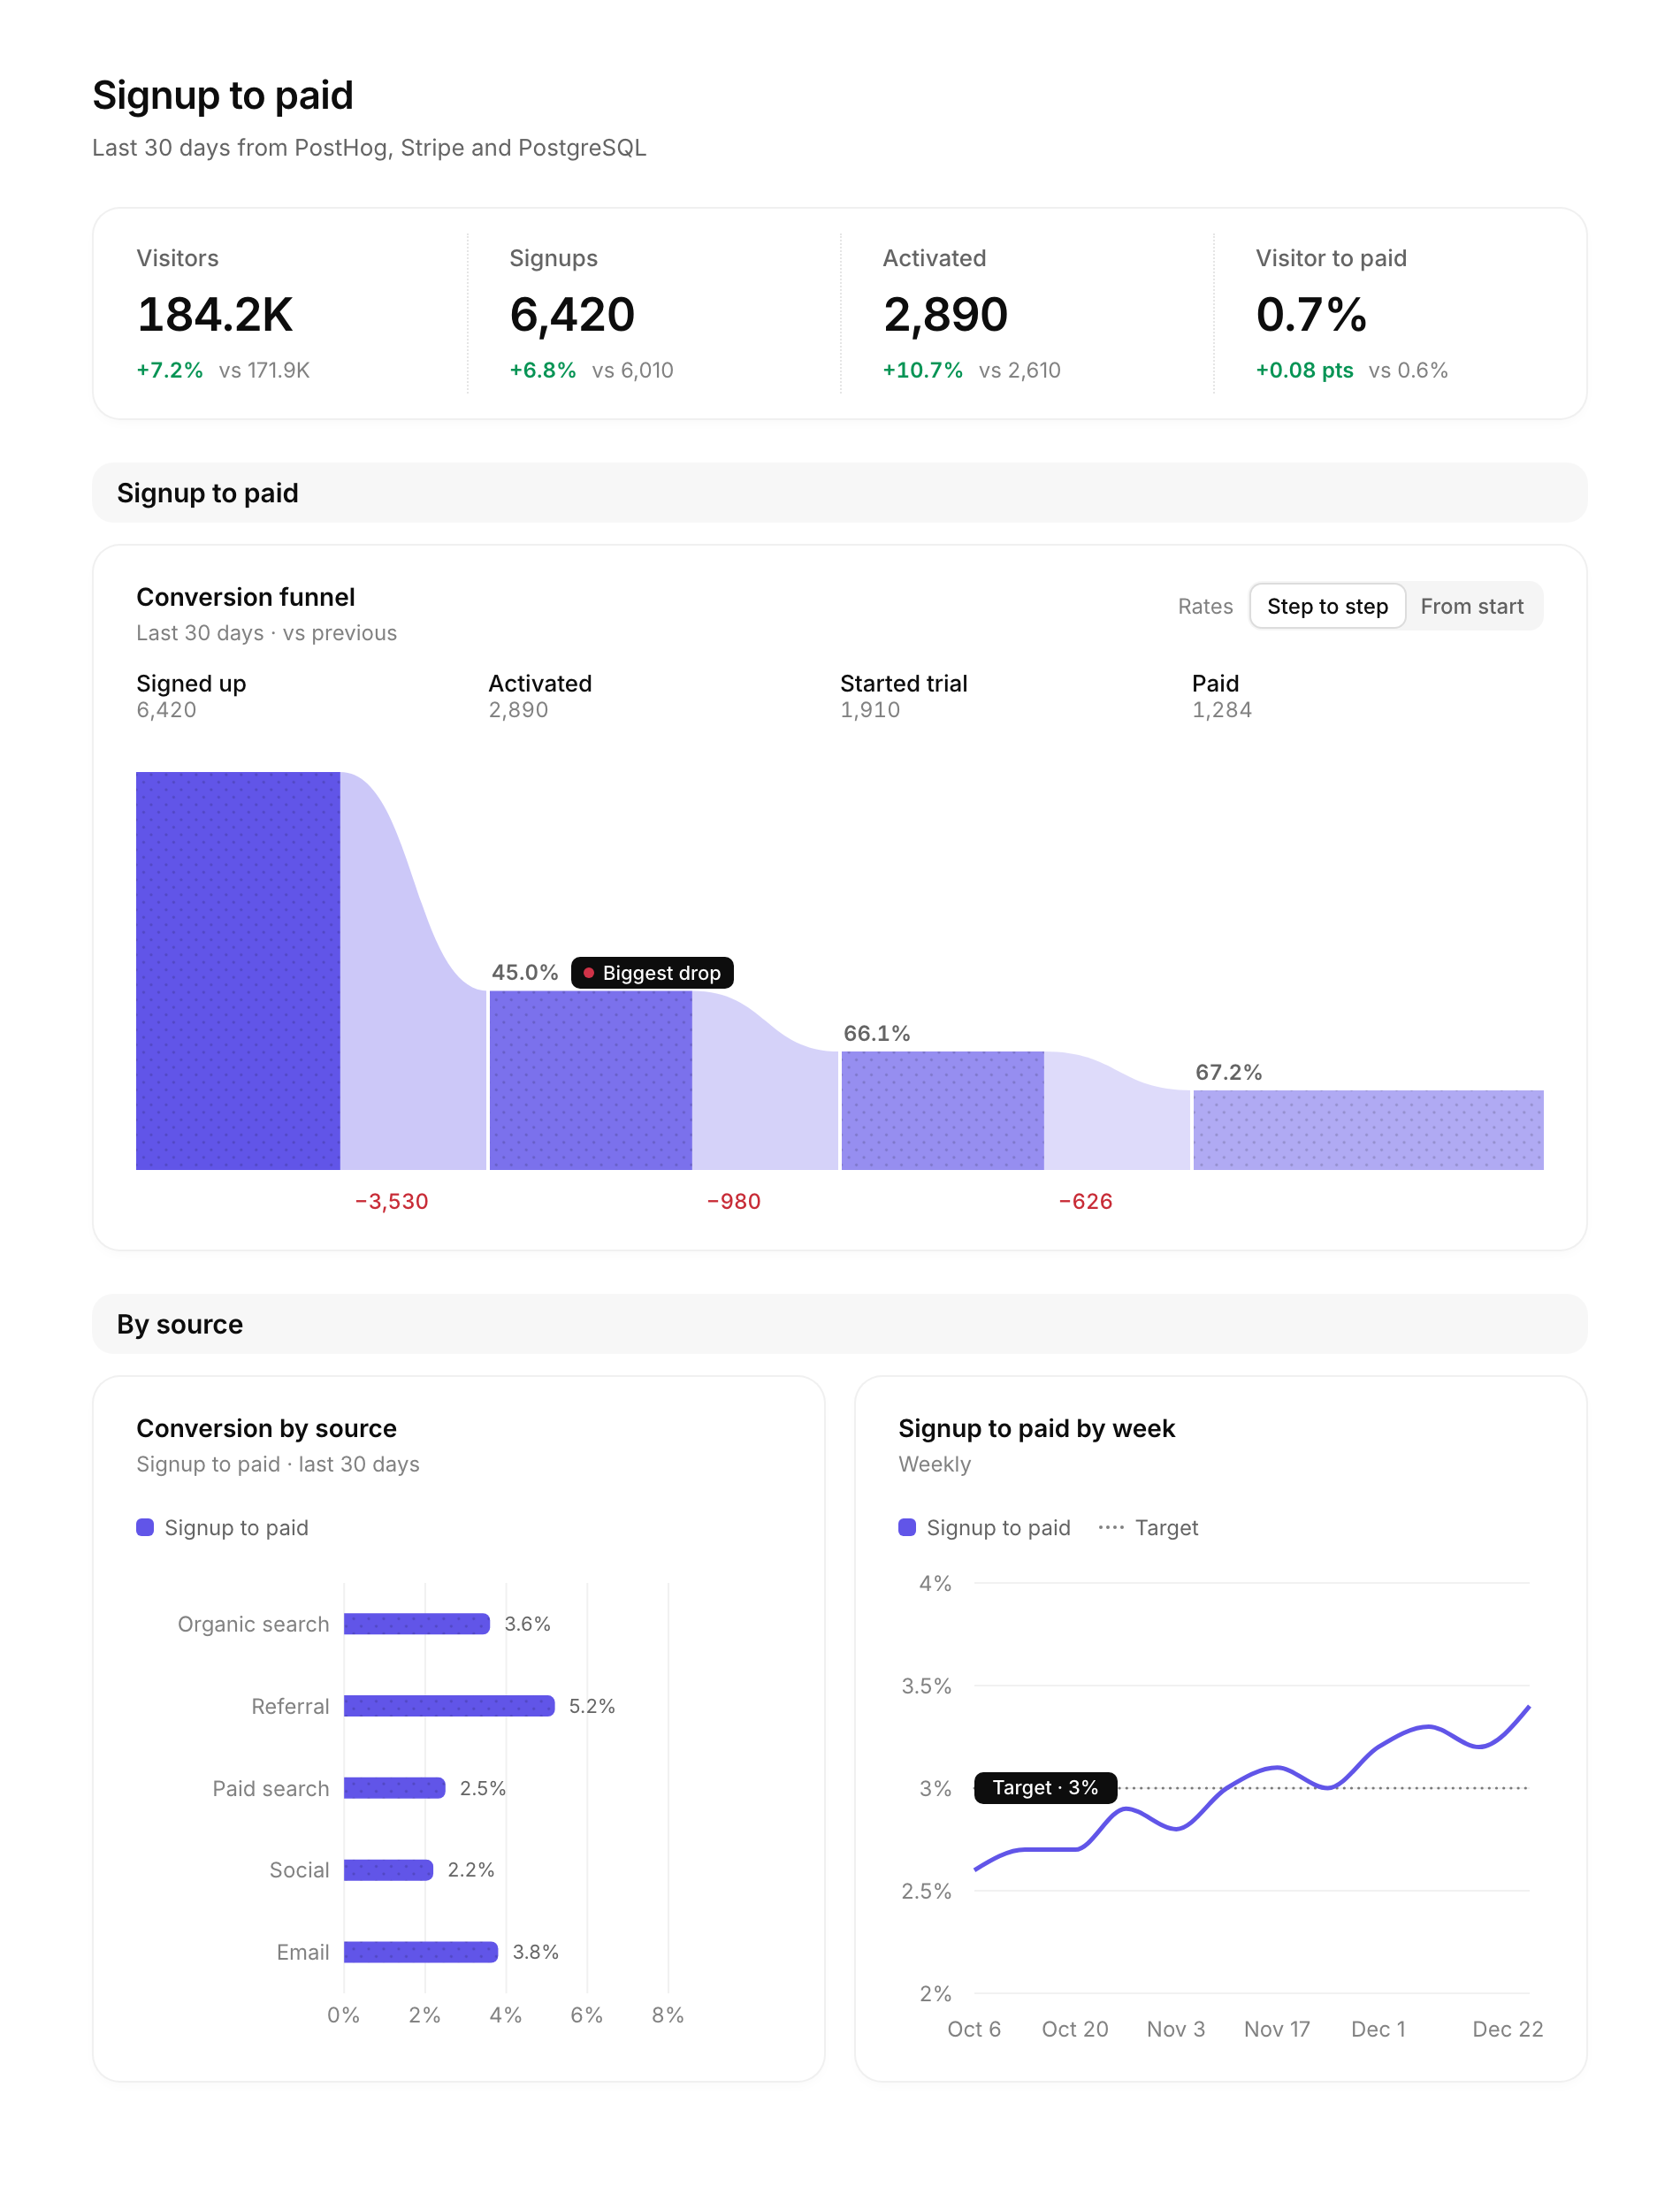 |
Why OpenDashboards
- Your data, your servers. Connection credentials stay on your server, and queries run from it. For complete isolation, OpenUI Cloud can be privately hosted inside your network.
- Any model. Use any model the OpenUI Dashboards API supports, or bring your own OpenAI or Anthropic key.
- Live and interactive. Dashboards stay connected to your data. Filter them and drill down, and they update when the data does.
- Edit one chart. Ask for a change and only that chart is built again.
- Open source. MIT licensed. Read it, fork it, run it.
Data sources
| Source | Status | What you need |
|---|---|---|
| PostgreSQL (and Supabase, Neon) | ✅ Supported | Host, database and a read-only user, or a connection string |
| MySQL / MariaDB | ✅ Supported | Host, database and a read-only user, or a connection string |
| ClickHouse | ✅ Supported | HTTPS host, database and a read-only user |
| BigQuery | ✅ Supported | Project ID and a service account key |
| PostHog | ✅ Supported | Region, project ID and a personal API key |
| Google Analytics (GA4) | ✅ Supported | Property ID and a service account key |
| Search Console | ✅ Supported | Property and a service account key |
| Any MCP server | ⚠️ Limited | A remote (HTTPS) server URL. API key auth only, no OAuth |
Give OpenDashboards read-only credentials: a read-only database user, and API keys that can only read. Anything without a built-in connector, like Stripe or HubSpot, connects through its MCP server.
Quick start
Use the hosted version
Sign up at opendashboards.com. Nothing to install.
Run it yourself
You need Node 20.9 or later, pnpm and Docker, and a Thesys API key from console.thesys.dev. OpenUI Cloud has a generous free tier.
git clone https://github.com/thesysdev/opendashboards.git
cd opendashboards
pnpm install
cp .env.example .env.local   # then add THESYS_API_KEY
pnpm db:up                   # Postgres on localhost:54329 (plus an opendashboards_test database)
pnpm db:reset                # create the tables from lib/db/schema.ts
pnpm dev                     # http://localhost:3000
Locally, every request acts as the dev user in config/local.ts, and connection keys are
stored unencrypted. Production refuses both.
Deploy to production
Fork the repo, implement your auth, and deploy. Auth is one interface, AuthProvider in
lib/auth/provider.ts: add yours to
lib/auth/providers/ and pick it in
lib/auth/index.ts.
How it works
- Connect your databases and tools. Credentials are encrypted and stay on your server.
- Ask a question. The Build agent explores your sources and plans the dashboard.
- Get a dashboard. The OpenUI Dashboards API builds it, and it queries your sources live through your server every time it opens.
- Refine it by chatting. Change one chart, add a filter, or start a new dashboard in the same app.
The data behind each answer goes to the OpenUI Dashboards API, which runs on OpenUI Cloud and stores your dashboards and chats. Configure the API, models and BYOK at console.thesys.dev.
License
MIT © Thesys Inc.