
olgabot/prettyplotlib has 1,702 GitHub stars and 141 forks. GitHot measured 0 stars in 24 hours and 0 in 7 days. Last checked 2026-11-14 20:52 UTC. Last push 2019-01-31.
計測したスター増加
- 24時間
- 0
- 7日間
- 0
- 15日間
- 履歴を収集中
- 1か月
- 履歴を収集中
期間ごとの純増数です。期間は重複しており、日別の値ではありません。未計測の値は空欄です。スター数は注目度の指標であり、品質の保証ではありません。
概要
Painlessly create beautiful matplotlib plots.
開発ツールREADME.md
オリジナルAnnouncement
Thank you to everyone who has used prettyplotlib and made it what it is today! Unfortunately, I no longer have the bandwidth to maintain prettyplotlib. I recommend using seaborn. Using seaborn, to get the prettyplotlib style, do:
import seaborn as sns
sns.set(style='ticks', palette='Set2')
And to remove "chartjunk", do:
sns.despine()
If you have discrete pull requests, I will accept them, but I personally will no longer fix bugs.
If you are a biological scientist looking for ways to analyze your big-ish (20+ samples) data, check out my main project, flotilla.

prettyplotlib
Python matplotlib-enhancer library which painlessly creates beautiful default matplotlib
plots. Inspired by Edward Tufte's work on information design and Cynthia Brewer's work on color perception.
I truly believe that scientific progress is impeded when improper data visualizations are used. I spent a lot of time tweaking my figures to make them more understandable, and realized the scientific world could be a better place if the default parameters for plotting libraries followed recent advances in information design research. And thus prettyplotlib was born.
Requirements:
matplotlib. Can be installed viapip install matplotliboreasy_install matplotlibbrewer2mpl. Can be installed viapip install brewer2mploreasy_install brewer2mpl
Comparison to matplotlib
matplotlib default plot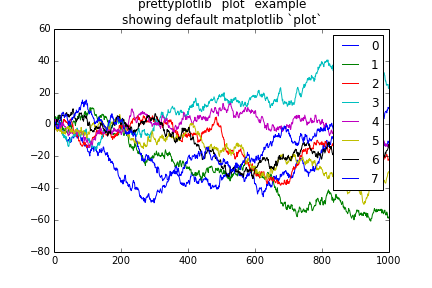 |
prettyplotlib default plot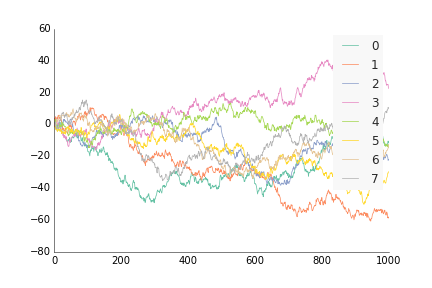 |
matplotlib default scatter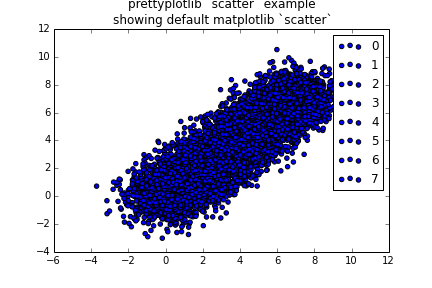 |
prettyplotlib default scatter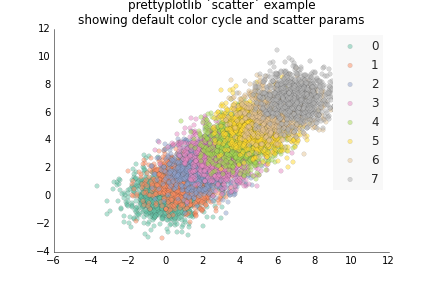 |
matplotlib default bar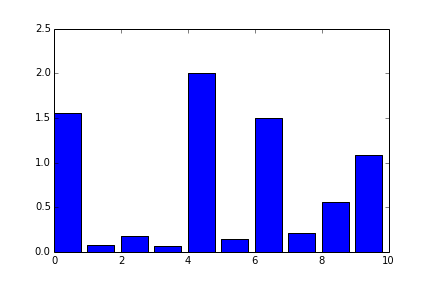 |
prettyplotlib default bar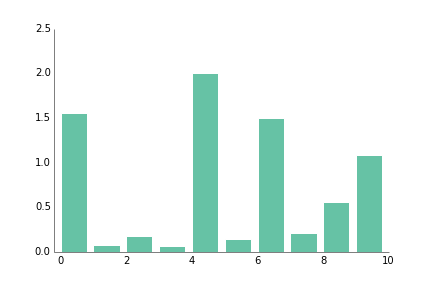 |
matplotlib default hist |
prettyplotlib default hist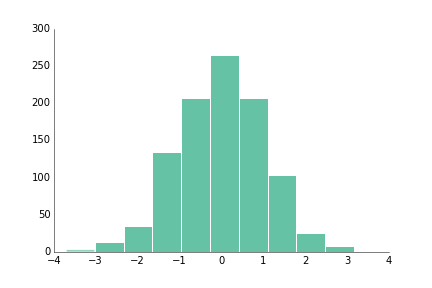 |
matplotlib default histwith grid 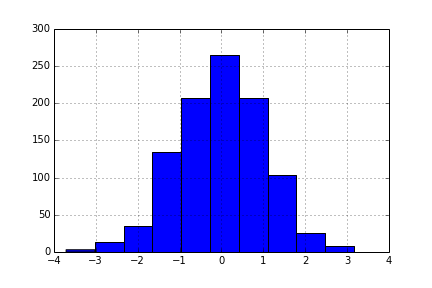 |
prettyplotlib default histwith grid 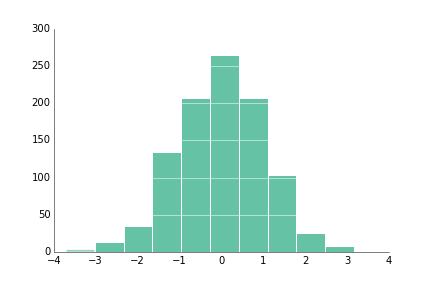 |
matplotlib default boxplot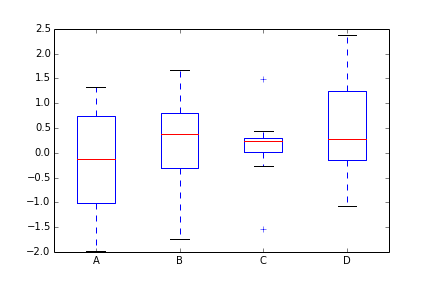 |
prettyplotlib default boxplot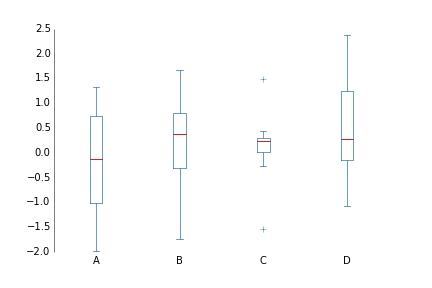 |
matplotlib default pcolormeshpositive and negative data 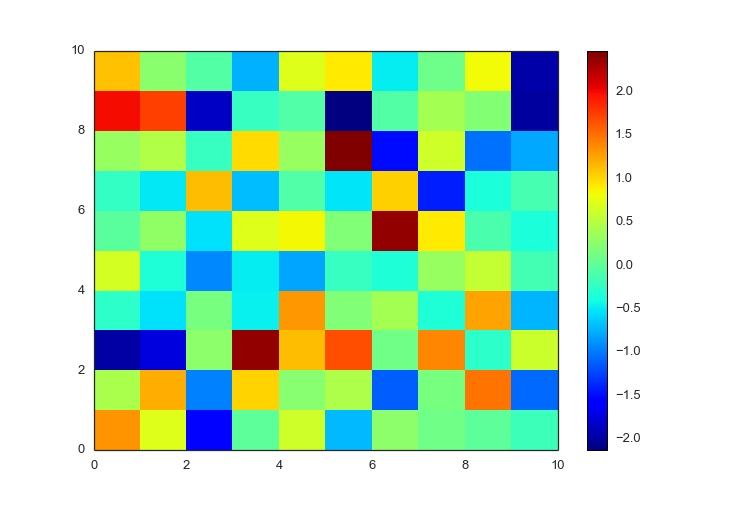 |
prettyplotlib default pcolormeshpositive and negative data 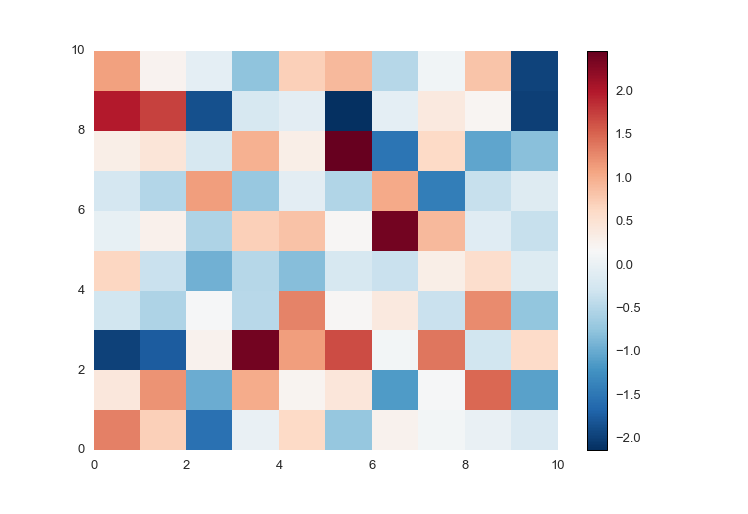 |
matplotlib default pcolormeshpositive data only 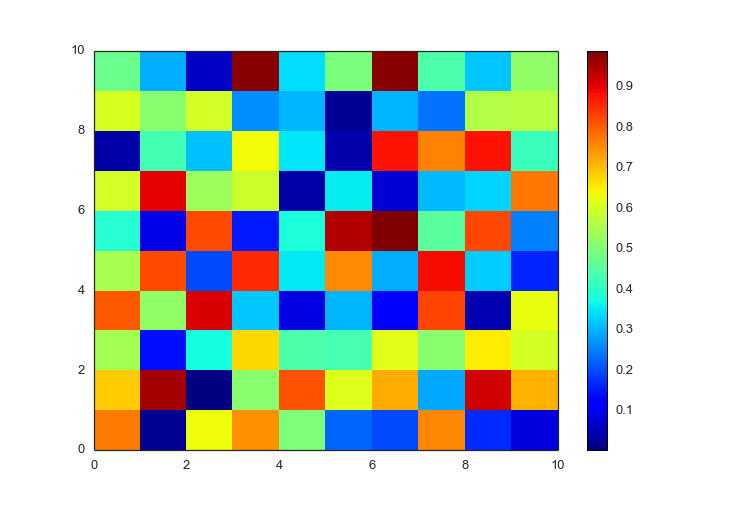 |
prettyplotlib default pcolormeshpositive data only 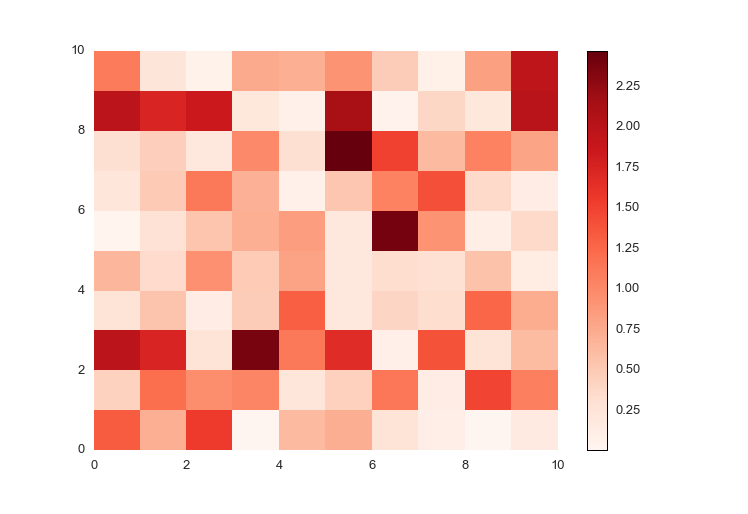 |
matplotlib pcolormeshnegative-valued data with labels 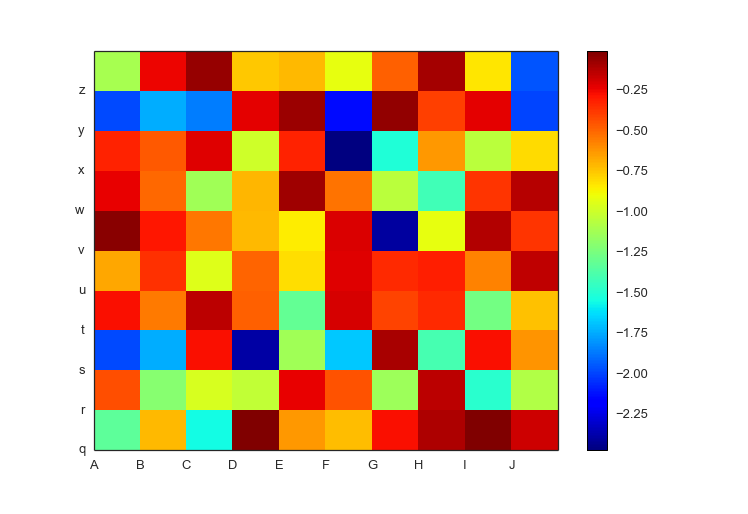 |
prettyplotlib pcolormeshnegative-valued data with labels 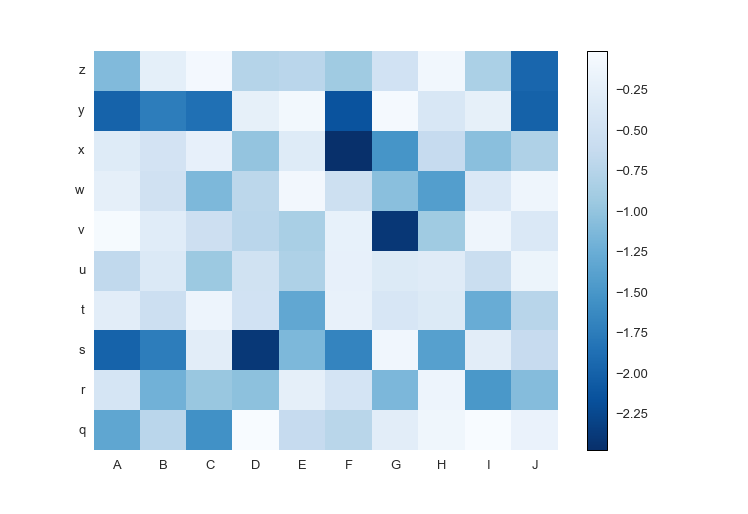 |
Quotes
"Dis ain't no uglyplotlib" - Anonymous