
bitquery/widgets has 133 GitHub stars and 50 forks. GitHot measured 0 in 7 days. Last checked 2026-11-10 04:43 UTC. Last push 2026-06-11.
Widgets for blockchain data visualizations
計測したスター増加
- 24時間
- 更新が遅れています
- 7日間
- 0
- 15日間
- 更新が遅れています
- 1か月
- 更新が遅れています
期間ごとの純増数です。期間は重複しており、日別の値ではありません。未計測の値は空欄です。スター数は注目度の指標であり、品質の保証ではありません。
README.md
オリジナルBlockchain Visualization Widgets
Library of visual components to build data visualization interface to the blockchain data. Universal tool across all major blockchains ( ethereum, tron, bitcoin, zcash, many more...).
TLDR; Try https://explorer.bitquery.io which is open sourced and completely built using widgets. Javascript programmers may start with JSFiddle examples.
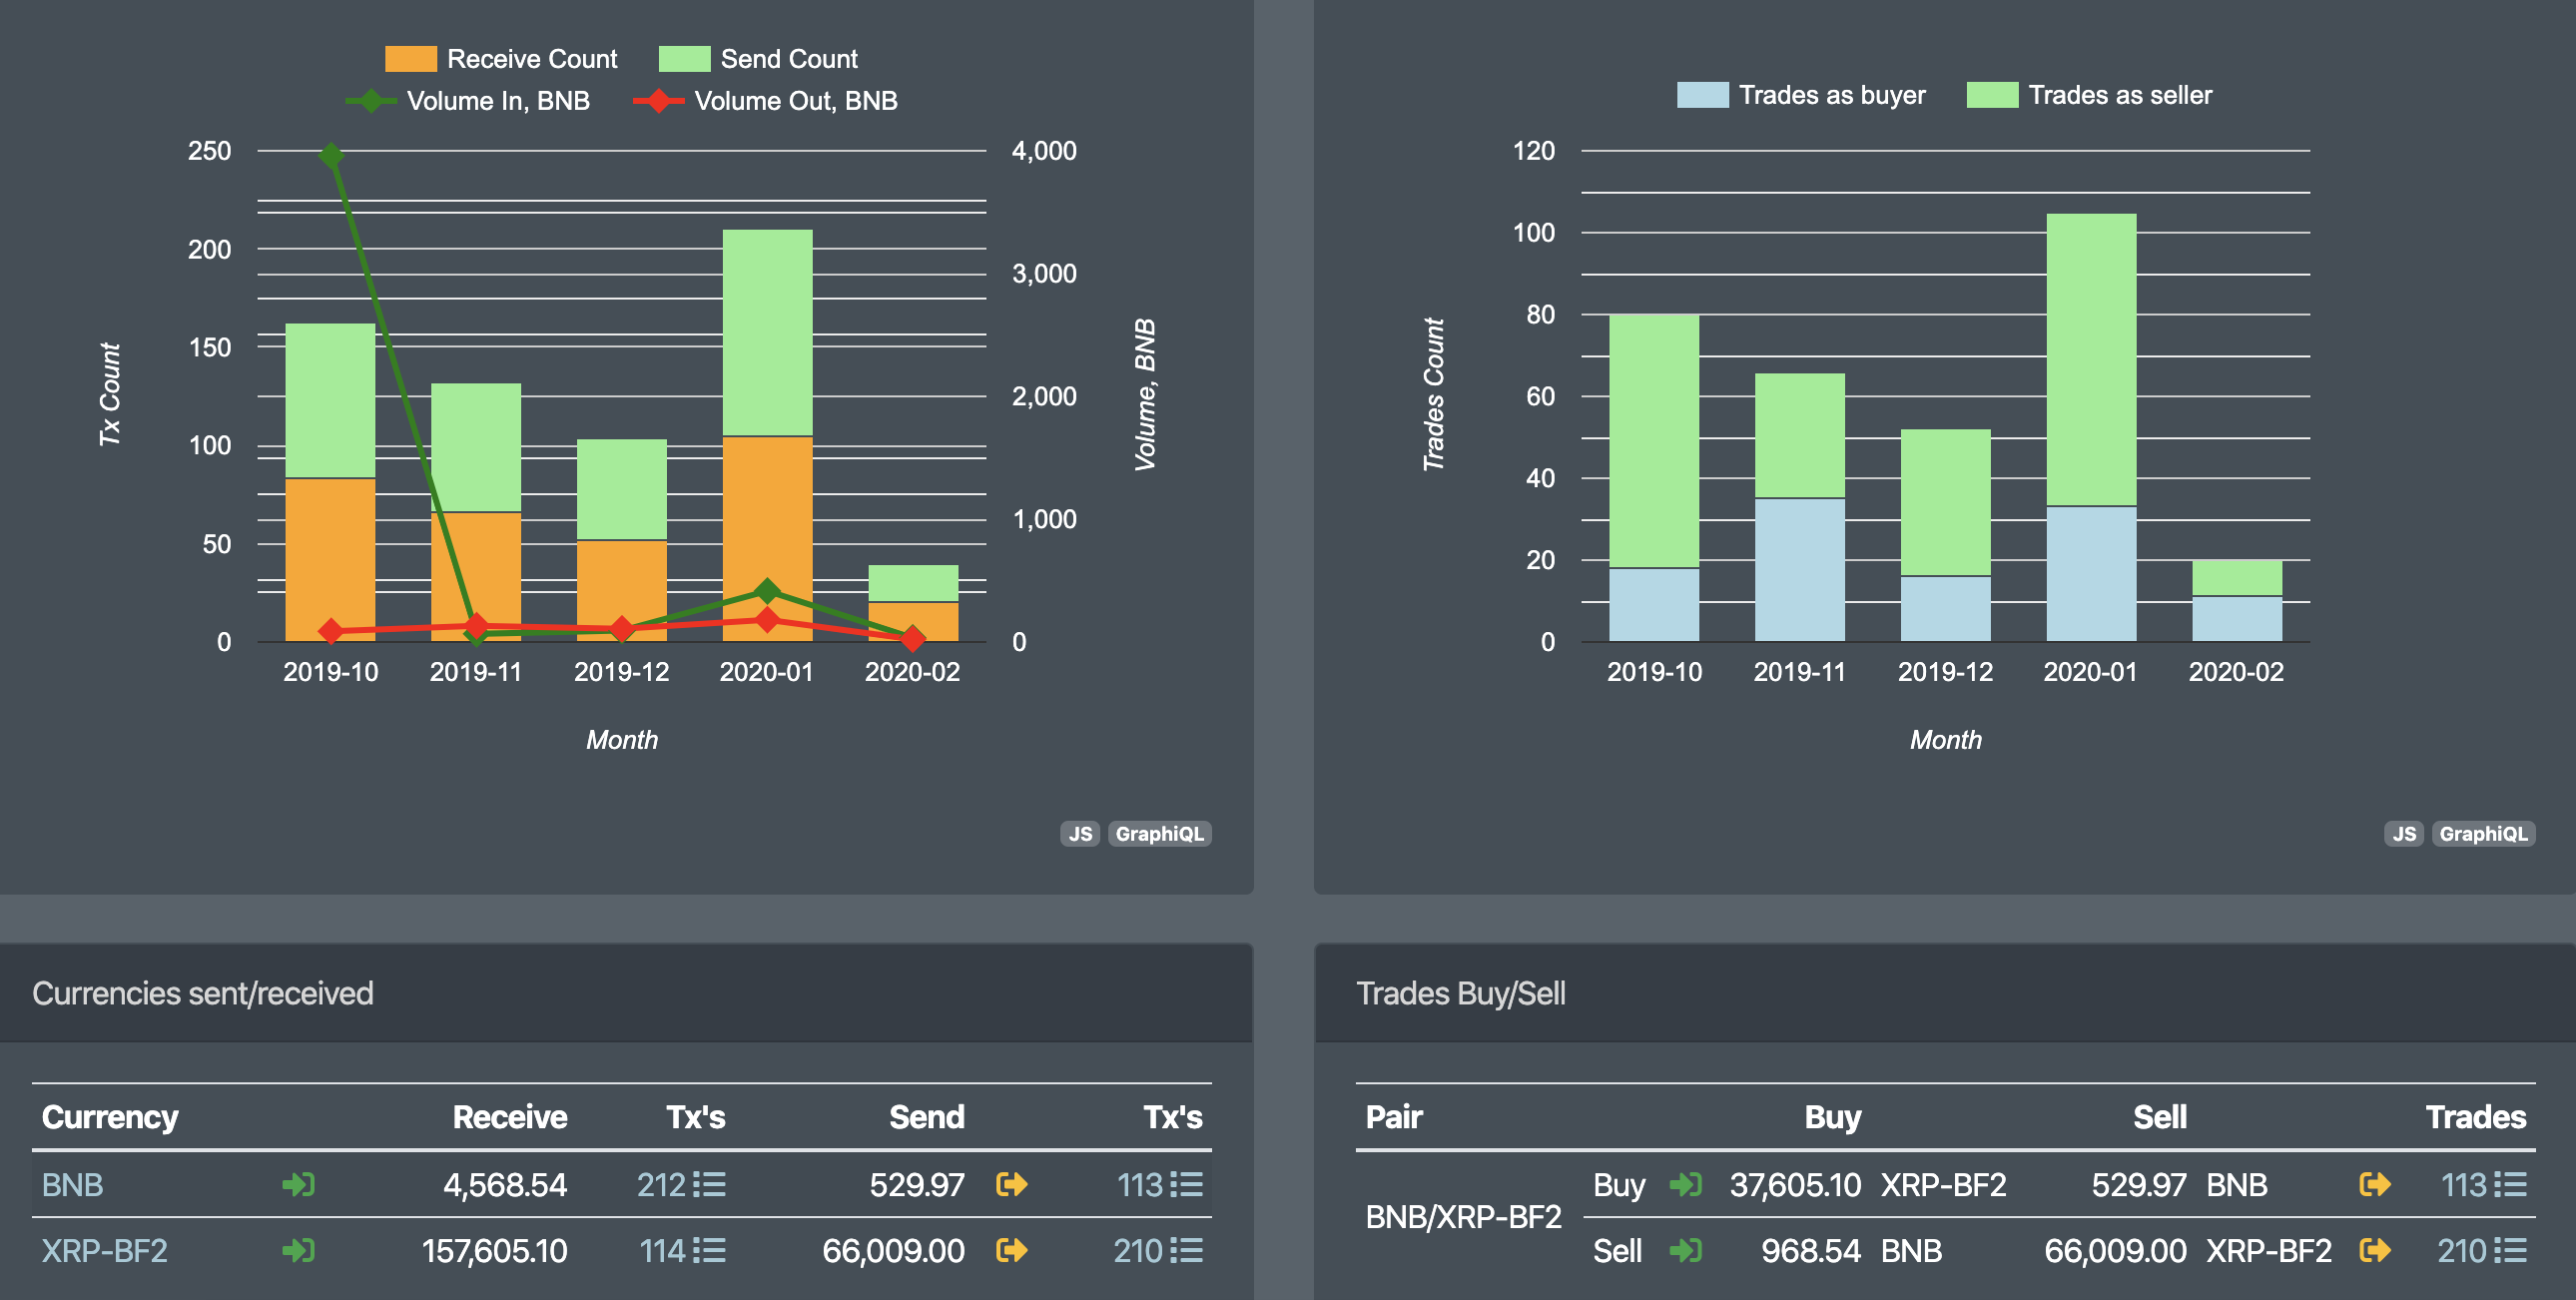
Every widget is a reusable visualization component to display the data from blockchain. Typically every widget is displaying a result set from GraphQL request.
Usage
To start with, look our wiki. You do not need programming skills to use and embed widgets, most tasks can be done by examples. To use specialized filtering and data querying you will need basic understanding of GraphQL language.
Setup
Clone this repo to your desktop and run
npm install
to install all the dependencies.
For widget developers
npm init -y
npm install webpack webpack-cli --save-dev
npm install --save graphql apollo-boost vue vue-i18n vue-google-charts vue-loader vue-template-compiler vue-template-loader lodash
npm install --save-dev sass-loader node-sass style-loader css-loader file-loader
npm install --save vis numeral
npm install --save react react-dom isomorphic-fetch graphiql
npm install --save-dev extract-text-webpack-plugin@next
npm install
run webpack
node_modules/.bin/webpack
run webpack autocompile for dev
node_modules/.bin/webpack --watch
License
You can check out the full license here
This project is licensed under the terms of the MIT license.
Credits
The project is developing with the Binance fellowship program support.
関連プロジェクトを探す
Asabeneh/30-Days-Of-Python
30 Days of Python プログラミングチャレンジは、Python プログラミング言語を 30 日で学ぶためのステップバイステップのガイドです。このチャレンジは 100 日以上かかることもあります。自分のペースで進めてください。こちらの動画も役立つかもしれません: https://www.youtube.com/channel/UC7PNRuno1rzYPb1xLa4yktw
78,560 スターgrafana/grafana
オープンで組み合わせ可能なオブザーバビリティおよびデータ可視化プラットフォームです。Prometheus、Loki、Elasticsearch、InfluxDB、Postgres など、複数のソースからメトリクス、ログ、トレースを可視化できます。
77,830 スターredis/redis
リアルタイムのデータ駆動型アプリケーションを構築する開発者にとって、Redis は最も選ばれ、最速で、機能が最も豊富なキャッシュ、データ構造サーバー、ドキュメントおよびベクトルクエリエンジンです。
77,395 スターapache/superset
Apache Superset は、データ可視化とデータ探索のためのプラットフォームです。
75,473 スター