
UdaraJay/Stats has 329 GitHub stars and 23 forks. GitHot measured 0 stars in 24 hours. Last checked 2026-11-12 07:28 UTC. Last push 2025-06-17.
Standalone analytics server and realtime dashboard designed for self-hosting.
できること
- Real-time analytics and dashboard
- Lightweight and efficient, with minimal resource usage
- Easy integration with websites, mobile apps, and other platforms
計測したスター増加
- 24時間
- 0
- 7日間
- 更新が遅れています
- 15日間
- 更新が遅れています
- 1か月
- 更新が遅れています
期間ごとの純増数です。期間は重複しており、日別の値ではありません。未計測の値は空欄です。スター数は注目度の指標であり、品質の保証ではありません。
README.md
オリジナルStats
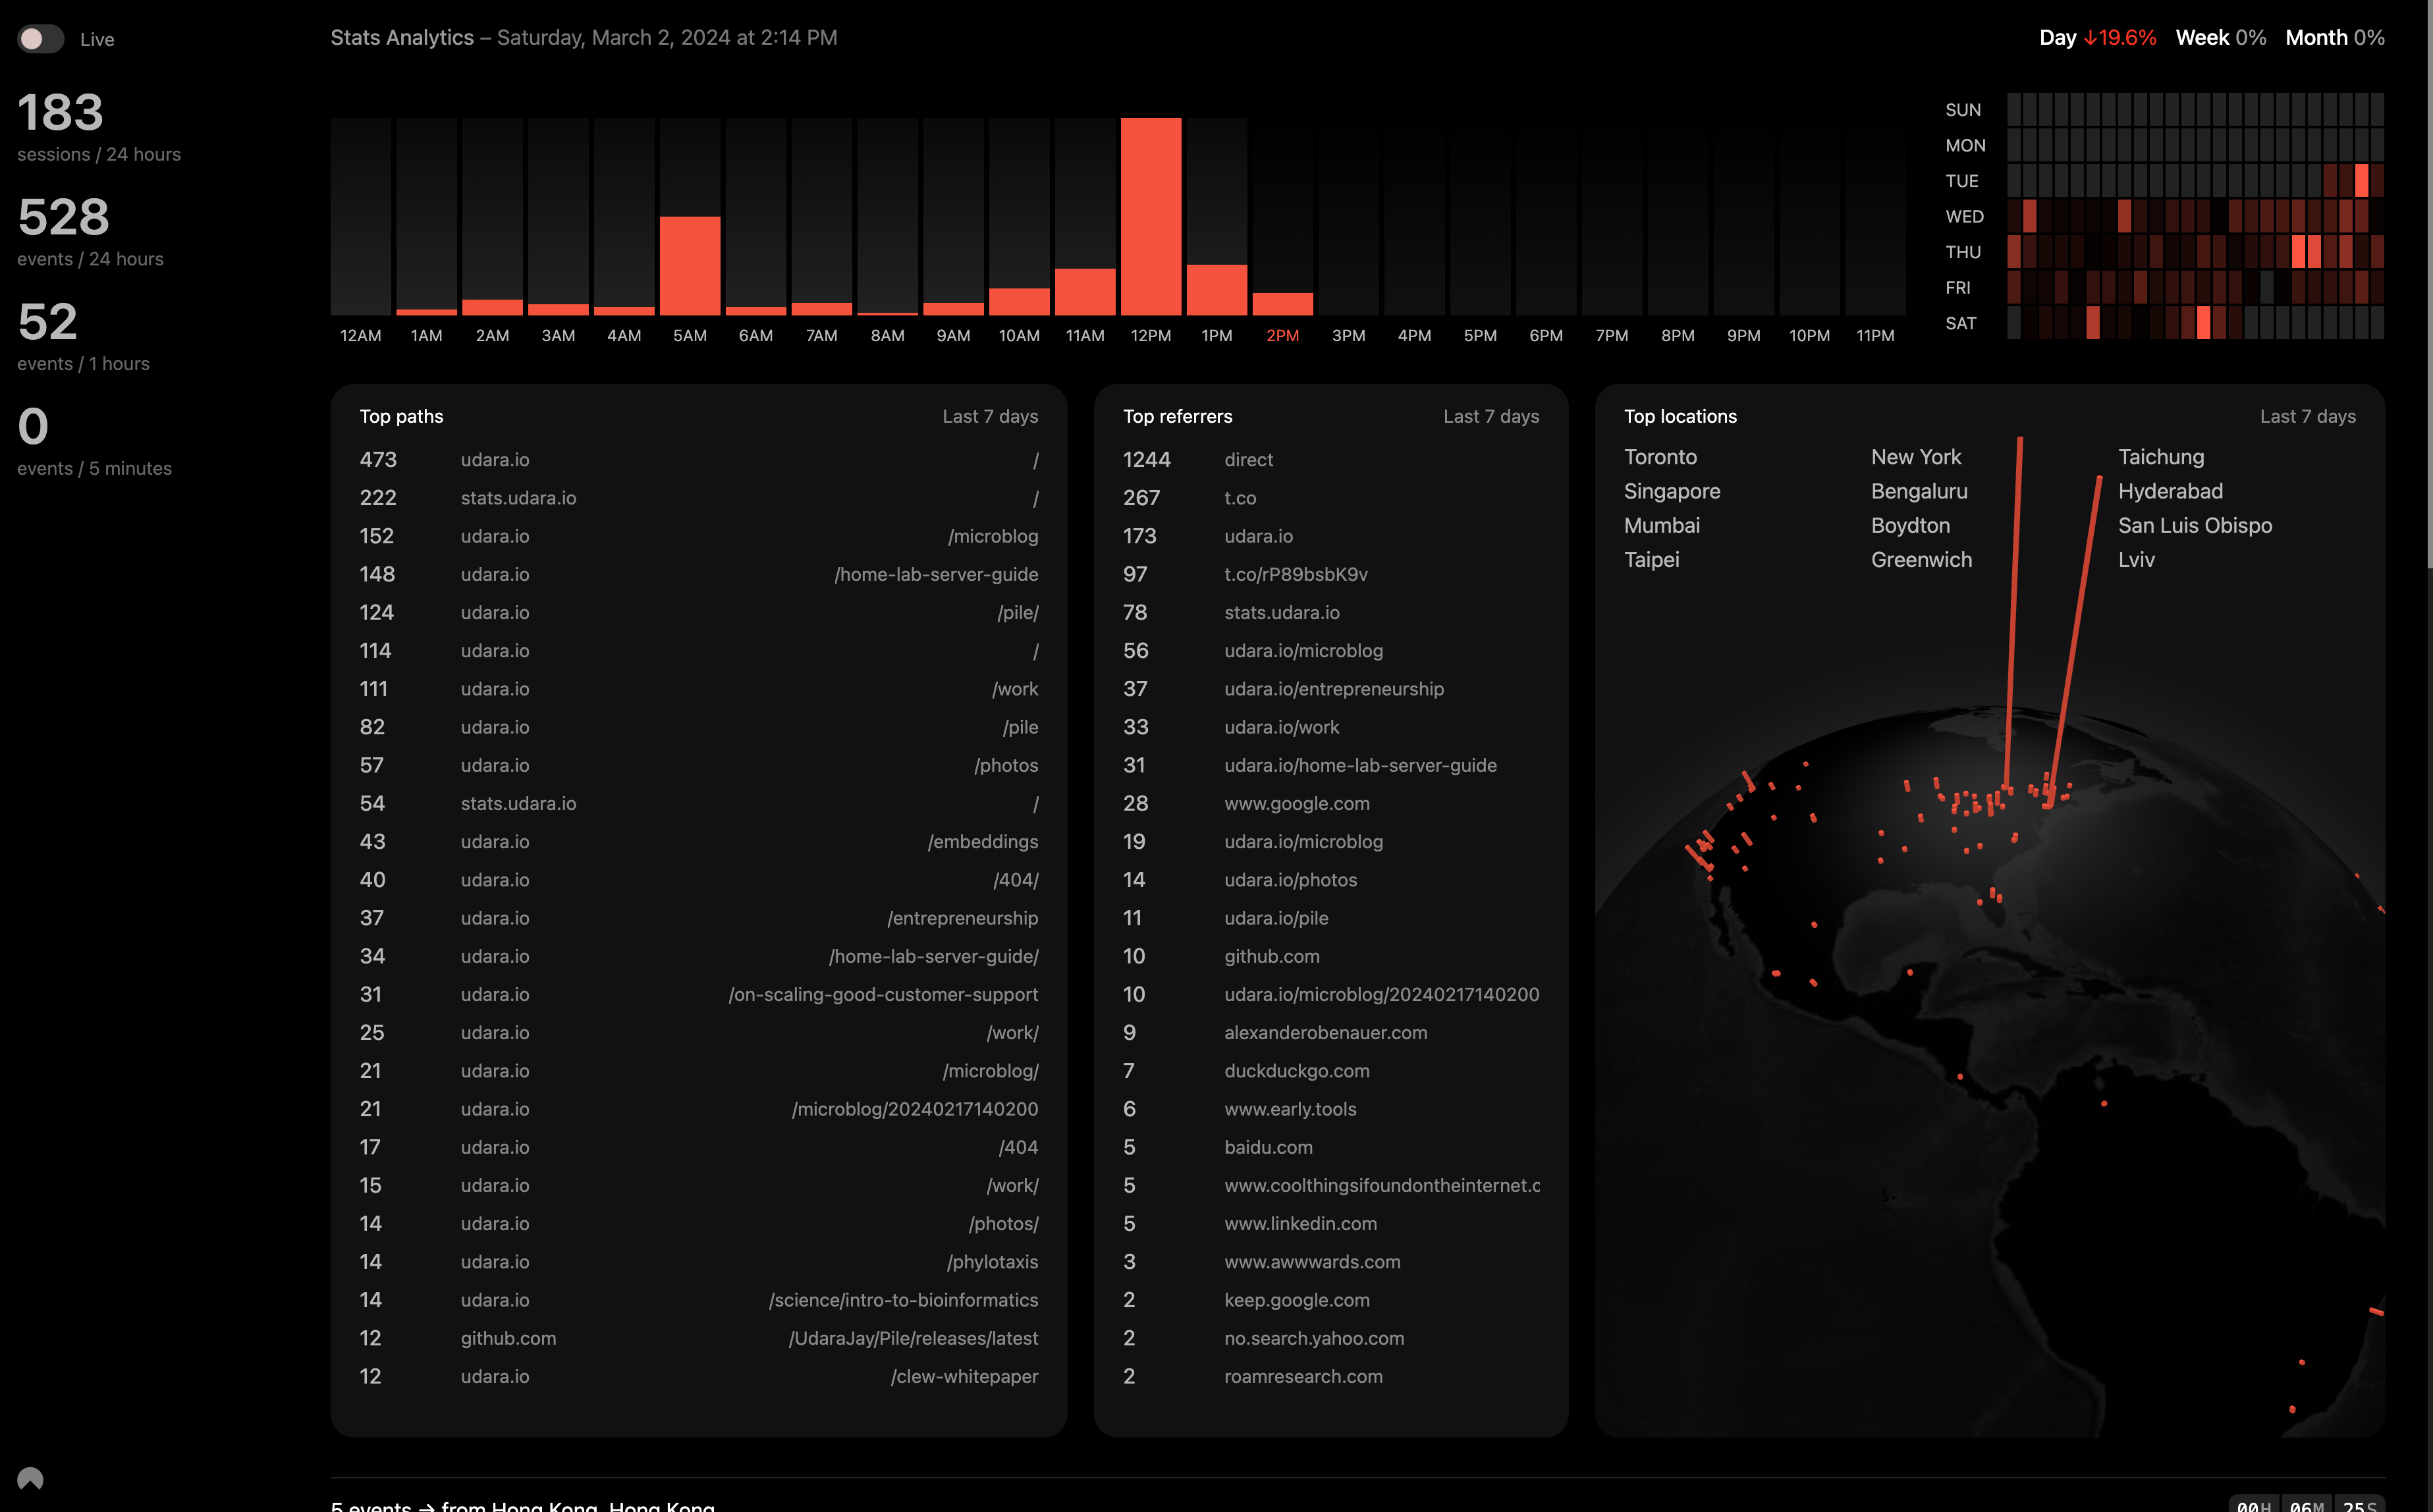
Stats is a high-performance, standalone analytics provider designed for self-hosting, enabling the collection and viewing of event data from websites, apps, and more through a web API. It comes with a real-time dashboard and is ideal as a minimal and privacy-preserving analytics solution for small to medium traffic services.
Current status: it works, but it's not finished.
Key-features
- Real-time analytics and dashboard
- Lightweight and efficient, with minimal resource usage
- Easy integration with websites, mobile apps, and other platforms
Getting started
To get started with Stats, you'll need to compile an executable for your server, run it, and host it. While this guide focuses on using Nginx as a reverse proxy, Stats is versatile enough to be deployed in various environments, including Docker containers, for enhanced portability and scalability.
Run in development-mode
RUST_LOG=debug cargo run
Build production release
cargo build --release
This will create the executable file you need in the /target/release/ folder
Embed events collector
You use this to automatically collect pageviews or other events triggered by calling stats_collect('event_name', 'optinal_url_override') from javascript once the script below is initialized.
When you add this script to a new domain, you must add them to the CORS_DOMAINS list on the backend so the server can receive data from them.
<script>
  // Stats analytics
  var head = document.head || document.getElementsByTagName("head")[0];
  var script = document.createElement("script");
  script.setAttribute("src", "http://localhost:5775/stats.js"); // REPLACE WITH ACTUAL URL
  script.setAttribute("onload", () => window.collectStats());
  script.setAttribute("type", "text/javascript");
  script.setAttribute("charset", "utf8");
  script.setAttribute("async", "");
  head.appendChild(script);
</script>
Setup
Minimum set of folders & files required to run this application.
stats/
├── data/
│ ├── GeoLite2-City.mmdb
│ ├── cities5000.txt
│ └── stats.sqlite
├── ui/
├── stats // copy executable from target/release/stats
└── .env
Configuration
These options must be defined in a .env file before starting the server.
| Variable | Default | Summary |
|---|---|---|
| APP_URL | http://localhost:5775 | Full domain you are hosting this service on |
| SERVICE_PORT | 5775 | Port you want the service to be hosted from |
| DATABASE_URL | /data/stats.sqlite | Path to .sqlite file to use as database. |
| CORS_DOMAINS | http://localhost:5775,https://udara.io | Comma-separated list of allowed domains. The service will only accept analytics events from these domains. |
| PROCESSING_BATCH_SIZE | 500 | Max limit for events buffer used to queue and batch analytics events for processing. When the limit is hit, new events are dropped until items are processed from the queue. |
関連プロジェクトを探す
Asabeneh/30-Days-Of-Python
30 Days of Python プログラミングチャレンジは、Python プログラミング言語を 30 日で学ぶためのステップバイステップのガイドです。このチャレンジは 100 日以上かかることもあります。自分のペースで進めてください。こちらの動画も役立つかもしれません: https://www.youtube.com/channel/UC7PNRuno1rzYPb1xLa4yktw
78,618 スターgrafana/grafana
オープンで組み合わせ可能なオブザーバビリティおよびデータ可視化プラットフォームです。Prometheus、Loki、Elasticsearch、InfluxDB、Postgres など、複数のソースからメトリクス、ログ、トレースを可視化できます。
77,859 スターredis/redis
リアルタイムのデータ駆動型アプリケーションを構築する開発者にとって、Redis は最も選ばれ、最速で、機能が最も豊富なキャッシュ、データ構造サーバー、ドキュメントおよびベクトルクエリエンジンです。
77,472 スターapache/superset
Apache Superset は、データ可視化とデータ探索のためのプラットフォームです。
75,495 スター