
Rello/analytics has 138 GitHub stars and 39 forks. GitHot measured 0 stars in 24 hours, 0 in 7 days, and 0 in 15 days. Last checked 2026-11-19 12:22 UTC. Last push 2026-11-15.
計測したスター増加
- 24時間
- 0
- 7日間
- 0
- 15日間
- 0
- 1か月
- 履歴を収集中
期間ごとの純増数です。期間は重複しており、日別の値ではありません。未計測の値は空欄です。スター数は注目度の指標であり、品質の保証ではありません。
概要
Analytics - Open source data warehouse and reporting for Nextcloud
データREADME.md
オリジナルAnalytics for Nextcloud
Business intelligence and reporting within Nextcloud.
Turn operational data into a shared basis for decisions. Analytics helps business teams connect data sources, monitor key performance indicators, and publish interactive reports and management dashboards in their existing Nextcloud environment.
From recurring departmental reports to executive overviews, Analytics brings data preparation, visualization, and collaboration into one workflow. Your Analytics datasets and reports are hosted in your Nextcloud instance, under your organization's control.
Business value
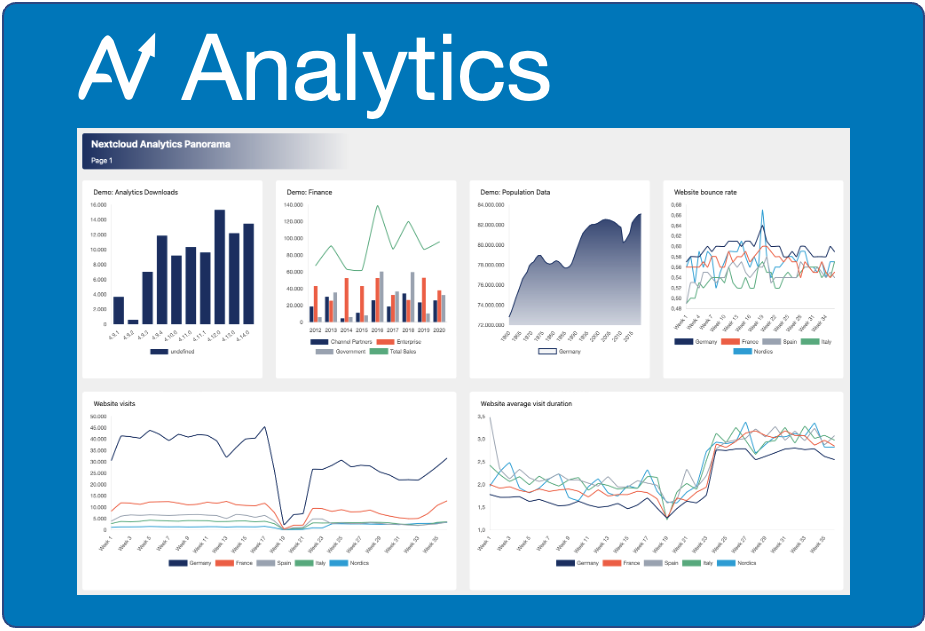
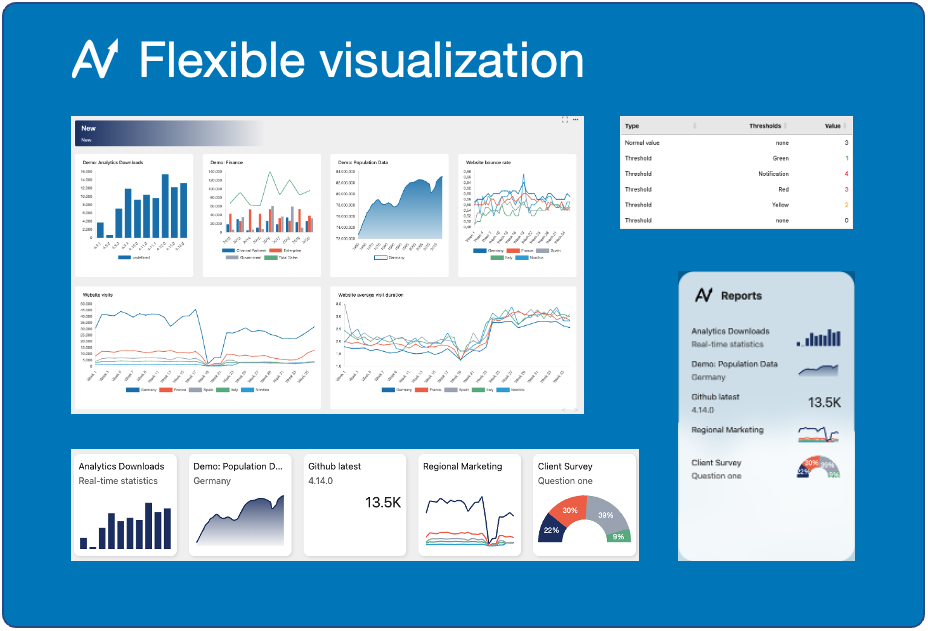
- Give teams a shared view of performance. Bring reports together in panoramas: multi-page dashboards combining charts, tables, text, and images.
- Reduce recurring reporting work. Reuse datasets across reports and schedule data loads instead of repeating manual imports.
- Explore the drivers behind the numbers. Filter, drill down, aggregate, and calculate measures using visual configuration and live previews.
- Keep reporting close to collaboration. Share reports and panoramas with Nextcloud users and groups, or reach external audiences through share links.
- Retain control of your reporting environment. Run Analytics within Nextcloud and choose which data sources to connect and which reports to share.
Typical business applications
| Team | Example use |
|---|---|
| Management | Combine departmental KPIs and commentary into a shared performance overview. |
| Finance and controlling | Compare revenue, costs, and budget figures from connected files or imported datasets. |
| Operations | Track volumes, service metrics, and trends; highlight values that cross defined thresholds. |
| Project and service teams | Turn survey responses and structured operational data into progress and quality reports. |
Capabilities
Connect and prepare data
- Bring together spreadsheets, business systems, and data from Nextcloud Files, Forms, and Tables.
- Configure data sources visually with intuitive field selection and live data previews.
- Combine current figures and historical data for recurring reporting and long-term comparisons.
- Reuse your data across reports to give teams a consistent basis for analysis.
Analyze and present
- Build interactive charts and tables with visual configuration and live previews.
- Explore performance with filters, drilldowns, calculated measures, and trends.
- Assemble multi-page panoramas with reports, explanatory text, and images.
- Export dashboards and charts for meetings, presentations, and stakeholder updates.
Automate and collaborate
- Keep reports current with scheduled updates and automated workflows.
- Highlight exceptions with color coding and notifications.
- Share with teams and external stakeholders while controlling access to your reports.
- Bring live charts and tables into everyday work across Nextcloud.
- Explore deeper insights with Nextcloud Assistant. Ask questions about your data in natural language.
Documentation
Languages
Support translations on Transifex.
Maintainers
- Marcel Scherello (author, project leader)


