
thongekchakrit/ChartAI
thongekchakrit/ChartAI has 78 GitHub stars and 21 forks. Star changes are not measured yet. Last checked 2026-11-10 04:23 UTC. Last push 2023-06-16.
Comment ces chiffres sont mesurés
A Streamlit powered GPT-3 Application that allows you to chat with tabular data. In addition to AI Chart creation, insights are given too.
What you can do
- Generate insights to the tabular data, you can upload your CSV file and ask any question about it.
- Text to Chart/Graph
- The Graph that has been created is draggable and resizable
Progression mesurée des étoiles
- in 24h
- Mise à jour retardée
- in 7 days
- Mise à jour retardée
- in 15 days
- Mise à jour retardée
- in 1 month
- Mise à jour retardée
Variations nettes sur des périodes qui se chevauchent, pas des totaux quotidiens. Les mesures absentes restent vides. Les étoiles indiquent l’intérêt, pas la qualité.
README.md
OriginalChartAI - Text to Graph/Charts and Insights
This web application is built using python, streamlit, python enabled html, Nivo Chart and mui.
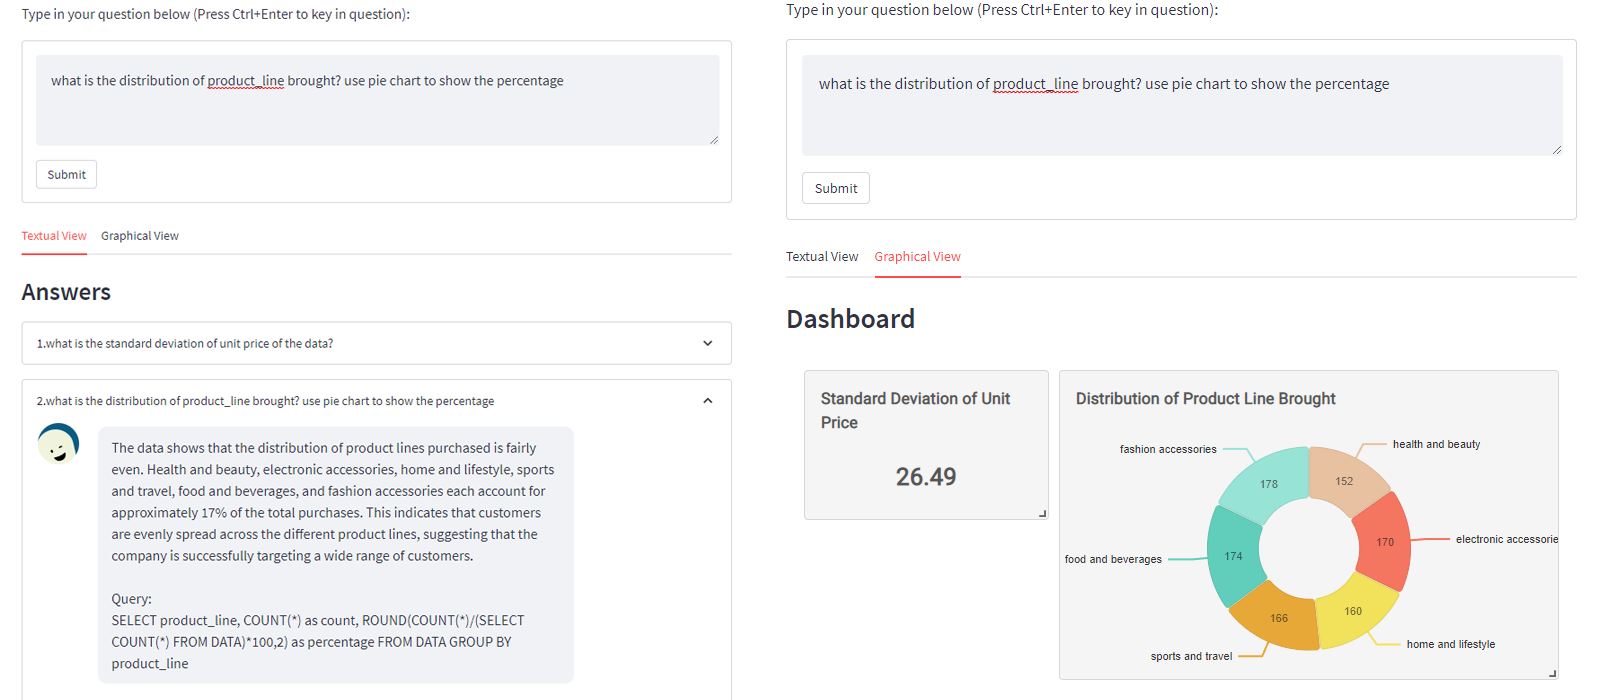
Features
- Generate insights to the tabular data, you can upload your CSV file and ask any question about it.
- Text to SQL
- Text to Chart/Graph
- The Graph that has been created is draggable and resizable
Current supported chart types:
-Bar Chart
-Line Plot
-Scatter Plot
-Swarm Plot
-Pie Chart
How to use the Repository
To start using the repository, first clone the project into your local pc
git clone https://github.com/thongekchakrit/automated-data-analysis.git
Next, open the file location in any Python IDE, I highly recommend PyCharm. Then, navigate to the folder > .streamlit (as shown in the picture below), create a file called secrets.toml
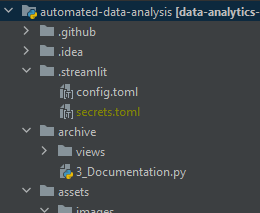
Within secrets.toml file add your OpenAI API key into the file (as shown below). This will allow streamlit to pick up the secrets.
gpt_secret = "<YOUR-API-KEY>"
Once done, install the requirements for the project.
pip install -r requirements.txt
To run the application. Within the terminal of the IDE do:
streamlit run Home.py
Access the site using: http://localhost:8501
Contribution
Please feel free to contribute to the repository.
Fork the application, make edits and perform a pull request.
Explorer des projets similaires
Asabeneh/30-Days-Of-Python
Le défi de programmation 30 Days of Python est un guide pas à pas pour apprendre le langage de programmation Python en 30 jours. Ce défi peut prendre plus de 100 jours. Avancez à votre rythme. Ces vidéos peuvent aussi vous aider : https://www.youtube.com/channel/UC7PNRuno1rzYPb1xLa4yktw
78,560 étoilesgrafana/grafana
Plateforme ouverte et composable d’observabilité et de visualisation de données. Visualise les métriques, les journaux et les traces issus de plusieurs sources, comme Prometheus, Loki, Elasticsearch, InfluxDB, Postgres et bien d’autres.
77,830 étoilesredis/redis
Pour les développeurs qui créent des applications en temps réel pilotées par les données, Redis est le cache, le serveur de structures de données et le moteur de requêtes documentaires et vectorielles préféré, le plus rapide et le plus riche en fonctionnalités.
77,395 étoilesapache/superset
Apache Superset est une plateforme de visualisation et d'exploration de données.
75,473 étoiles