
spsanderson/healthyR
spsanderson/healthyR has 33 GitHub stars and 3 forks. GitHot measured 0 stars in 24 hours. Last checked 2026-11-13 03:38 UTC. Last push 2025-12-31.
Comment ces chiffres sont mesurés
Hospital Data Analysis Workflow Tools
What you can do
- 📊 Time Series Analysis: Advanced tools for analyzing hospital census, length of stay (LOS), readmission rates, and other temporal metrics
- 📈 Visualization: Ready-to-use plotting functions for common healthcare analytics use cases
- 🏥 Service Line Grouping: Automated patient classification into service lines based on ICD-10 codes and DRG
- 📉 Performance Metrics: Calculate and visualize key hospital performance indicators including ALOS (Average Length of Stay), readmission rates, and LOS/Readmit indices
Progression mesurée des étoiles
- in 24h
- 0
- in 7 days
- Historique en cours
- in 15 days
- Historique en cours
- in 1 month
- Historique en cours
Variations nettes sur des périodes qui se chevauchent, pas des totaux quotidiens. Les mesures absentes restent vides. Les étoiles indiquent l’intérêt, pas la qualité.
README.md
OriginalhealthyR 


Overview
To view the full wiki, click here: Full healthyR Wiki
healthyR is a comprehensive R package designed to streamline hospital data analysis workflows. It provides a consistent, intuitive framework for analyzing common administrative and clinical data problems, helping healthcare analysts and data scientists quickly generate insights from hospital data.
Key Features
- 📊 Time Series Analysis: Advanced tools for analyzing hospital census, length of stay (LOS), readmission rates, and other temporal metrics
- 📈 Visualization: Ready-to-use plotting functions for common healthcare analytics use cases
- 🏥 Service Line Grouping: Automated patient classification into service lines based on ICD-10 codes and DRG
- 📉 Performance Metrics: Calculate and visualize key hospital performance indicators including ALOS (Average Length of Stay), readmission rates, and LOS/Readmit indices
- 🎨 Accessible Design: Color-blind friendly palettes and themes for inclusive data visualization
- 🔧 Utility Functions: Helper functions for data manipulation, Excel export, and SQL-style string operations
What Problems Does healthyR Solve?
healthyR takes the guesswork out of common hospital data analysis tasks:
- Calculate average length of stay across different time periods and patient populations
- Analyze readmission rates and identify trends
- Create service line classifications from diagnosis and procedure codes
- Generate publication-ready visualizations of hospital metrics
- Perform census and capacity planning analyses
- Identify outliers and excess utilization patterns
Installation
You can install the released version of healthyR from CRAN with:
install.packages("healthyR")
And the development version from GitHub with:
# install.packages("devtools")
devtools::install_github("spsanderson/healthyR")
Quick Start
library(healthyR)
library(dplyr)
library(timetk)

# Load your hospital data
# Analyze time series patterns with time signatures
data_with_time_features <- ts_signature_tbl(
  .data = your_data,
  .date_col = admission_date
)

# Visualize average length of stay trends
ts_alos_plt(
  .data = your_data,
  .date_col = discharge_date,
  .value_col = length_of_stay,
  .by_grouping = "month"
)

# Create service line classifications
data_with_service_line <- your_data %>%
  mutate(
    service_line = service_line_vec(
      .data = .,
      .dx_col = principal_dx,
      .px_col = principal_px,
      .drg_col = drg_number
    )
  )
Core Functionality
Time Series Analysis
healthyR provides powerful tools for temporal analysis of hospital data.
Time Signature Features
Add time-based features to your data for advanced analysis:
library(healthyR)
library(timetk)

ts_signature_tbl(.data = m4_daily, .date_col = date)
#> # A tibble: 17,578 × 31
#>    id    date       value index.num  diff  year year.iso  half quarter month
#>    <fct> <date>     <dbl>     <dbl> <dbl> <int>    <int> <int>   <int> <int>
#>  1 D410  1978-06-23 9109. 267408000    NA  1978     1978     1       2     6
#>  2 D410  1978-06-24 9103. 267494400 86400  1978     1978     1       2     6
#>  3 D410  1978-06-25 9116. 267580800 86400  1978     1978     1       2     6
#>  4 D410  1978-06-26 9116. 267667200 86400  1978     1978     1       2     6
#>  5 D410  1978-06-27 9106. 267753600 86400  1978     1978     1       2     6
#>  6 D410  1978-06-28 9094. 267840000 86400  1978     1978     1       2     6
#>  7 D410  1978-06-29 9094. 267926400 86400  1978     1978     1       2     6
#>  8 D410  1978-06-30 9084. 268012800 86400  1978     1978     1       2     6
#>  9 D410  1978-07-01 9081. 268099200 86400  1978     1978     2       3     7
#> 10 D410  1978-07-02 9047. 268185600 86400  1978     1978     2       3     7
#> # ℹ 17,568 more rows
#> # ℹ 21 more variables: month.xts <int>, month.lbl <ord>, day <int>, hour <int>,
#> #   minute <int>, second <int>, hour12 <int>, am.pm <int>, wday <int>,
#> #   wday.xts <int>, wday.lbl <ord>, mday <int>, qday <int>, yday <int>,
#> #   mweek <int>, week <int>, week.iso <int>, week2 <int>, week3 <int>,
#> #   week4 <int>, mday7 <int>
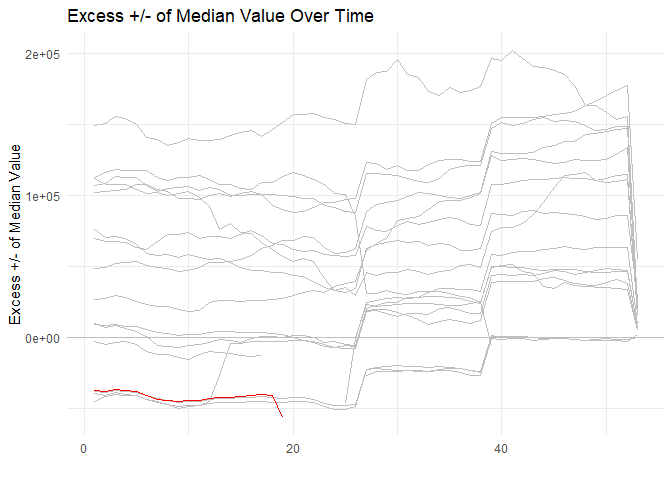
Median Excess Visualization
Identify patterns and outliers in time series data:
library(healthyR)
library(timetk)
library(dplyr)

ts_signature_tbl(.data = m4_daily, .date_col = date, .pad_time = TRUE, id) %>%
    ts_median_excess_plt(
        .date_col           = date
        , .value_col        = value
        , .x_axis           = week
        , .ggplot_group_var = year
        , .years_back       = 5
    )
Visualization Tools
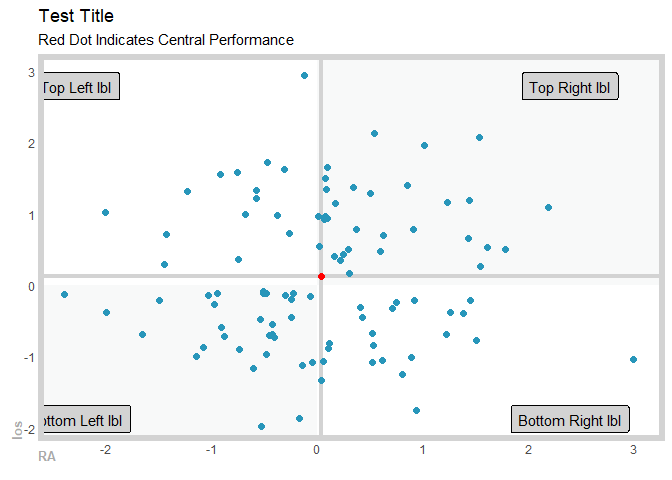
Gartner Magic Chart
Create quadrant charts for performance analysis (e.g., comparing length of stay vs readmission risk):
suppressPackageStartupMessages(library(healthyR))
suppressPackageStartupMessages(library(tibble))
suppressPackageStartupMessages(library(dplyr))

gartner_magic_chart_plt(
  .data = tibble(x = rnorm(100, 0, 1), y = rnorm(100, 0, 1))
  , .x_col = x
  , .y_col = y
  , .y_lab = "los"
  , .x_lab = "RA"
  , .plot_title = "Test Title"
  , .top_left_label = "Top Left lbl"
  , .top_right_label = "Top Right lbl"
  , .bottom_left_label = "Bottom Left lbl"
  , .bottom_right_label = "Bottom Right lbl"
)
Service Line Analysis
Automatically classify patients into service lines based on clinical codes:
# Example: Classify patients by service line
df <- data.frame(
  dx_col = "F10.10",  # ICD-10 diagnosis code
  px_col = NA,         # Procedure code (if applicable)
  drg_col = "896"      # DRG number
)

service_line_vec(
  .data = df,
  .dx_col = dx_col,
  .px_col = px_col,
  .drg_col = drg_col
)
Function Categories
📊 Time Series & Plotting Functions
ts_signature_tbl()- Add time-based features to your datats_alos_plt()- Plot average length of stay over timets_readmit_rate_plt()- Visualize readmission ratests_median_excess_plt()- Identify excess utilization patternsts_census_los_daily_tbl()- Calculate daily census and LOS metricsts_plt()- General time series plotting
📈 Performance Metrics
los_ra_index_summary_tbl()- Calculate LOS and readmission indiceslos_ra_index_plt()- Visualize performance indicesgartner_magic_chart_plt()- Create quadrant performance chartsdiverging_bar_plt()- Show positive/negative deviationsdiverging_lollipop_plt()- Lollipop charts for variance analysis
🏥 Data Transformation Functions
service_line_vec()- Classify patients into service linesservice_line_augment()- Add service line column to your datacategory_counts_tbl()- Get frequency counts by categorytop_n_tbl()- Extract top N records by criterianamed_item_list()- Create named lists for Excel export
🎨 Accessibility Features
color_blind()- Color-blind friendly palettehr_scale_fill_colorblind()- ggplot2 fill scale for accessibilityhr_scale_color_colorblind()- ggplot2 color scale for accessibility
🔧 Utility Functions
save_to_excel()- Export data to Excel with timestampopt_bin()- Calculate optimal bin size for histogramssql_left(),sql_right(),sql_mid()- SQL-style string operations
Documentation
- 📚 Function Reference - Complete documentation of all functions
- 🚀 Getting Started Vignette - Detailed introduction and tutorials
- 📰 News & Changelog - Latest updates and changes
Data Included
healthyR includes reference datasets for service line classification:
dx_cc_mapping- ICD-10 diagnosis code mappings for condition categoriespx_cc_mapping- ICD-10 procedure code mappings for procedure categories
Contributing
We welcome contributions! Please see our Contributing Guidelines for details on:
- Reporting bugs
- Suggesting new features
- Submitting pull requests
- Code of conduct
Getting Help
If you encounter issues or have questions:
- Check the function documentation
- Review the Getting Started vignette
- Search existing issues
- Open a new issue with a reproducible example
Citation
If you use healthyR in your research or publications, please cite it:
citation("healthyR")
License
MIT © Steven P. Sanderson II, MPH
Author
Steven P. Sanderson II, MPH - Website: https://www.spsanderson.com - GitHub: @spsanderson - ORCID: 0009-0006-7661-8247
Explorer des projets similaires
Asabeneh/30-Days-Of-Python
Le défi de programmation 30 Days of Python est un guide pas à pas pour apprendre le langage de programmation Python en 30 jours. Ce défi peut prendre plus de 100 jours. Avancez à votre rythme. Ces vidéos peuvent aussi vous aider : https://www.youtube.com/channel/UC7PNRuno1rzYPb1xLa4yktw
78,618 étoilesgrafana/grafana
Plateforme ouverte et composable d’observabilité et de visualisation de données. Visualise les métriques, les journaux et les traces issus de plusieurs sources, comme Prometheus, Loki, Elasticsearch, InfluxDB, Postgres et bien d’autres.
77,859 étoilesredis/redis
Pour les développeurs qui créent des applications en temps réel pilotées par les données, Redis est le cache, le serveur de structures de données et le moteur de requêtes documentaires et vectorielles préféré, le plus rapide et le plus riche en fonctionnalités.
77,472 étoilesapache/superset
Apache Superset est une plateforme de visualisation et d'exploration de données.
75,495 étoiles