
ranaroussi/quantstats
ranaroussi/quantstats has 7,847 GitHub stars and 1,286 forks. GitHot measured +6 stars in 24 hours and +63 in 7 days. Last checked 2026-11-10 21:28 UTC. Last push 2026-11-02.
Comment ces chiffres sont mesurés
Portfolio analytics for quants, written in Python
Progression mesurée des étoiles
- in 24h
- +6
- in 7 days
- +63
- in 15 days
- Mise à jour retardée
- in 1 month
- Mise à jour retardée
Variations nettes sur des périodes qui se chevauchent, pas des totaux quotidiens. Les mesures absentes restent vides. Les étoiles indiquent l’intérêt, pas la qualité.
README.md
Original


QuantStats: Portfolio analytics for quants
QuantStats Python library that performs portfolio profiling, allowing quants and portfolio managers to understand their performance better by providing them with in-depth analytics and risk metrics.
QuantStats is comprised of 3 main modules:
quantstats.stats- for calculating various performance metrics, like Sharpe ratio, Win rate, Volatility, etc.quantstats.plots- for visualizing performance, drawdowns, rolling statistics, monthly returns, etc.quantstats.reports- for generating metrics reports, batch plotting, and creating tear sheets that can be saved as an HTML file.
NEW! Monte Carlo Simulations
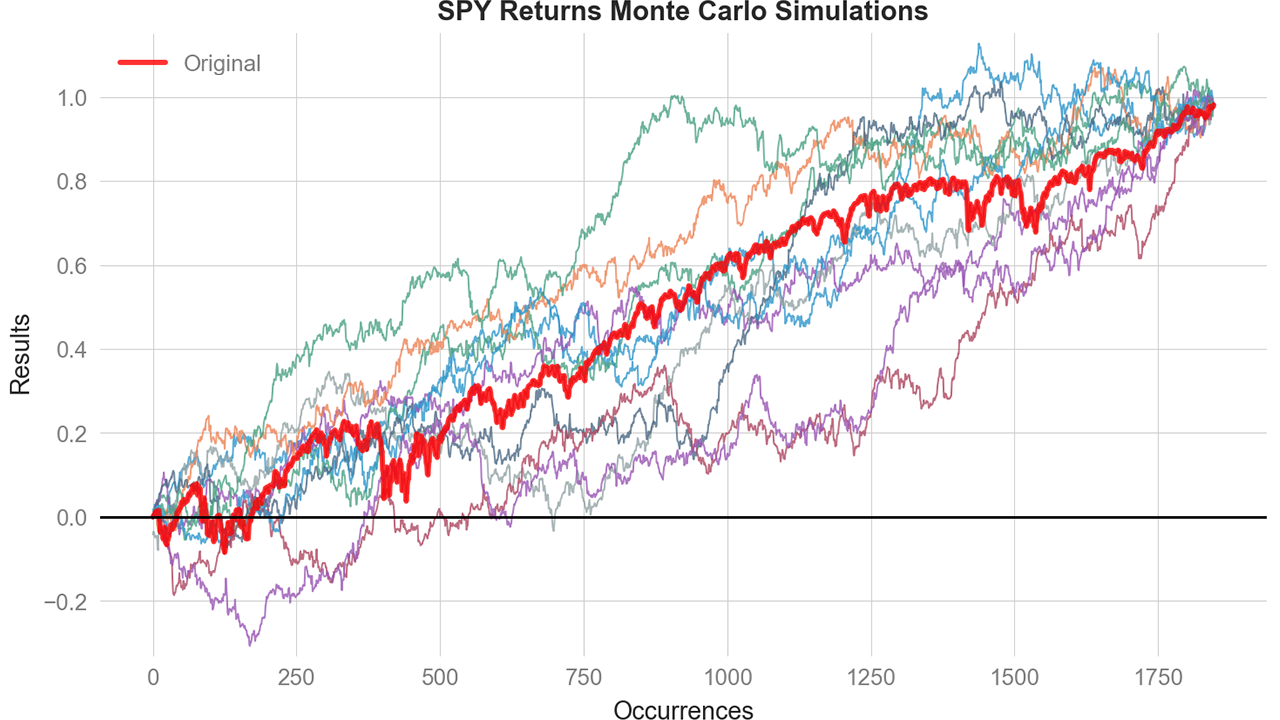
Run probabilistic risk analysis with built-in Monte Carlo simulations:
mc = qs.stats.montecarlo(returns, sims=1000, bust=-0.20, goal=0.50)
print(f"Bust probability: {mc.bust_probability:.1%}")
print(f"Goal probability: {mc.goal_probability:.1%}")
mc.plot()
Full Monte Carlo documentation »
Quick Start
%matplotlib inline
import quantstats as qs

# extend pandas functionality with metrics, etc.
qs.extend_pandas()

# fetch the daily returns for a stock
stock = qs.utils.download_returns('META')

# show sharpe ratio
qs.stats.sharpe(stock)

# or using extend_pandas() :)
stock.sharpe()
Output:
0.7604779884378278
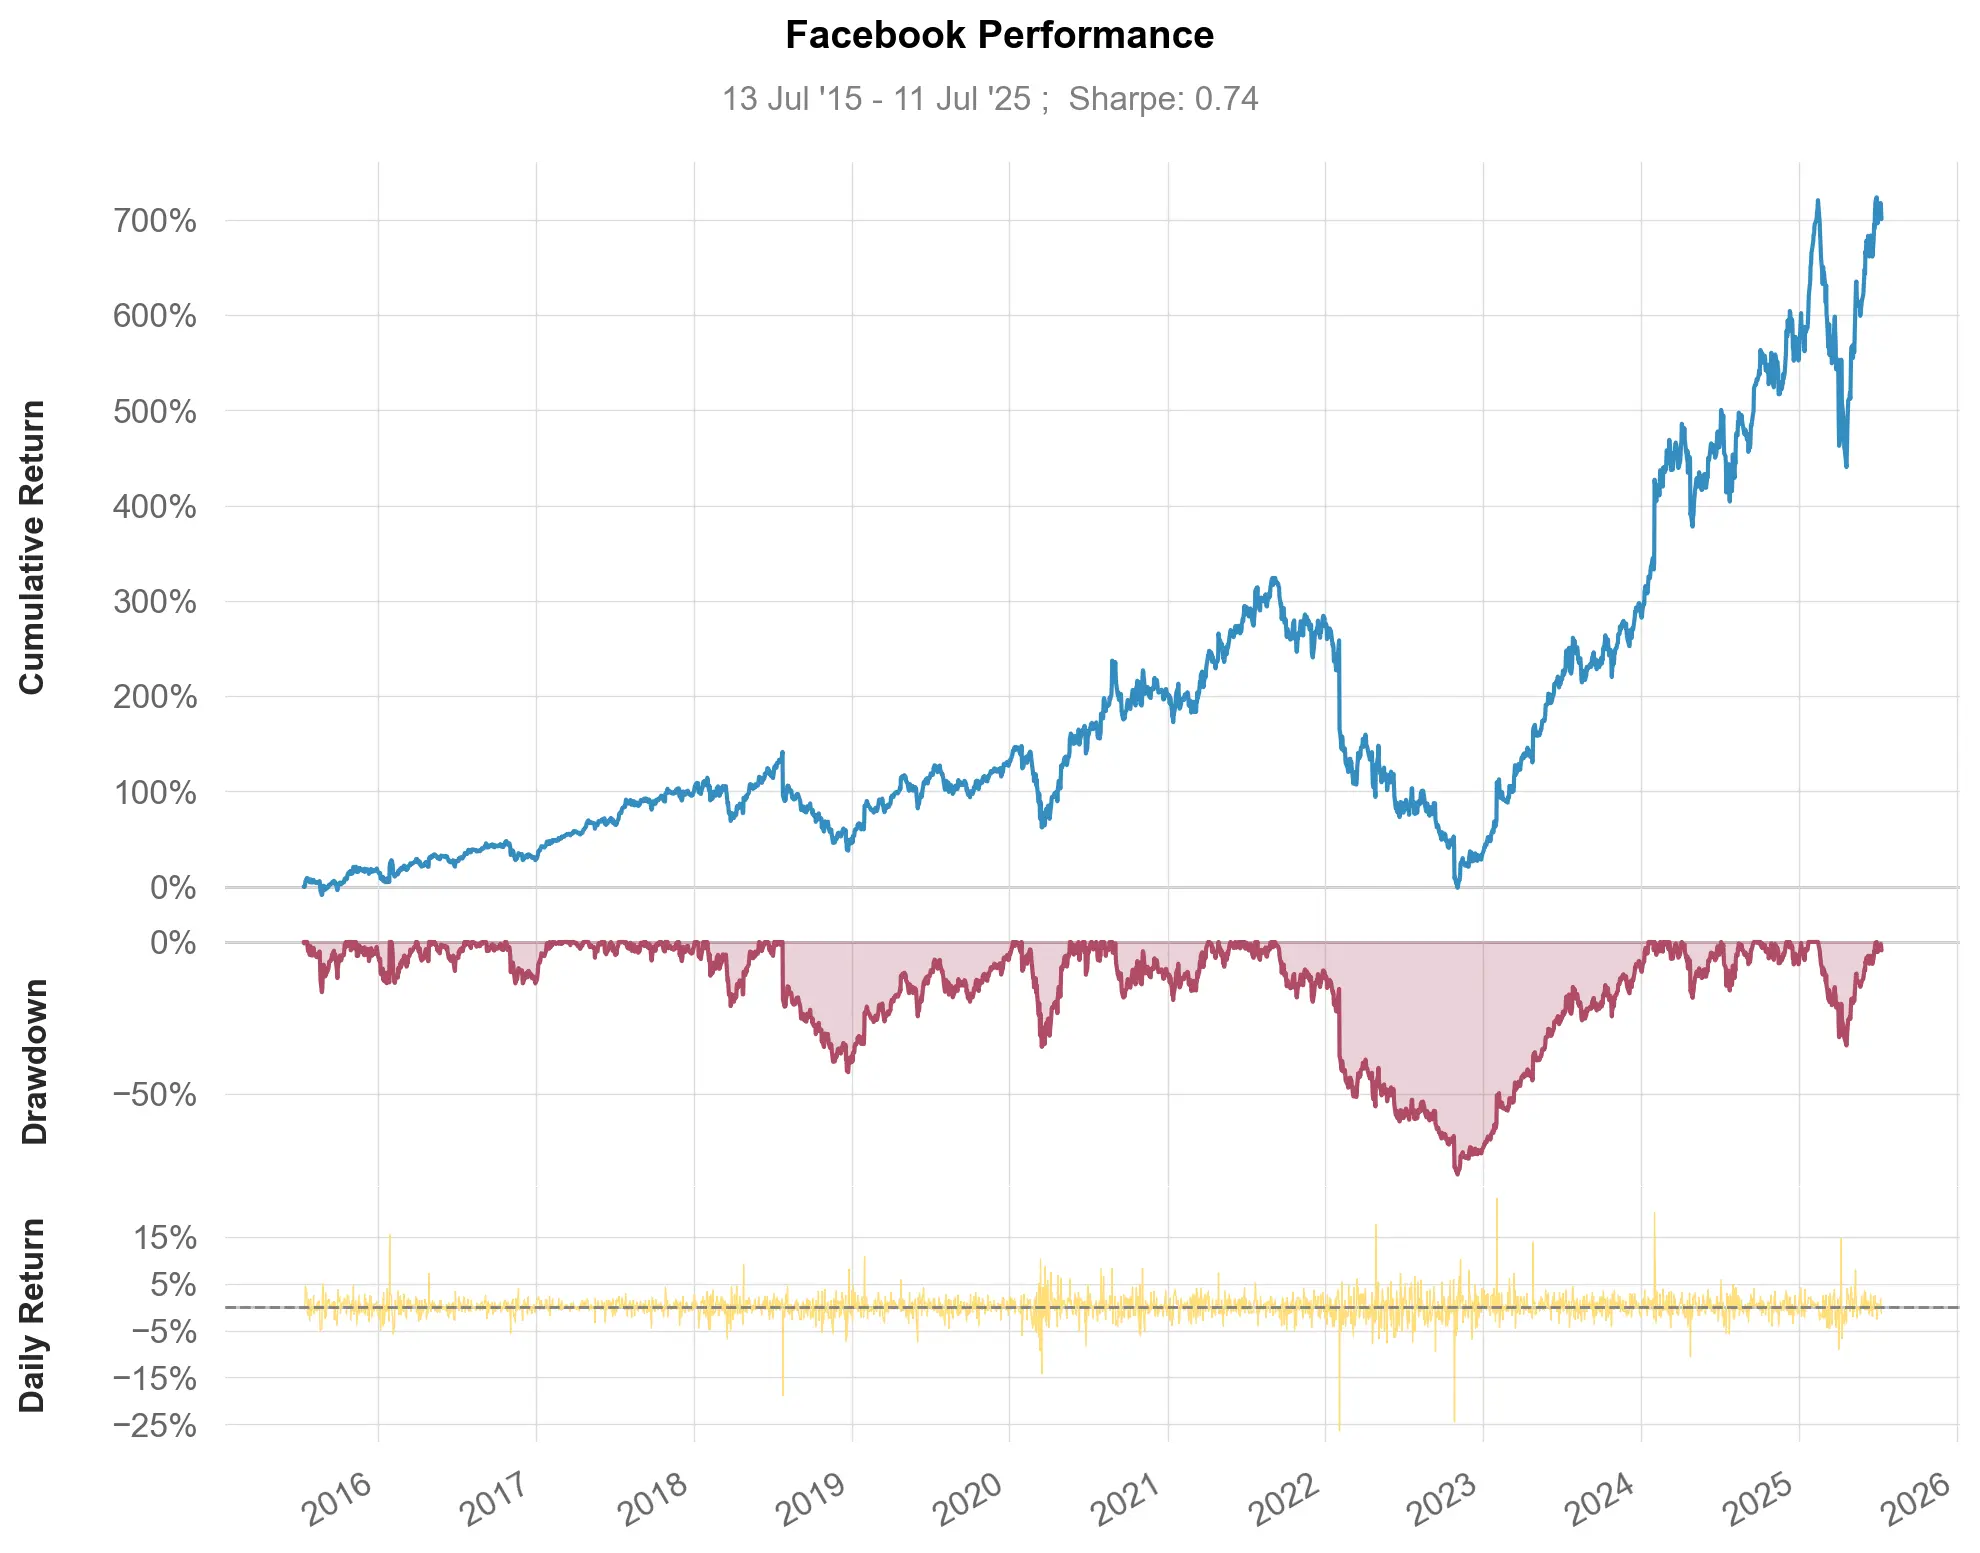
Visualize stock performance
qs.plots.snapshot(stock, title='Facebook Performance', show=True)

# can also be called via:
# stock.plot_snapshot(title='Facebook Performance', show=True)
Output:
Creating a report
You can create 7 different report tearsheets:
qs.reports.metrics(mode='basic|full", ...)- shows basic/full metricsqs.reports.plots(mode='basic|full", ...)- shows basic/full plotsqs.reports.basic(...)- shows basic metrics and plotsqs.reports.full(...)- shows full metrics and plotsqs.reports.html(...)- generates a complete report as html
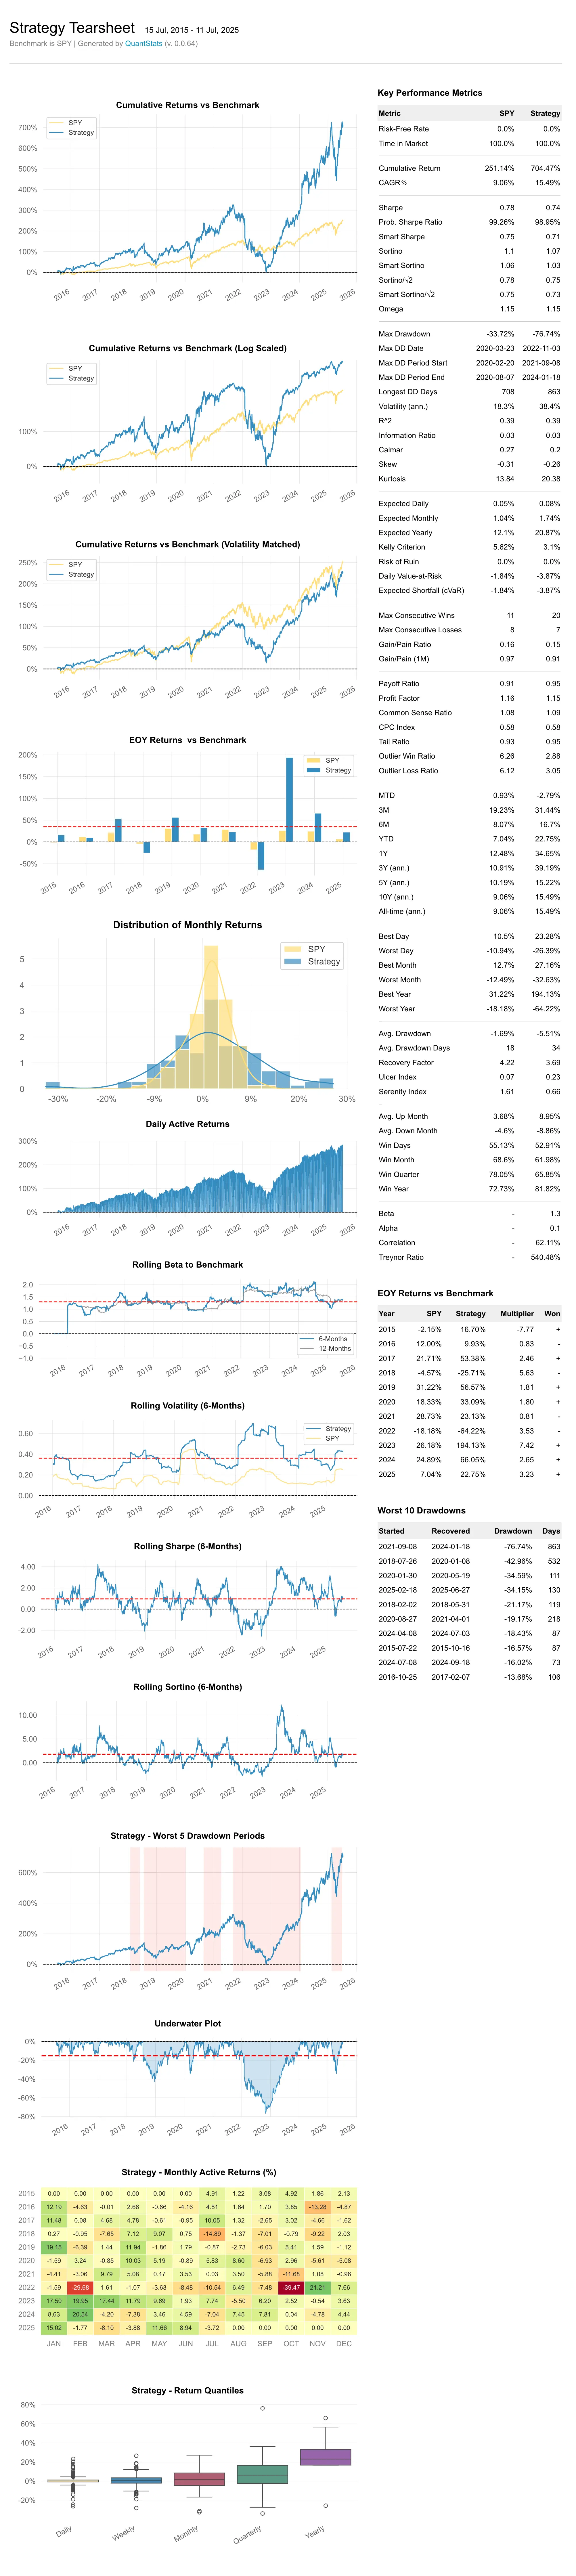
Let's create an html tearsheet:
# benchmark can be a pandas Series or ticker
qs.reports.html(stock, "SPY")
Output will generate something like this:
Available methods
To view a complete list of available methods, run:
[f for f in dir(qs.stats) if f[0] != '_']
['avg_loss',
 'avg_return',
 'avg_win',
 'best',
 'cagr',
 'calmar',
 'common_sense_ratio',
 'comp',
 'compare',
 'compsum',
 'conditional_value_at_risk',
 'consecutive_losses',
 'consecutive_wins',
 'cpc_index',
 'cvar',
 'drawdown_details',
 'expected_return',
 'expected_shortfall',
 'exposure',
 'gain_to_pain_ratio',
 'geometric_mean',
 'ghpr',
 'greeks',
 'implied_volatility',
 'information_ratio',
 'kelly_criterion',
 'kurtosis',
 'max_drawdown',
 'monthly_returns',
 'montecarlo',
 'montecarlo_cagr',
 'montecarlo_drawdown',
 'montecarlo_sharpe',
 'outlier_loss_ratio',
 'outlier_win_ratio',
 'outliers',
 'payoff_ratio',
 'profit_factor',
 'profit_ratio',
 'r2',
 'r_squared',
 'rar',
 'recovery_factor',
 'remove_outliers',
 'risk_of_ruin',
 'risk_return_ratio',
 'rolling_greeks',
 'ror',
 'sharpe',
 'skew',
 'sortino',
 'adjusted_sortino',
 'tail_ratio',
 'to_drawdown_series',
 'ulcer_index',
 'ulcer_performance_index',
 'upi',
 'value_at_risk',
 'var',
 'volatility',
 'win_loss_ratio',
 'win_rate',
 'worst']
[f for f in dir(qs.plots) if f[0] != '_']
['daily_returns',
 'distribution',
 'drawdown',
 'drawdowns_periods',
 'earnings',
 'histogram',
 'log_returns',
 'monthly_heatmap',
 'montecarlo',
 'montecarlo_distribution',
 'returns',
 'rolling_beta',
 'rolling_sharpe',
 'rolling_sortino',
 'rolling_volatility',
 'snapshot',
 'yearly_returns']
*** Full documentation coming soon ***
Important: Period-Based vs Trade-Based Metrics
QuantStats analyzes return series (daily, weekly, monthly returns), not discrete trade data. This means:
- Win Rate = percentage of periods with positive returns
- Consecutive Wins/Losses = consecutive positive/negative return periods
- Payoff Ratio = average winning period return / average losing period return
- Profit Factor = sum of positive returns / sum of negative returns
These metrics are valid and useful for:
- Systematic/algorithmic strategies with regular rebalancing
- Analyzing return-series behavior over time
- Comparing strategies on a period-by-period basis
For discretionary traders with multi-day trades, these period-based metrics may differ from trade-level statistics. A single 5-day trade might span 3 positive days and 2 negative days - QuantStats would count these as 3 "wins" and 2 "losses" at the daily level.
This is consistent with how all return-based analytics work (Sharpe ratio, Sortino ratio, drawdown analysis, etc.) - they operate on return periods, not discrete trade entries/exits.
In the meantime, you can get insights as to optional parameters for each method, by using Python's help method:
help(qs.stats.conditional_value_at_risk)
Help on function conditional_value_at_risk in module quantstats.stats:

conditional_value_at_risk(returns, sigma=1, confidence=0.95, prepare_returns=True, method='parametric')
    Calculate the Conditional Value at Risk (CVaR), also known as Expected Shortfall.

    CVaR measures the expected loss given that a loss exceeds the VaR threshold.
    It quantifies the amount of tail risk an investment faces, providing a more
    comprehensive risk measure than VaR alone.
Installation
Install using pip:
$ pip install quantstats --upgrade --no-cache-dir
Install using conda:
$ conda install -c ranaroussi quantstats
Requirements
- Python >= 3.10
- pandas >= 1.5.0
- numpy >= 1.24.0
- scipy >= 1.11.0
- matplotlib >= 3.7.0
- seaborn >= 0.13.0
- tabulate >= 0.9.0
- yfinance >= 0.2.40
- plotly >= 5.0.0 (optional, for using
plots.to_plotly())
Questions?
This is a new library... If you find a bug, please open an issue.
If you'd like to contribute, a great place to look is the issues marked with help-wanted.
Known Issues
For some reason, I couldn't find a way to tell seaborn not to return the
monthly returns heatmap when instructed to save - so even if you save the plot (by passing savefig={...}) it will still show the plot.
Legal Stuff
QuantStats is distributed under the Apache Software License. See the LICENSE.txt file in the release for details.
P.S.
Please drop me a note with any feedback you have.
Ran Aroussi
Explorer des projets similaires
Asabeneh/30-Days-Of-Python
Le défi de programmation 30 Days of Python est un guide pas à pas pour apprendre le langage de programmation Python en 30 jours. Ce défi peut prendre plus de 100 jours. Avancez à votre rythme. Ces vidéos peuvent aussi vous aider : https://www.youtube.com/channel/UC7PNRuno1rzYPb1xLa4yktw
78,560 étoilesgrafana/grafana
Plateforme ouverte et composable d’observabilité et de visualisation de données. Visualise les métriques, les journaux et les traces issus de plusieurs sources, comme Prometheus, Loki, Elasticsearch, InfluxDB, Postgres et bien d’autres.
77,830 étoilesredis/redis
Pour les développeurs qui créent des applications en temps réel pilotées par les données, Redis est le cache, le serveur de structures de données et le moteur de requêtes documentaires et vectorielles préféré, le plus rapide et le plus riche en fonctionnalités.
77,395 étoilesapache/superset
Apache Superset est une plateforme de visualisation et d'exploration de données.
75,473 étoiles