
hemansnation/Data-Analyst-Roadmap
hemansnation/Data-Analyst-Roadmap has 194 GitHub stars and 18 forks. Star changes are not measured yet. Last checked 2026-11-14 13:15 UTC. Last push 2023-07-27.
Progression mesurée des étoiles
- in 24h
- Historique en cours
- in 7 days
- Historique en cours
- in 15 days
- Historique en cours
- in 1 month
- Historique en cours
Variations nettes sur des périodes qui se chevauchent, pas des totaux quotidiens. Les mesures absentes restent vides. Les étoiles indiquent l’intérêt, pas la qualité.
À propos
Data-Analyst-Roadmap for Professionals. This roadmap contains 8 Chapters that can be completed in 8 weeks, whether you are a fresher in the field or an experienced professional who wants to transition into Data Analysis.
DonnéesREADME.md
OriginalData-Analyst-Roadmap
Data-Analyst-Roadmap for Students and Professionals
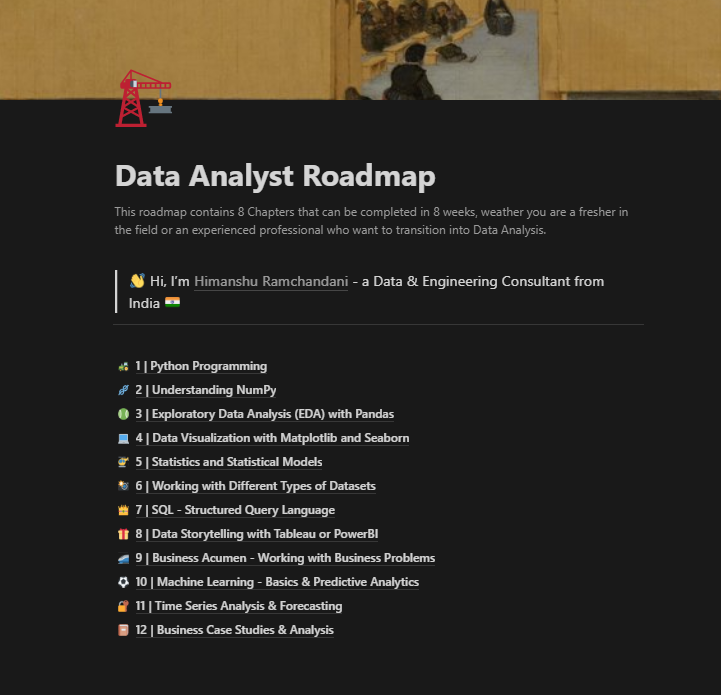
Notion Template Detailed Roadmap Here
This is how we are going to prepare for the Data Analyst profile:
1 - Python Programming
2 - Understanding NumPy
3 - Exploratory Data Analysis (EDA) with Pandas
4 - Data Visualization with Matplotlib and Seaborn
5 - Statistics and Statistical models
6 - Working with Different Types of Datasets
7 - Structured Query Language (SQL)
8 - Data Storytelling with Tableau or PowerBI
9 - Business Acumen and working with Business Problems
10 - Machine Learning Basics & Predictive Analytics
11 - Time Series Analysis & Forecasting
12 - Business Case Studies & Analysis
We are going to need 8 Weeks to complete each topic and be ready for the job interview.
Week 1
Chapter 1 - Python Programming & Logic Building
Week 2
Chapter 2 - Data Analysis with Python
3 | Exploratory Data Analysis (EDA) with Pandas
4 | Data Visualization with Matplotlib and Seaborn
Week 3
Chapter 3 - Statistical Analysis and Data Analytics Projects
5 | Statistics and Statistical Models
6 | Working with Different Types of Datasets
Week 4
Chapter 4 - Database Management with SQL
7 | SQL - Structured Query Language
Week 5
Chapter 5 - Data Storytelling
8 | Data Storytelling with Tableau or PowerBI
Week 6
Chapter 6 - Business Problems
9 | Business Acumen - Working with Business Problems
Week 7
Chapter 7 - Predictive Analytics
10 | Machine Learning - Basics & Predictive Analytics
Week 8
Chapter 8 - Forecasting & Case Studies
11 | Time Series Analysis & Forecasting
12 | Business Case Studies & Analysis
What to do Next?
Resources
Are you interested in Joining my Live Batch?
Join the WhatsApp Group Here: https://chat.whatsapp.com/J0CjC1tNsPpAk0S7OZDtbp
Python🐍 Machine Learning🤖 Data Science🥼 Data Engineering🧑💻 Computer Vision🖥️ NLP🤍 Business Problems🚀
Follow Himanshu Ramchandani and get amazing content in the data field.
Explorer des projets similaires
Asabeneh/30-Days-Of-Python
Le défi de programmation 30 Days of Python est un guide pas à pas pour apprendre le langage de programmation Python en 30 jours. Ce défi peut prendre plus de 100 jours. Avancez à votre rythme. Ces vidéos peuvent aussi vous aider : https://www.youtube.com/channel/UC7PNRuno1rzYPb1xLa4yktw
78,730 étoilesgrafana/grafana
Plateforme ouverte et composable d’observabilité et de visualisation de données. Visualise les métriques, les journaux et les traces issus de plusieurs sources, comme Prometheus, Loki, Elasticsearch, InfluxDB, Postgres et bien d’autres.
77,898 étoilesredis/redis
Pour les développeurs qui créent des applications en temps réel pilotées par les données, Redis est le cache, le serveur de structures de données et le moteur de requêtes documentaires et vectorielles préféré, le plus rapide et le plus riche en fonctionnalités.
77,491 étoilesapache/superset
Apache Superset est une plateforme de visualisation et d'exploration de données.
75,523 étoiles