
buggedcom/HASS-Data-Points
buggedcom/HASS-Data-Points has 33 GitHub stars and 1 forks. Star changes are not measured yet. Last checked 2026-11-12 08:07 UTC. Last push 2026-11-11.
Comment ces chiffres sont mesurés
Data Points is a Home Assistant integration for recording timestamped events and then using them as analytical context across charts, lists, and a dedicated history page.
What you can do
- raw measurements
- long-term statistics
- user-created or automation-created annotations
- target-aware chart overlays
Progression mesurée des étoiles
- in 24h
- Historique en cours
- in 7 days
- Historique en cours
- in 15 days
- Historique en cours
- in 1 month
- Historique en cours
Variations nettes sur des périodes qui se chevauchent, pas des totaux quotidiens. Les mesures absentes restent vides. Les étoiles indiquent l’intérêt, pas la qualité.
README.md
Original
Data Points
Record meaningful events in Home Assistant and analyze them directly alongside your entity history, long-term statistics, and chart annotations.


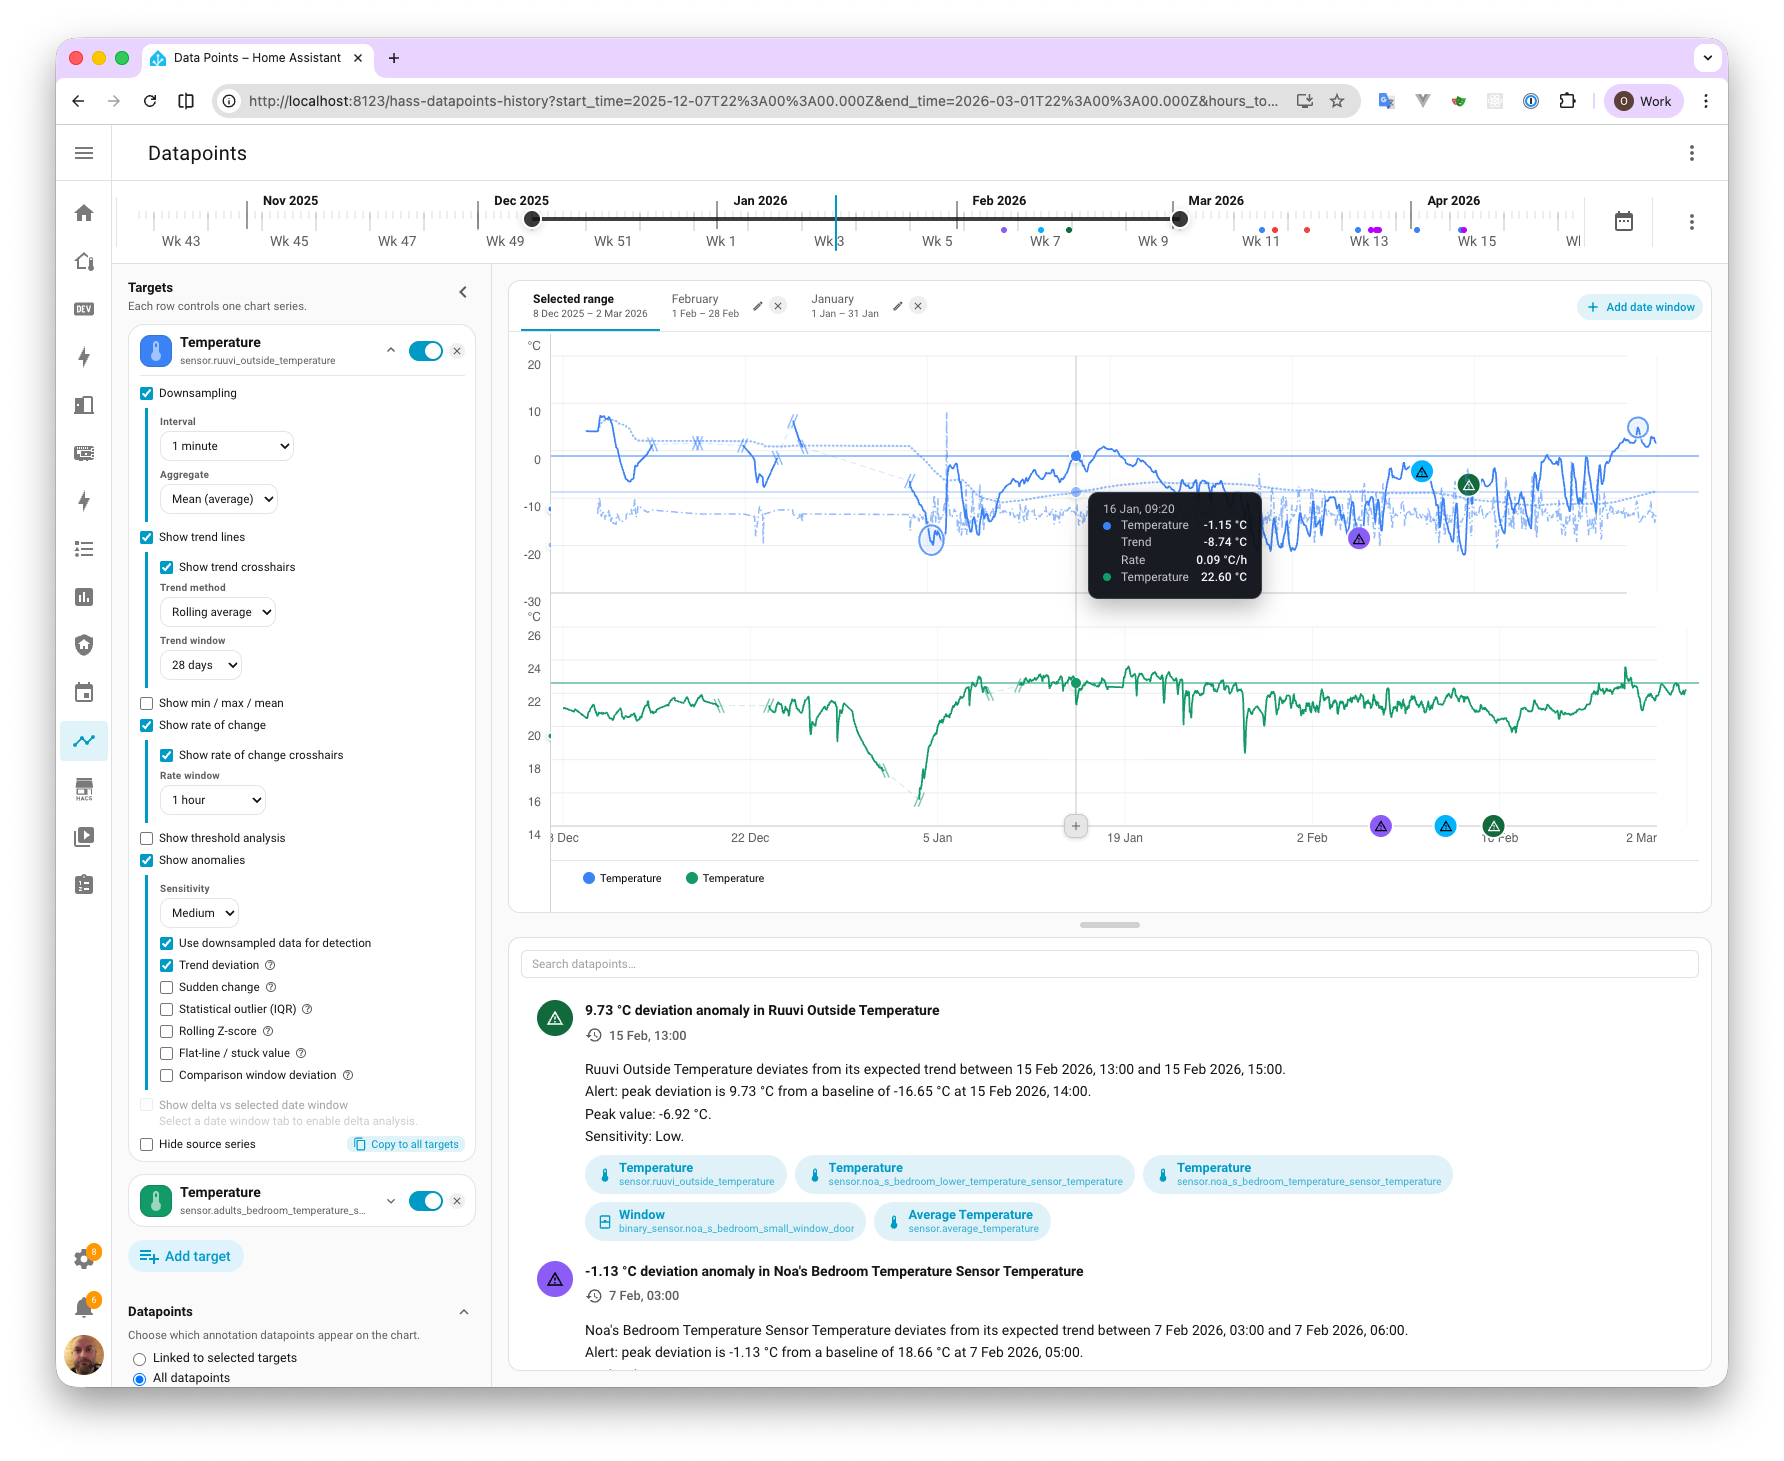
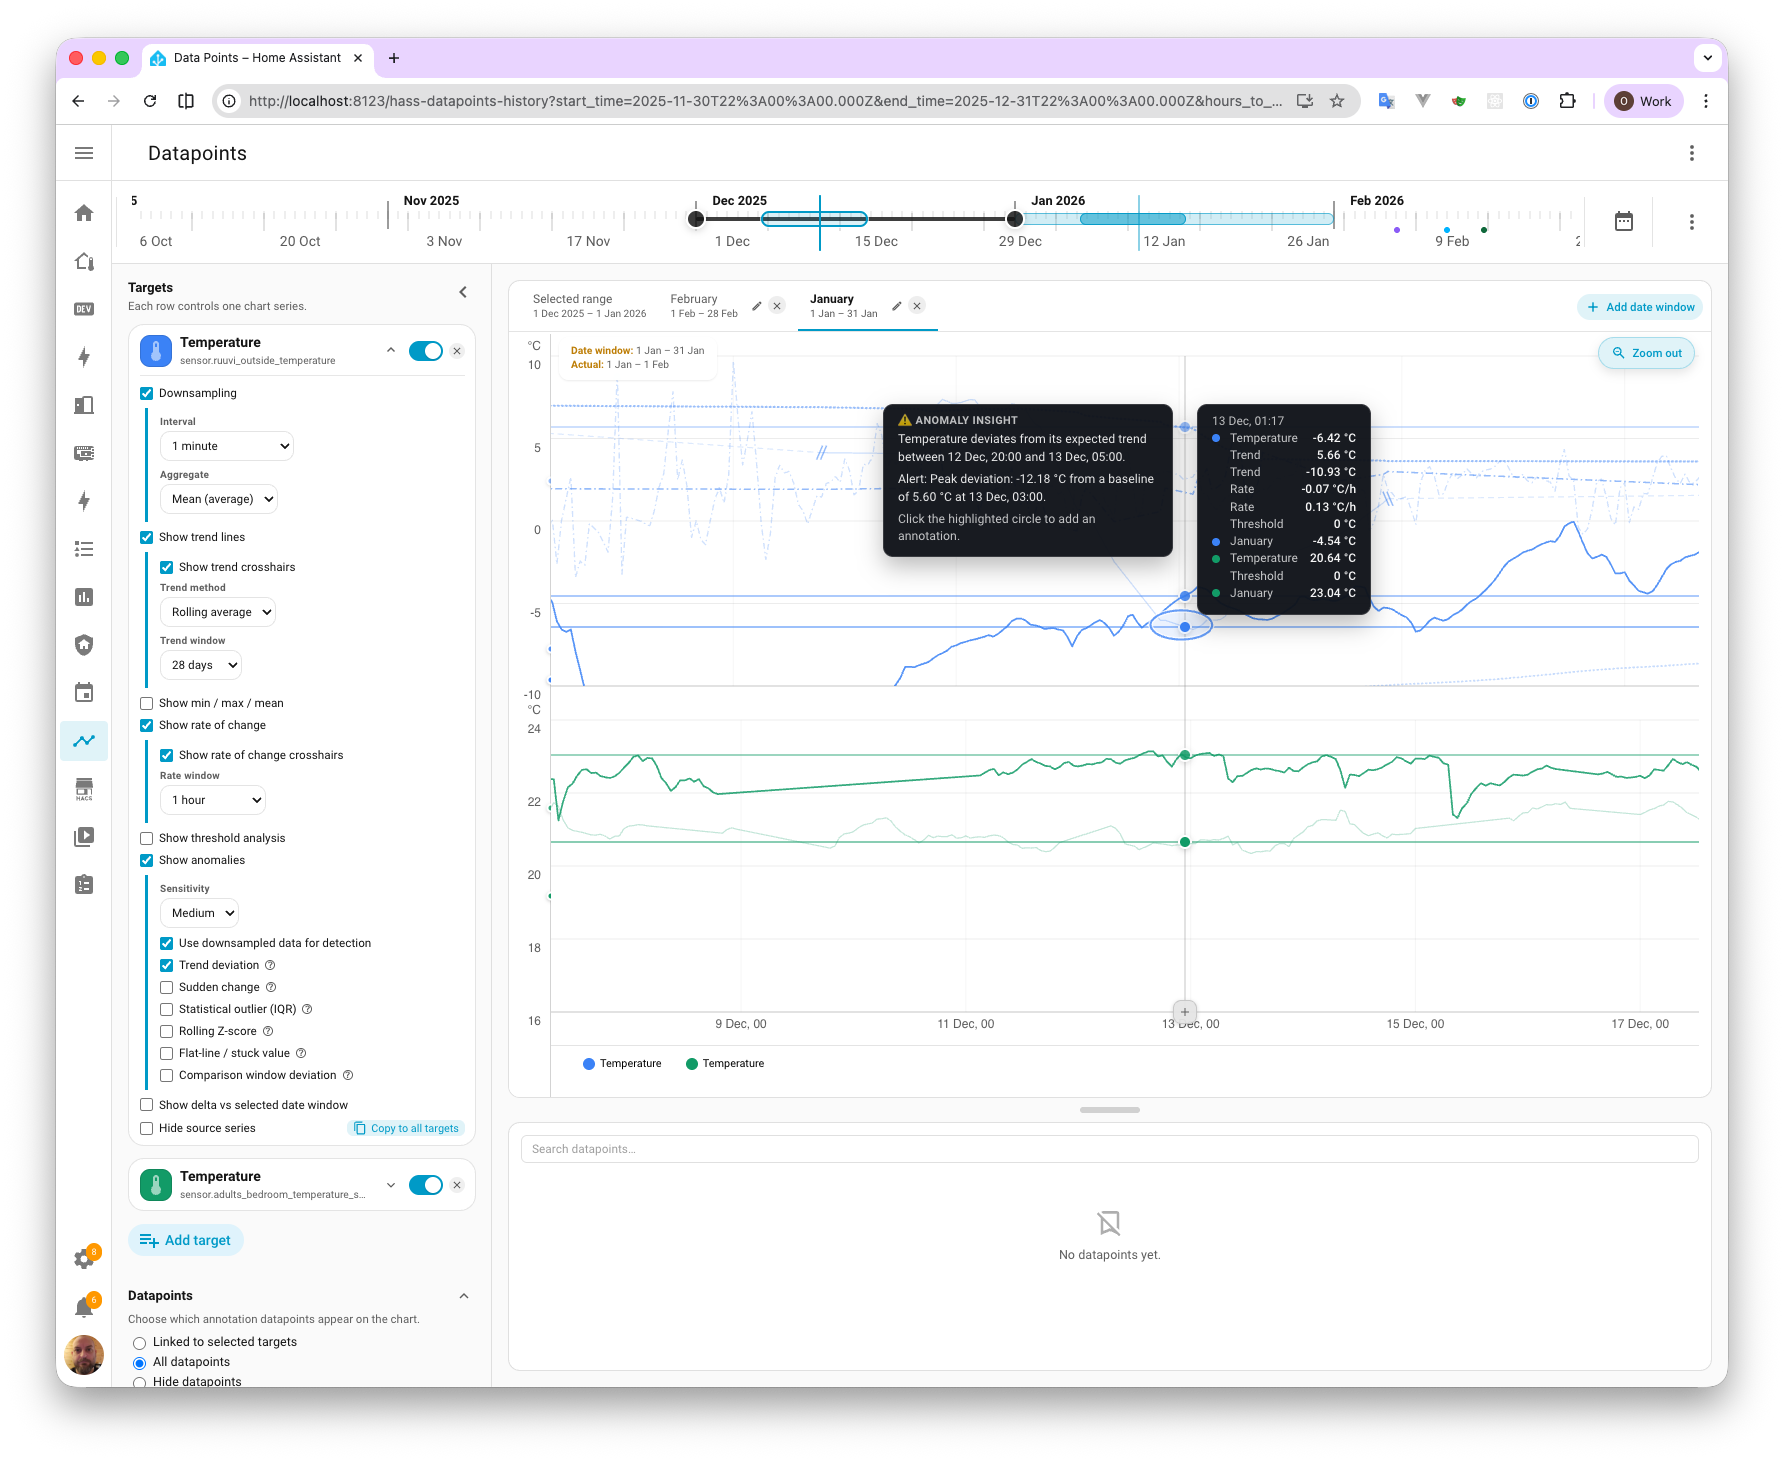
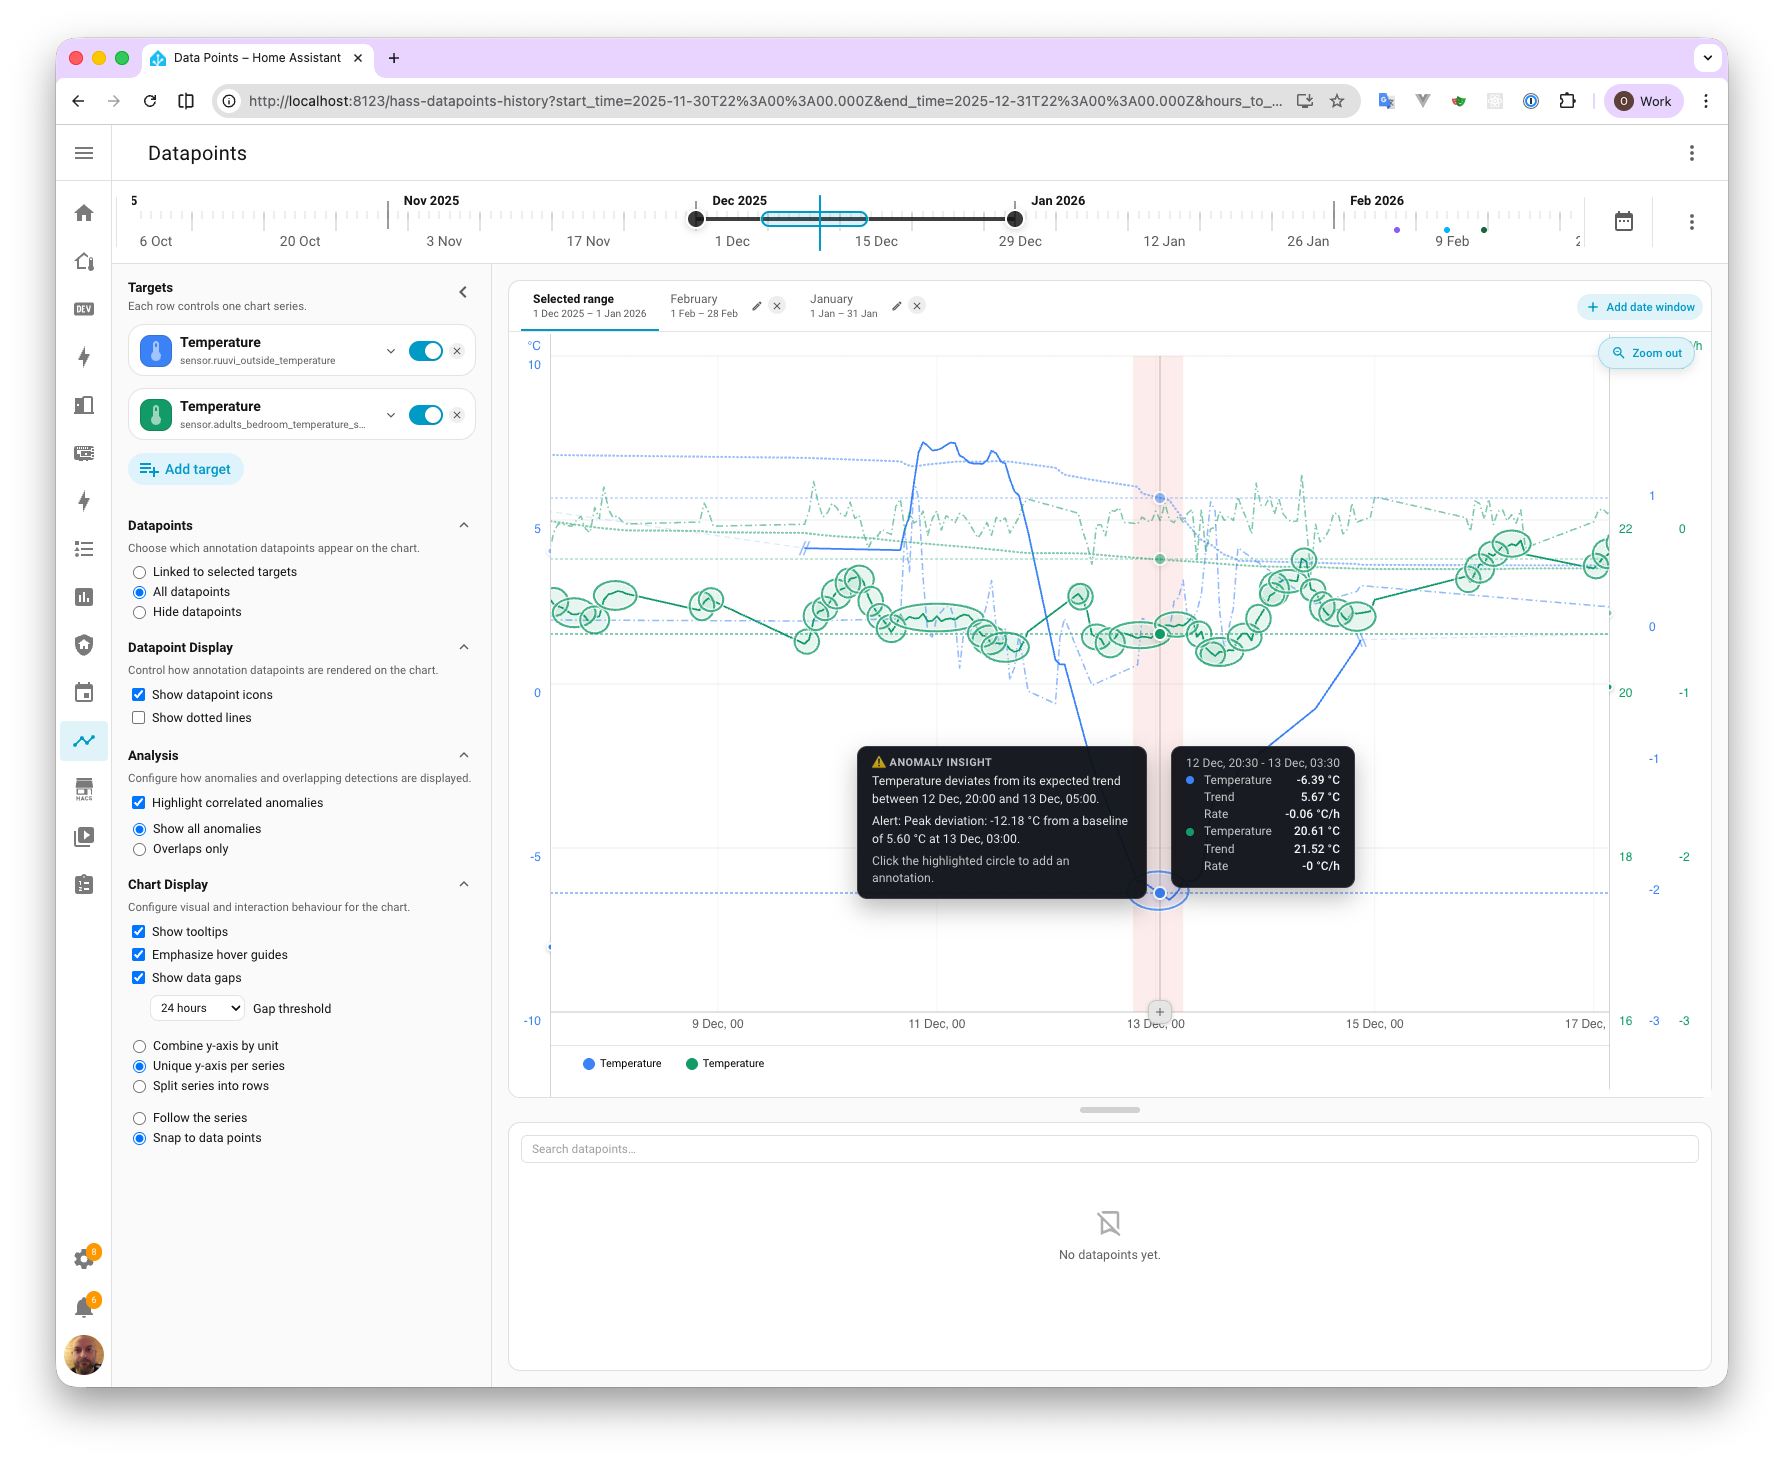
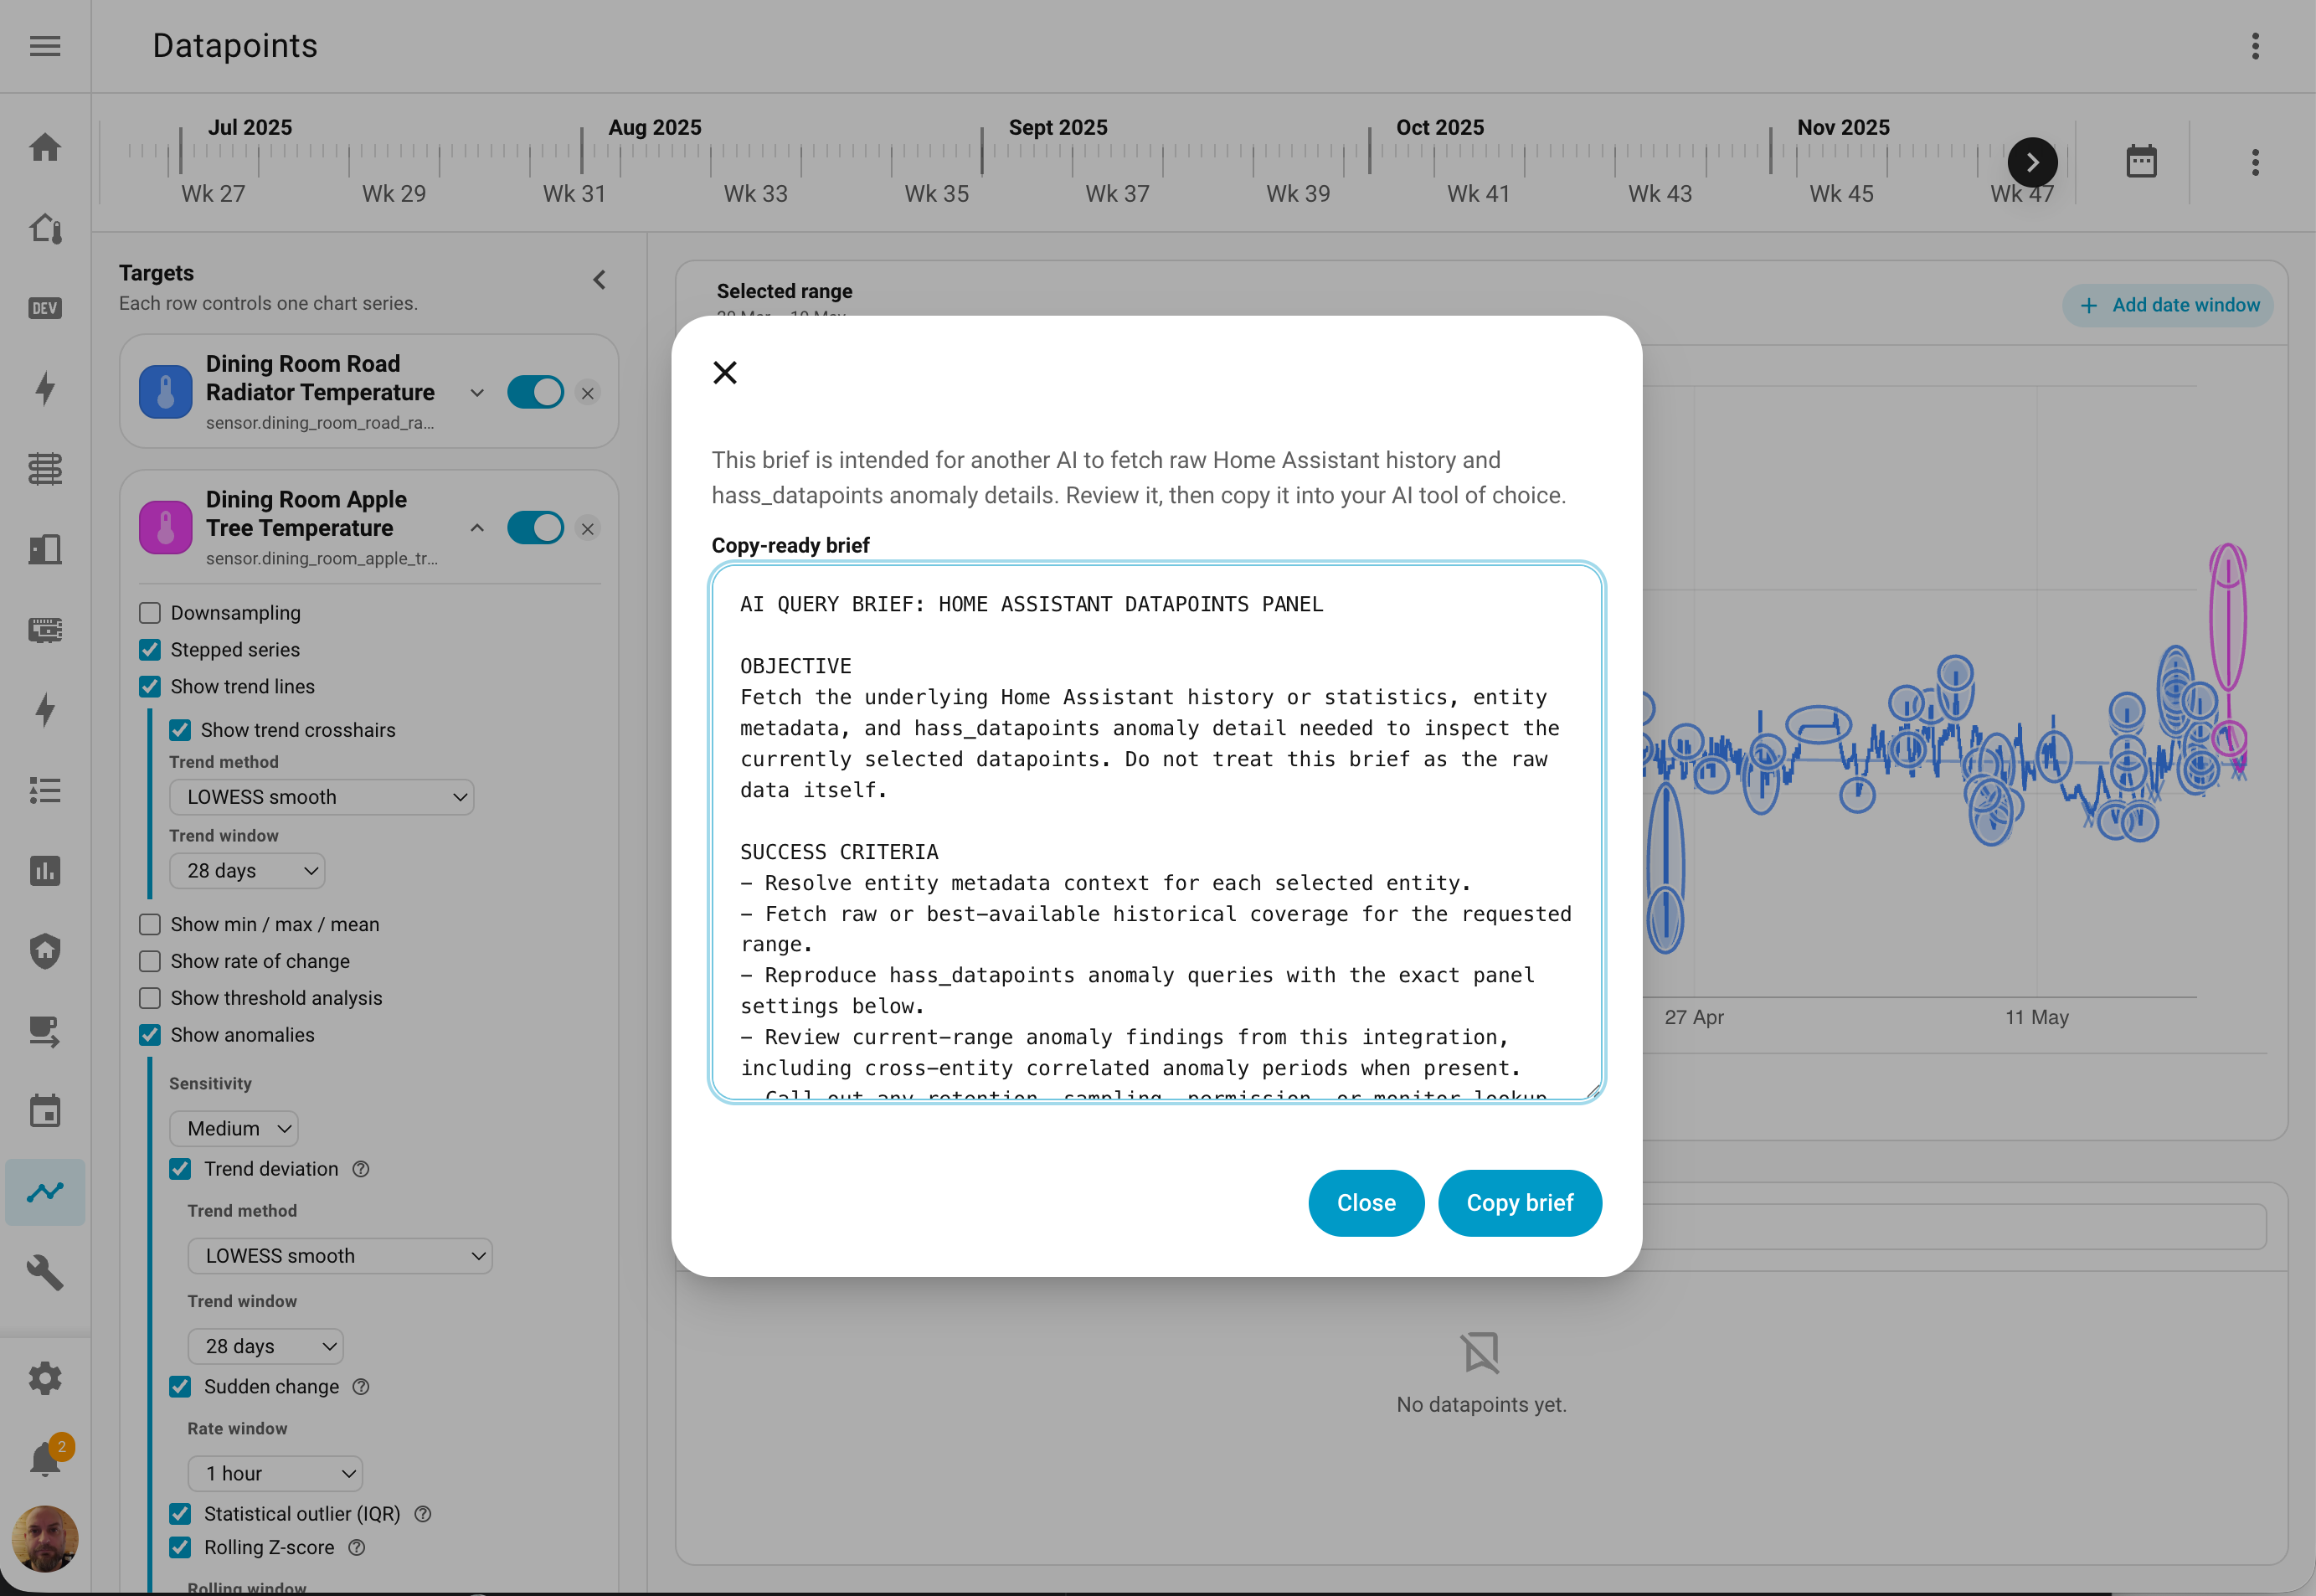
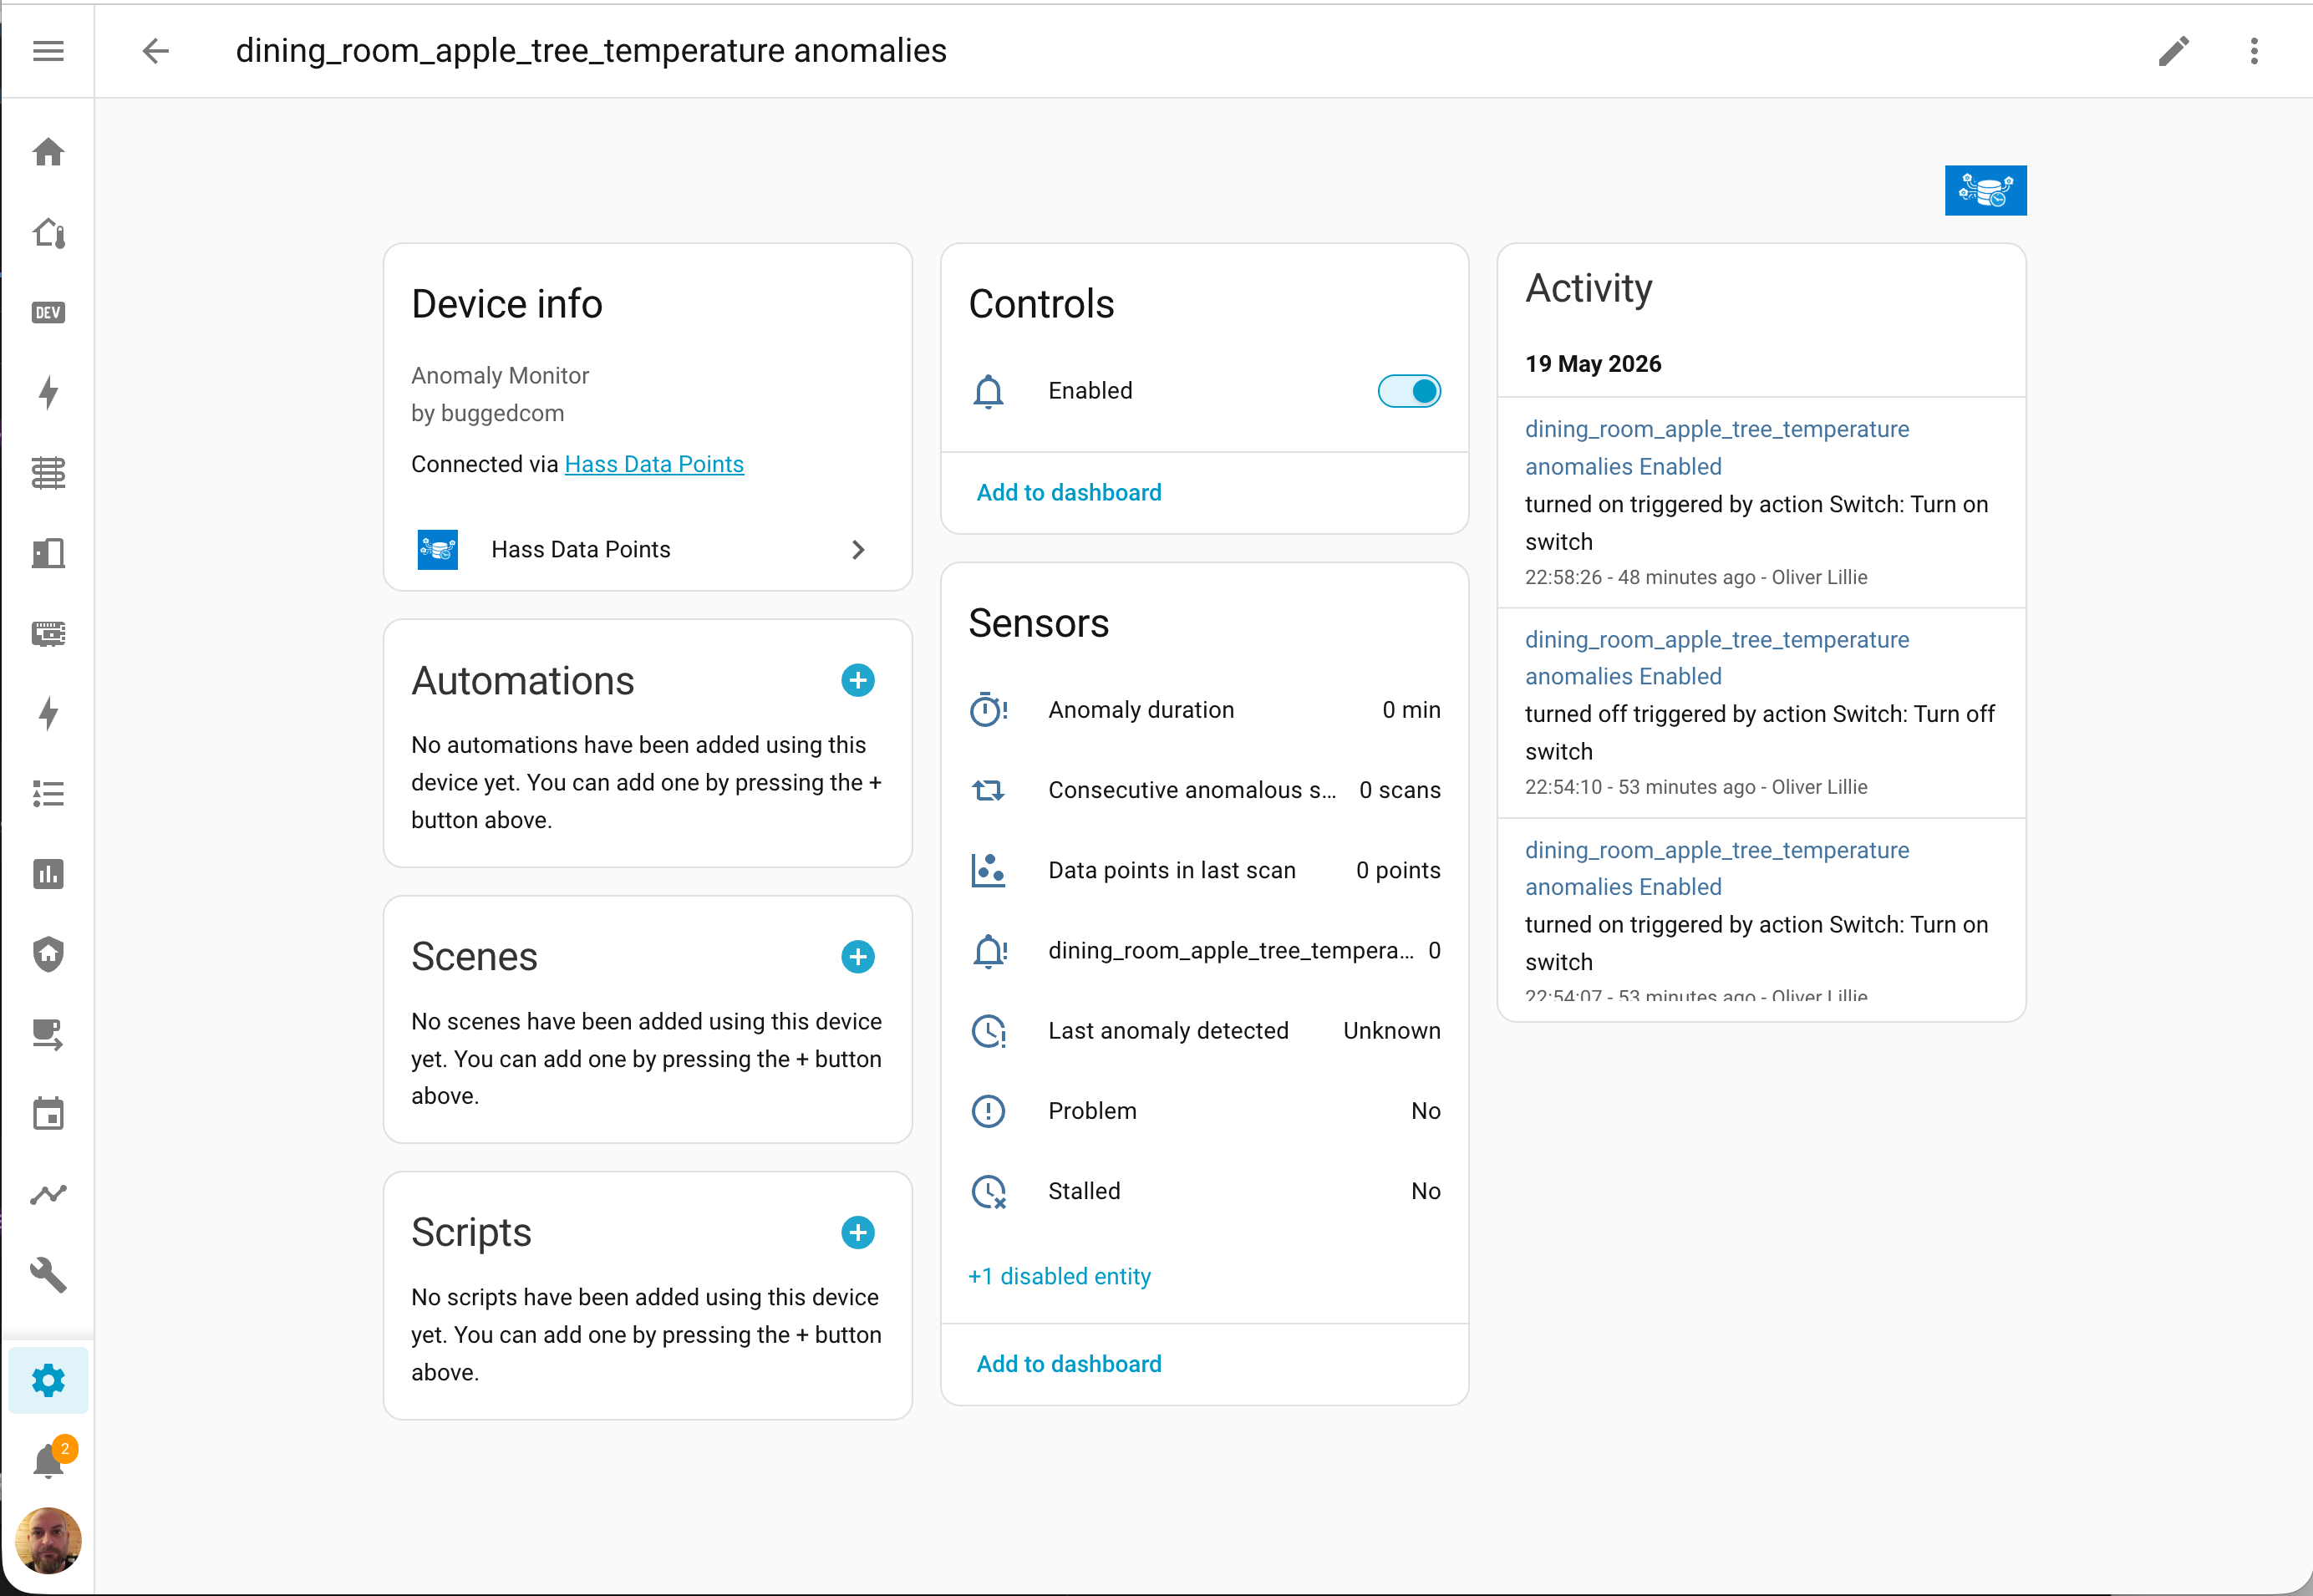
See the v0.6.0 release for screenshots of the anomaly monitor wizard and AI query brief.
Overview
Data Points is a Home Assistant integration for recording timestamped events and using them as analytical context across charts, lists, and a dedicated history page.
It helps you answer questions like:
- What changed?
- When did it change?
- What system or entity was affected?
- Was the change expected?
- Does the related sensor behavior now look suspicious?
The integration bundles its Lovelace cards and panel frontend automatically. No separate Lovelace resource configuration is required.
Why Data Points is useful
A plain chart tells you what changed. Data Points helps you understand why it changed by combining:
- raw measurements
- long-term statistics
- user-created or automation-created annotations
- target-aware chart overlays
- anomaly detection
- historical date-window comparison
That makes it much easier to investigate heating behavior, energy usage, sensor faults, maintenance effects, occupancy-driven changes, and operational regressions over time.
What Data Points provides
- Record custom datapoints from automations, scripts, dashboards, and Developer Tools
- Attach datapoints to entities, devices, areas, or labels
- Render datapoints directly on history, statistics, and sensor charts
- Browse, search, edit, delete, and hide datapoints in a dedicated list card
- Investigate entity history with target rows, per-target analysis options, and date-window comparisons
- Create chart annotations directly from the chart while exploring data
- Backend-powered anomaly detection to highlight suspicious behavior, including rate-of-change (
point_to_point) detection across eight configurable window sizes - Anomaly monitors appear as Home Assistant integration devices, enabling automations to trigger when anomalies are detected
- Compare a current period against saved historical windows to find drift and regressions
- AI query brief: a structured panel context for AI assistants (MCP-connected or otherwise) containing entity metadata, query inputs, and current anomaly findings — localized into DE, ES, FR, PT, FI, and ZH-Hans
- Native MCP tools expose chart analysis, annotations, and monitor findings through Home Assistant 2026.11 or later.
Documentation
| Topic | Description |
|---|---|
| Cards & UI | All six cards, the history panel, and YAML configuration examples |
| Recording Datapoints | The record action, fields, automation patterns, and examples |
| History & Analysis | Chart features, trend methods, anomaly detection, and date windows |
| Development | Setup, build, tests, i18n, remote HA dev, WebSocket API, and CI |
Translations
Data Points ships with both Home Assistant integration translations and frontend card/panel translations.
Included locales
- English
- Finnish
- French 🤖
- German 🤖
- Spanish 🤖
- Portuguese 🤖
- Simplified Chinese 🤖
English is the source language. Finnish translations were written by a non-native speaker. All other bundled locales are machine-translated — they are usable defaults rather than fully reviewed translations. Improvements are very welcome.
- Integration/service strings:
custom_components/hass_datapoints/translations/*.json - Frontend component strings:
custom_components/hass_datapoints/src/**/i18n/
Roadmap
Planned features
- Multiple saved views — persist more than one named chart-and-panel state for reusable investigation setups.
- Automatic historical period matching — find similar historical periods automatically so the panel can suggest or create date windows.
- Automatic anomaly-to-datapoint generation — generate datapoints when configured anomaly conditions are met. (Anomaly monitors are now HA entities, so automation triggers are already possible — this extends that to automatic datapoint creation.)
- Backfilling tools — create datapoints from recent history and long-term statistics after the fact.
- Anomalies summary card — dedicated card for highlighting current anomalies with deep-links into the history view.
- Drop-in replacements for HA sensor and statistics cards — equivalents that support datapoint overlays and richer contextual controls.
Themes
- Operational memory — preserve and reuse saved investigative contexts.
- Assisted comparison — reduce the manual work needed to find meaningful historical baselines.
- From analysis to action — let anomaly configuration graduate into automations and auto-generated datapoints.
- Dashboard-native investigation — bring anomaly surfacing into smaller cards for everyday dashboards.
Installation
HACS
- Open HACS.
- Go to Integrations.
- Add this repository as a custom repository with category Integration.
- Install Data Points.
- Restart Home Assistant.
Manual
Copy custom_components/hass_datapoints into:
config/custom_components/hass_datapoints
Then restart Home Assistant.
Setup
Add the integration from:
Settings → Devices & Services → Add Integration → Data Points
No YAML setup is required.
Quick start
Record a datapoint from Developer Tools → Actions:
action: hass_datapoints.record
data:
  message: "Heating schedule changed"
  entity_ids:
    - climate.living_room
    - sensor.living_room_temperature
  icon: mdi:radiator
  color: "#ff5722"
Then add the history card to a dashboard:
type: custom:hass-datapoints-history-card
title: Living room
entities:
  - sensor.living_room_temperature
hours_to_show: 72
See Recording Datapoints and Cards & UI for the full reference.
Explorer des projets similaires
Asabeneh/30-Days-Of-Python
Le défi de programmation 30 Days of Python est un guide pas à pas pour apprendre le langage de programmation Python en 30 jours. Ce défi peut prendre plus de 100 jours. Avancez à votre rythme. Ces vidéos peuvent aussi vous aider : https://www.youtube.com/channel/UC7PNRuno1rzYPb1xLa4yktw
78,618 étoilesgrafana/grafana
Plateforme ouverte et composable d’observabilité et de visualisation de données. Visualise les métriques, les journaux et les traces issus de plusieurs sources, comme Prometheus, Loki, Elasticsearch, InfluxDB, Postgres et bien d’autres.
77,859 étoilesredis/redis
Pour les développeurs qui créent des applications en temps réel pilotées par les données, Redis est le cache, le serveur de structures de données et le moteur de requêtes documentaires et vectorielles préféré, le plus rapide et le plus riche en fonctionnalités.
77,472 étoilesapache/superset
Apache Superset est une plateforme de visualisation et d'exploration de données.
75,495 étoiles