
benthecoder/linkedin-visualizer
benthecoder/linkedin-visualizer has 54 GitHub stars and 11 forks. GitHot measured 0 stars in 24 hours, 0 in 7 days, and 0 in 15 days. Last checked 2026-11-13 18:19 UTC. Last push 2022-10-06.
What you can do
- Total connections on LinkedIn
- Where most of your connections work at
- Who most of your connections are (what job title they hold)
- Who you last connected with
Progression mesurée des étoiles
- in 24h
- 0
- in 7 days
- 0
- in 15 days
- 0
- in 1 month
- Historique en cours
Variations nettes sur des périodes qui se chevauchent, pas des totaux quotidiens. Les mesures absentes restent vides. Les étoiles indiquent l’intérêt, pas la qualité.
À propos
The missing feature in LinkedIn
DonnéesREADME.md
OriginalLinkedin Connections Insights 🪄

Get helpful statistics on your LinkedIn connection now!
Learn more about the project (Link)
Check out a walkthrough of the app of my LinkedIn connections (Link)
Features
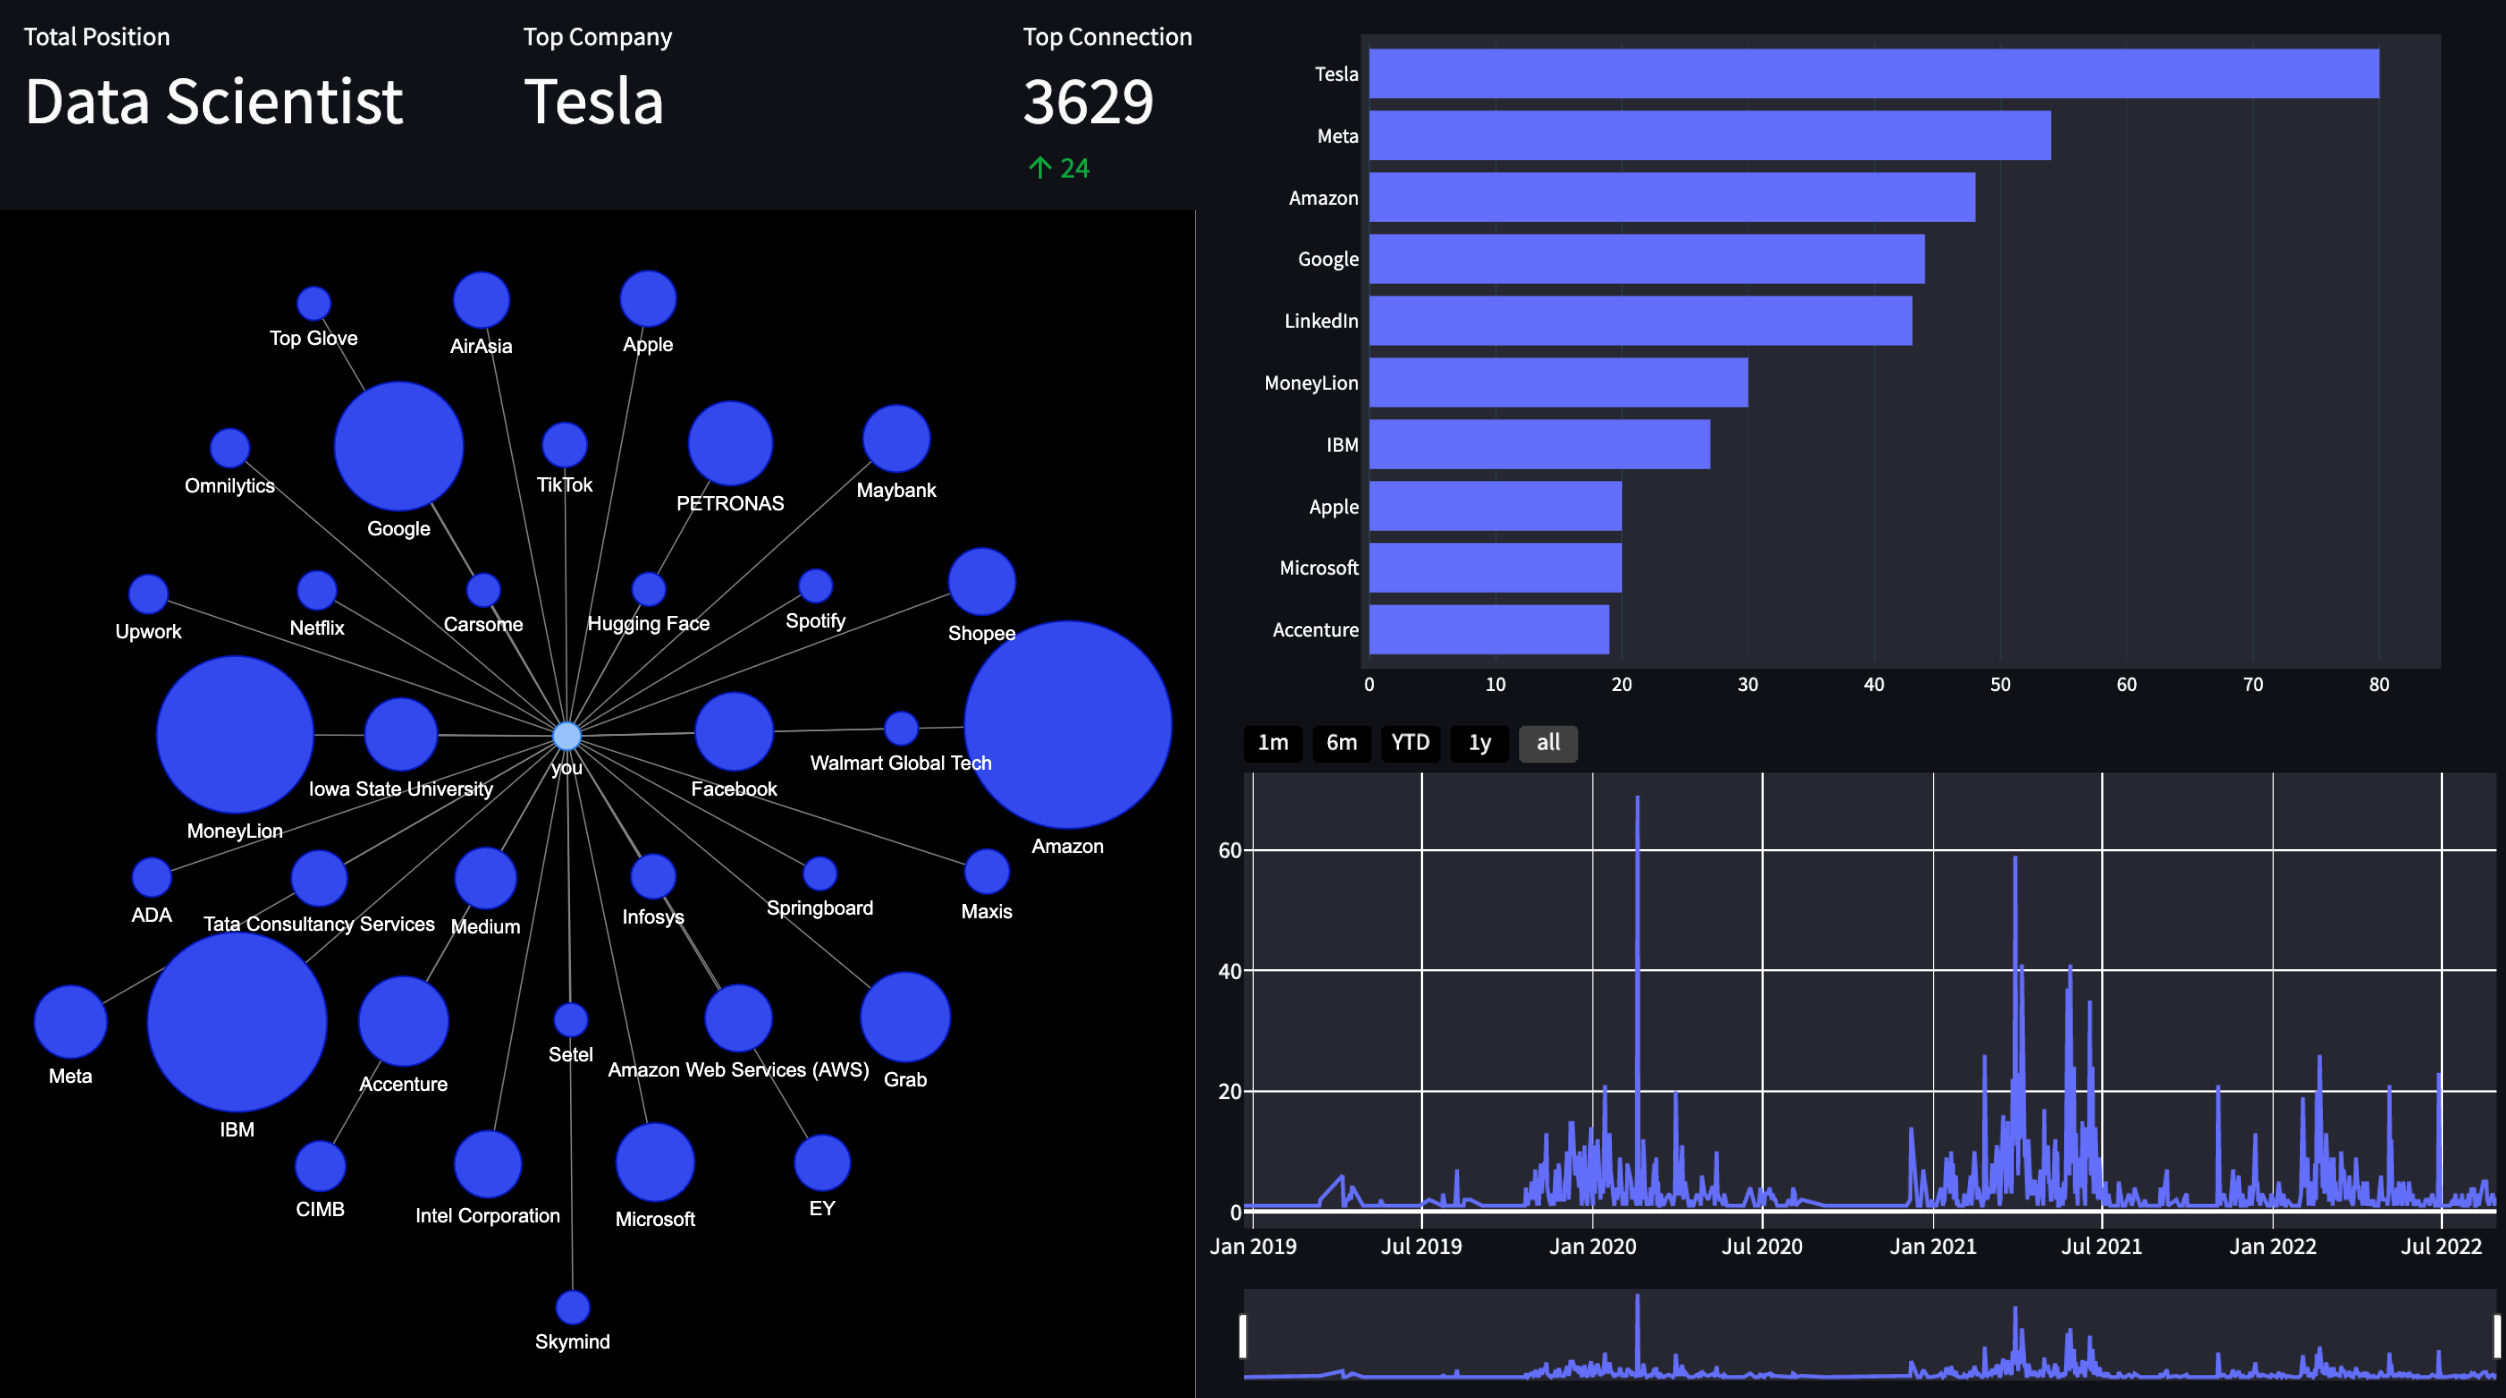
This app tells you the information below
- Total connections on LinkedIn
- Where most of your connections work at
- Who most of your connections are (what job title they hold)
- Who you last connected with
- Who you first connected with (send them a message!)
- Bar chart of top companies and positions
- Time series plot of your connections over time (find out when you had the most connections)
- A graph/network of your connections (see your connections in a graph)
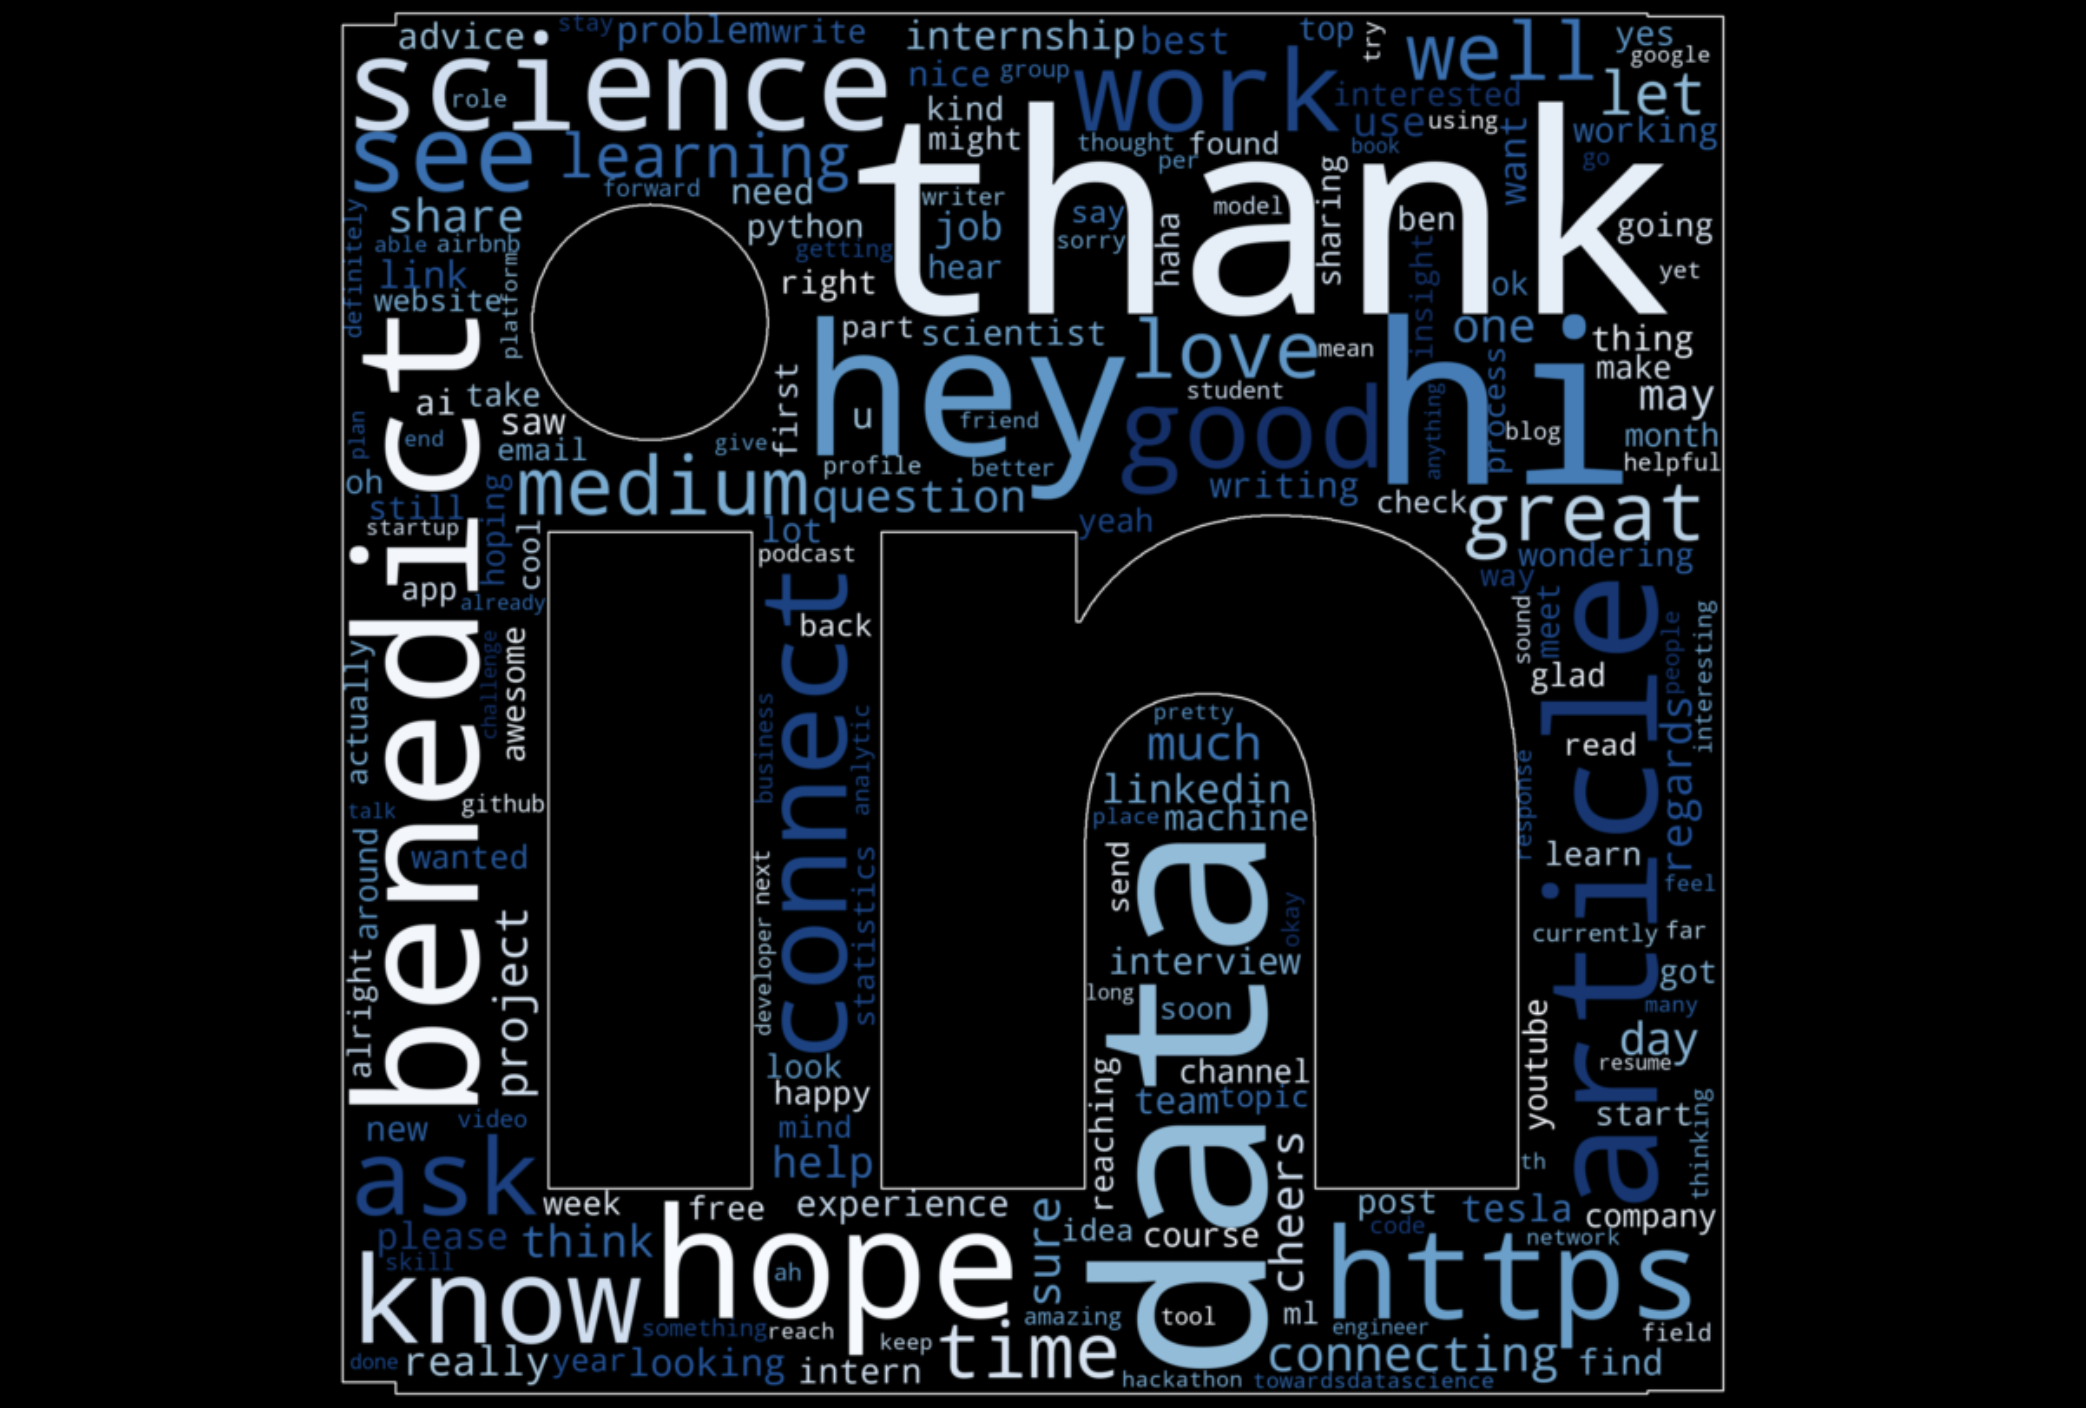
- A wordcloud of your chat messages with your connections (new!)
- Last but not least, a "who you can cold email" section that provides a list of emails of your connections (perks of LinkedIn connections!)
Word Cloud (New Feature!)
Run Locally
Clone the project
git clone https://github.com/benthecoder/linkedin-visualizer.git
Go to the project directory
cd linkedin-visualizer
Using Docker
Build an Image
docker build -t linkedin-visualizer:1.0 .
Run the Image
docker run -p 8501:8501 linkedin-visualizer:1.0
The app is now live on http://localhost:8501/
Using Conda
Create Conda environment
conda create --name env_name python=3.8
Activate the environment
conda activate env_name
Install requirements
pip install -r requirements.txt
Run streamlit
streamlit run app.py
Using Poetry
first make sure you have python 3.8
poetry install
poetry run streamlit run app.py
Contributing
Contributions are always welcome!
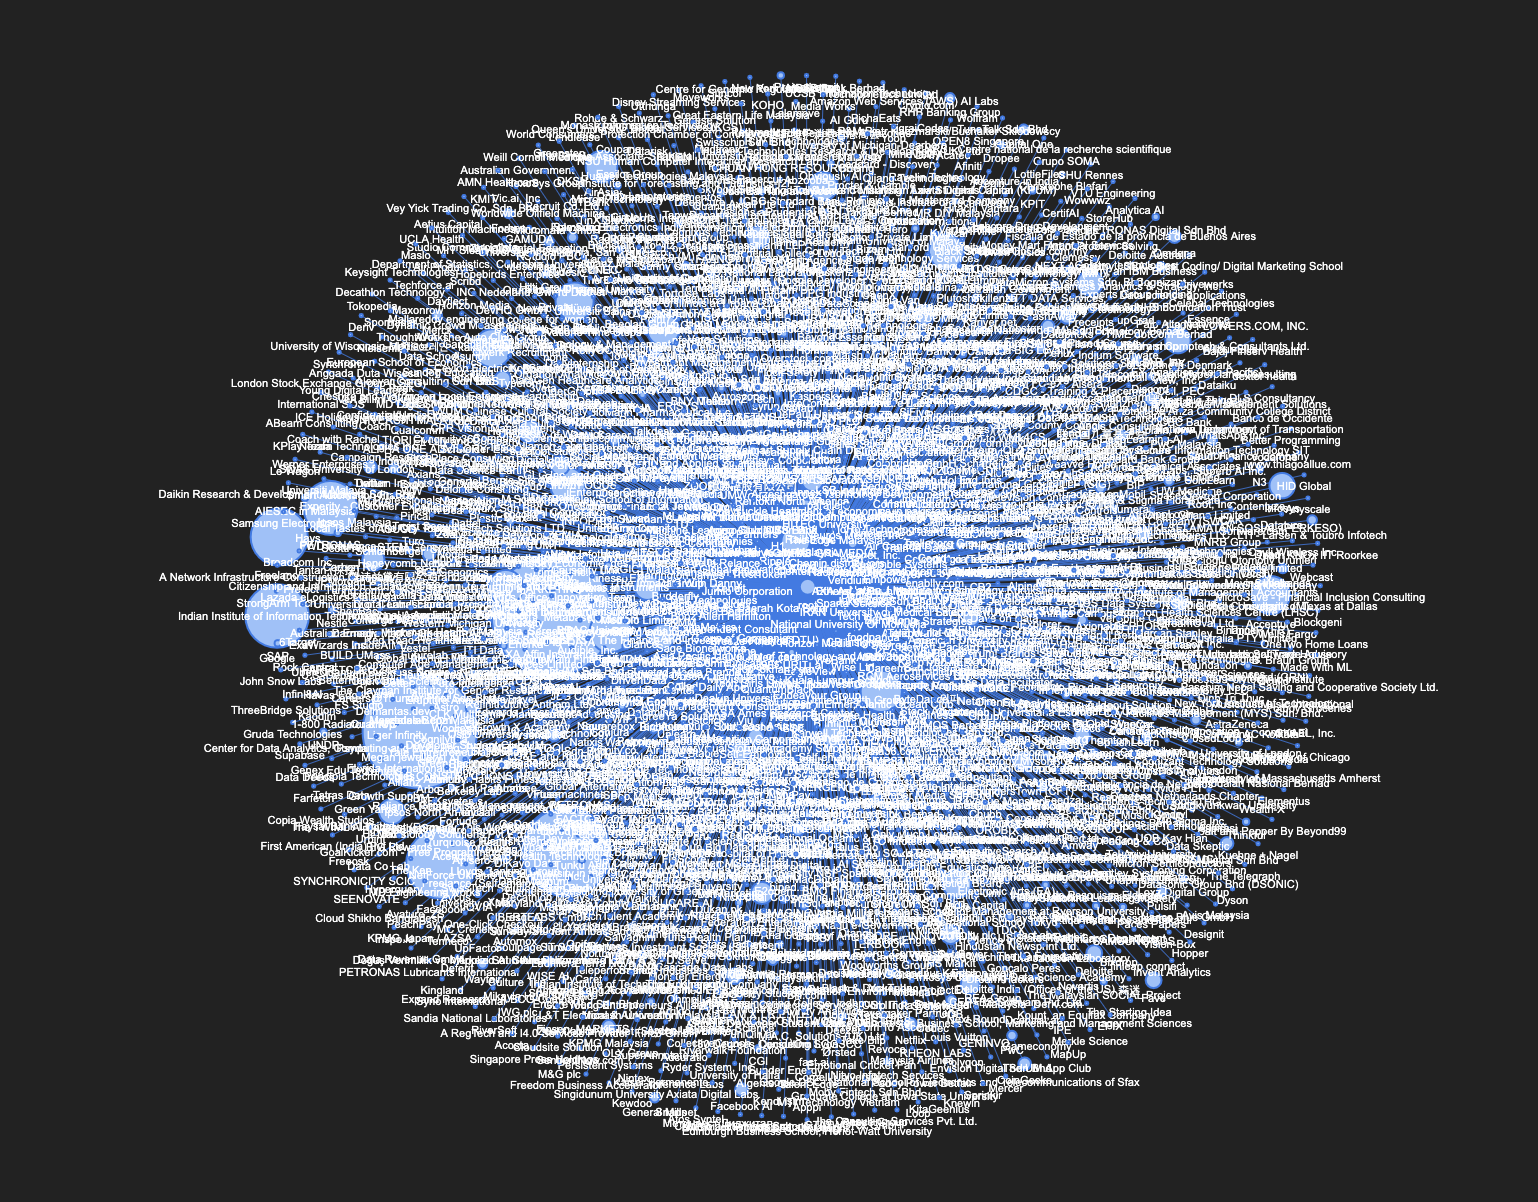
All connections
Here's what happens when I display all of the companies where my connections work at
Explorer des projets similaires
Asabeneh/30-Days-Of-Python
Le défi de programmation 30 Days of Python est un guide pas à pas pour apprendre le langage de programmation Python en 30 jours. Ce défi peut prendre plus de 100 jours. Avancez à votre rythme. Ces vidéos peuvent aussi vous aider : https://www.youtube.com/channel/UC7PNRuno1rzYPb1xLa4yktw
78,704 étoilesgrafana/grafana
Plateforme ouverte et composable d’observabilité et de visualisation de données. Visualise les métriques, les journaux et les traces issus de plusieurs sources, comme Prometheus, Loki, Elasticsearch, InfluxDB, Postgres et bien d’autres.
77,891 étoilesredis/redis
Pour les développeurs qui créent des applications en temps réel pilotées par les données, Redis est le cache, le serveur de structures de données et le moteur de requêtes documentaires et vectorielles préféré, le plus rapide et le plus riche en fonctionnalités.
77,491 étoilesapache/superset
Apache Superset est une plateforme de visualisation et d'exploration de données.
75,519 étoiles