
antvis/AVA has 1,614 GitHub stars and 169 forks. GitHot measured +2 stars in 24 hours and +19 in 7 days. Last checked 2026-11-10 02:18 UTC. Last push 2026-11-02.
Comment ces chiffres sont mesurés
👾 Cadre d’analyse visuelle natif de l’IA, conçu pour les agents.
Progression mesurée des étoiles
- in 24h
- +2
- in 7 days
- +19
- in 15 days
- Mise à jour retardée
- in 1 month
- Mise à jour retardée
Variations nettes sur des périodes qui se chevauchent, pas des totaux quotidiens. Les mesures absentes restent vides. Les étoiles indiquent l’intérêt, pas la qualité.
README.md
OriginalAVA, AI-native Visual Analytics


AVA (
[!NOTE] Think of AVA as PandasAI for JavaScript. 💬📊🤖
It brings natural-language data analysis and visualization to your apps and AI agents.
✨ Why AVA?
🔌 Unified data accessConnect files and databases through one interface. Data sources → |
🔎 Grounded answersInspect the queries and results behind each answer. Trusted analysis → |
📊 Smart visualizationGet charts guided by your question and data. Visualization → |
💻 Local executionChoose where analysis runs and which model endpoint it uses. Execution engines → |
🎯 Published benchmarksCheck accuracy against reference answers under published test conditions. Benchmarks → |
🤖 Agent integrationYour agent reasons; AVA executes the data workflow. Agent integration → |
🚀 Getting started
Install AVA 4.0 with Node.js 22.13+:
npm install @antv/ava@4
💻 Usage
Download sales.csv and configure your model:
import { AVA } from '@antv/ava';

const ava = new AVA({
  llm: {
    model: '<your-model>',
    apiKey: '<your-api-key>',
    // baseURL: '<your-provider-api-url>',
  },
});
1. Load
await ava.source({ type: 'csv-file', options: { path: './sales.csv' } });
[!NOTE] Data preview
First 3 of 240 rows, selected columns:
order_date product sales 2025-01-01 Monitor 224.10 2025-01-02 Office Chair 680.20 2025-01-04 Monitor 2,191.20
2. Explore
Inspect the structure and data quality, then add business definitions:
const schema = await ava.schema();
const profile = await ava.profile({ metrics: ['row_count', 'null_count'] });
await ava.semantic(undefined, () => ({
  description: 'Use the sales column for amounts after discounts and order_date for monthly comparisons.',
}));
[!NOTE] Analysis context
Context Details Structure data: 12 columnsQuality 240 rows; 1 missing regionand 1 missingquantitySemantics salesis after discounts; monthly comparisons useorder_date
3. Suggest
const suggestions = await ava.suggest(3);
[!NOTE] Suggested questions (examples)
- How did sales change from January to February 2025?
- Which products contributed most to the sales decline?
- How do sales and profit vary by region?
4. Analyze
const result = await ava.analyze(
  'Compare January and February 2025 sales by product. Show both months and the change, ordered by the largest decline.'
);
[!NOTE] Analysis result
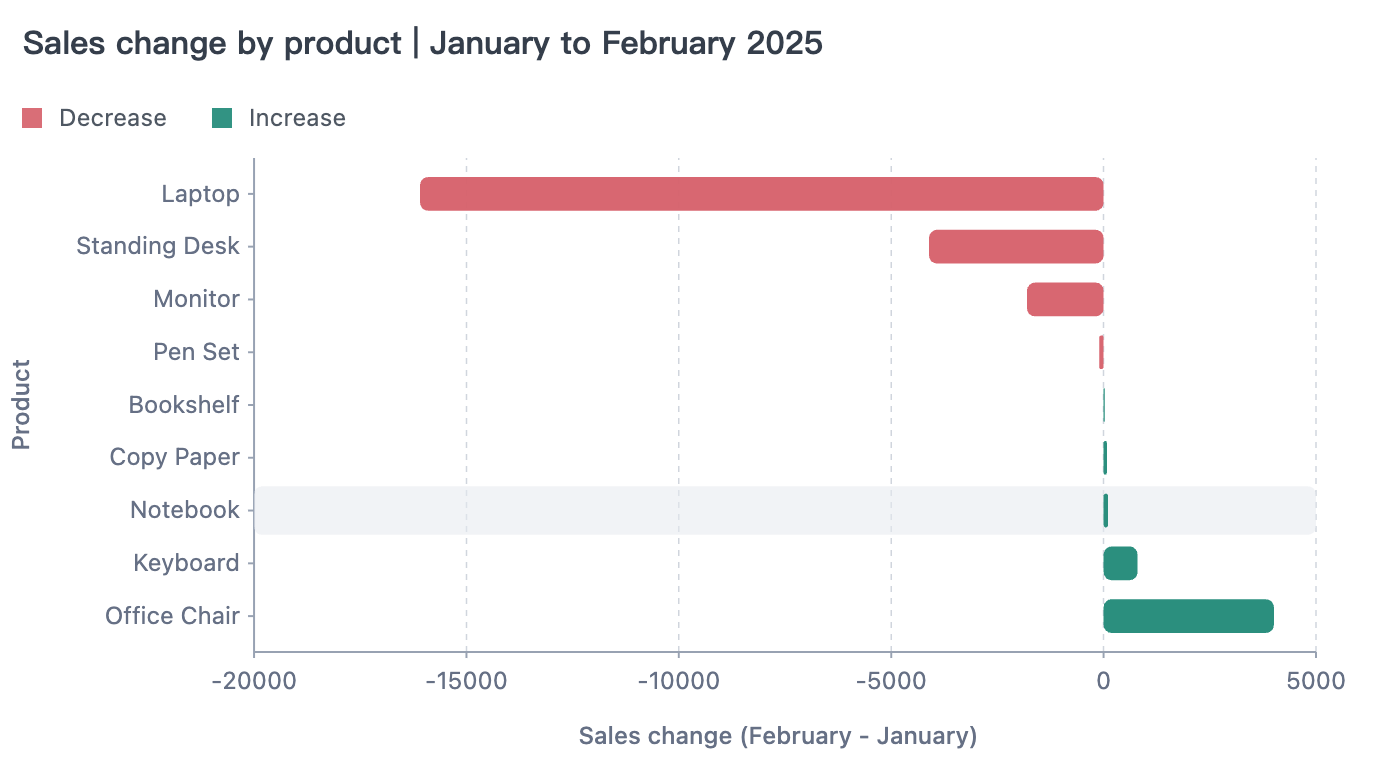
Total sales fell 43.94%, led by a 16,092.10 decline in laptop sales.
First 3 of 9 products:
Product January sales February sales Change Laptop 19,688.10 3,596.00 −16,092.10 Standing Desk 9,655.80 5,546.10 −4,109.70 Monitor 6,536.25 4,731.00 −1,805.25
5. Visualize
const chart = await ava.visualize({
  query: 'Plot the sales change by product from January to February 2025 as a bar chart.',
  data: result.data,
});
[!NOTE] Chart preview
Powered by GPT-Vis.
🔌 Connect your data
 CSV |
 JSON |
 Parquet |
 Excel |
 Text |
 Feishu Bitable |
 Tencent Docs |
 SQLite |
 MySQL |
 PostgreSQL |
 SQL Server |
 MongoDB |
 Supabase |
 ClickHouse |
[!TIP] Missing a data source? 💡🛠️
🎯 Benchmarks
We evaluate AVA on established benchmarks to measure the accuracy and efficiency of its data analysis.

Evaluation setup and reports →
🧩 More ways to use AVA
The agent and CLI workflows run on Node.js 22.13+ on macOS or Linux.
Use with an Agent
Ask your AI agent:
Install the AVA skill with `npx skills add antvis/AVA`, then follow its setup instructions.
Use from the CLI
Load and analyze data from your terminal:
ava source ./sales.csv
ava analyze '<dataset-id>' 'Compare January and February 2025 sales by product.'
See the CLI guide for setup and commands.
📚 Resources
- Documentation — Guides and examples
- Analysis strategies — Direct and loop execution
- API Reference — Methods and configuration
- AI — Try out AVA in the browser environment
- Benchmarks — Evaluation results
- Issues — Bug reports and feature requests
🤝🛠️ Contributing
Contributions are welcome. Include tests, examples, and documentation with new features.
Run npm test to test your changes. For model-backed tests, copy .env.example to .env and add your model settings.
📑 Papers
VizLinter - Chen, Q., Sun, F., Xu, X., Chen, Z., Wang, J. and Cao, N., 2021. VizLinter: A Linter and Fixer Framework for Data Visualization. IEEE transactions on visualization and computer graphics, 28(1), pp.206-216.
《数据可视化设计的类型学实践》(Exploring the Typology of Visualization Design) - 蓝星宇, 王嘉喆. 数据可视化设计的类型学实践, 《美术大观》, 2022(3), 149-152.
⚖️ License
MIT
Explorer des projets similaires
Asabeneh/30-Days-Of-Python
Le défi de programmation 30 Days of Python est un guide pas à pas pour apprendre le langage de programmation Python en 30 jours. Ce défi peut prendre plus de 100 jours. Avancez à votre rythme. Ces vidéos peuvent aussi vous aider : https://www.youtube.com/channel/UC7PNRuno1rzYPb1xLa4yktw
78,486 étoilesgrafana/grafana
Plateforme ouverte et composable d’observabilité et de visualisation de données. Visualise les métriques, les journaux et les traces issus de plusieurs sources, comme Prometheus, Loki, Elasticsearch, InfluxDB, Postgres et bien d’autres.
77,790 étoilesredis/redis
Pour les développeurs qui créent des applications en temps réel pilotées par les données, Redis est le cache, le serveur de structures de données et le moteur de requêtes documentaires et vectorielles préféré, le plus rapide et le plus riche en fonctionnalités.
77,332 étoilesapache/superset
Apache Superset est une plateforme de visualisation et d'exploration de données.
75,455 étoiles