
Rello/analytics
Rello/analytics has 138 GitHub stars and 39 forks. GitHot measured 0 stars in 24 hours and 0 in 7 days. Last checked 2026-11-11 02:09 UTC. Last push 2026-11-03.
Comment ces chiffres sont mesurés
Analytics - Open source data warehouse and reporting for Nextcloud
Progression mesurée des étoiles
- in 24h
- 0
- in 7 days
- 0
- in 15 days
- Mise à jour retardée
- in 1 month
- Mise à jour retardée
Variations nettes sur des périodes qui se chevauchent, pas des totaux quotidiens. Les mesures absentes restent vides. Les étoiles indiquent l’intérêt, pas la qualité.
README.md
OriginalAnalytics for Nextcloud
Business intelligence and reporting within Nextcloud.
Turn operational data into a shared basis for decisions. Analytics helps business teams connect data sources, monitor key performance indicators, and publish interactive reports and management dashboards in their existing Nextcloud environment.
From recurring departmental reports to executive overviews, Analytics brings data preparation, visualization, and collaboration into one workflow. Your Analytics datasets and reports are hosted in your Nextcloud instance, under your organization's control.
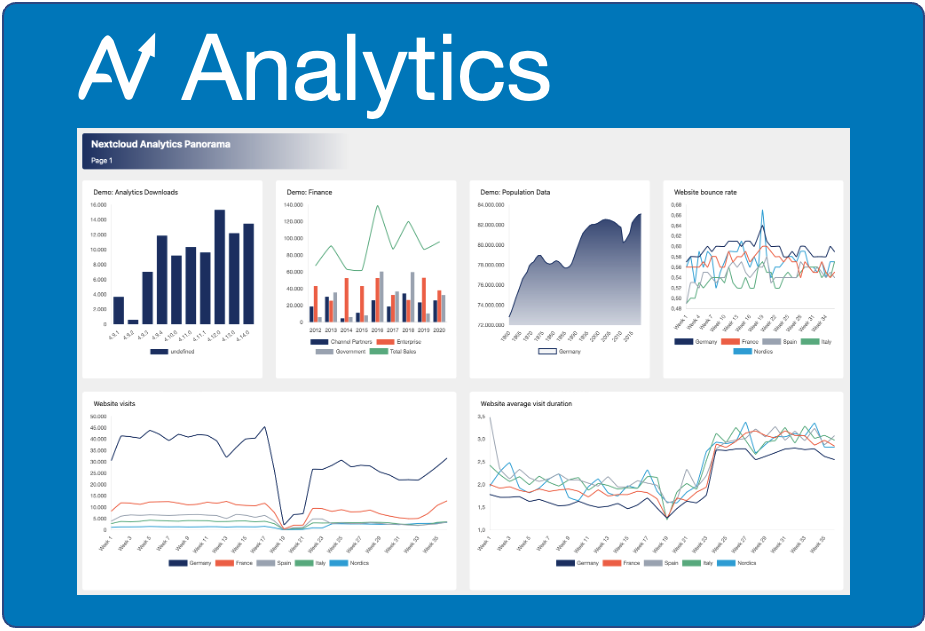
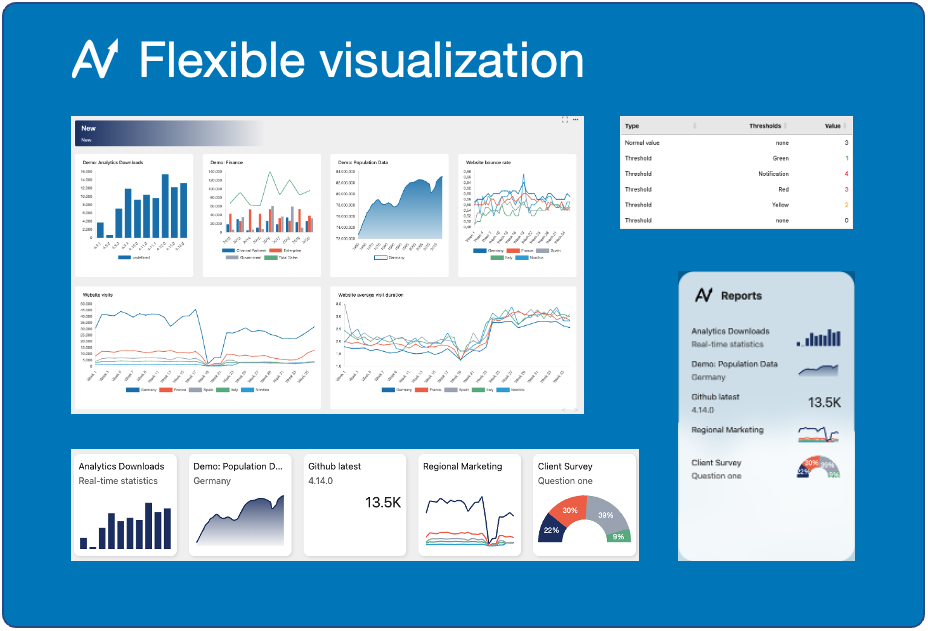
Business value
- Give teams a shared view of performance. Bring reports together in panoramas: multi-page dashboards combining charts, tables, text, and images.
- Reduce recurring reporting work. Reuse datasets across reports and schedule data loads instead of repeating manual imports.
- Explore the drivers behind the numbers. Filter, drill down, aggregate, and calculate measures using visual configuration and live previews.
- Keep reporting close to collaboration. Share reports and panoramas with Nextcloud users and groups, or reach external audiences through share links.
- Retain control of your reporting environment. Run Analytics within Nextcloud and choose which data sources to connect and which reports to share.
Typical business applications
| Team | Example use |
|---|---|
| Management | Combine departmental KPIs and commentary into a shared performance overview. |
| Finance and controlling | Compare revenue, costs, and budget figures from connected files or imported datasets. |
| Operations | Track volumes, service metrics, and trends; highlight values that cross defined thresholds. |
| Project and service teams | Turn survey responses and structured operational data into progress and quality reports. |
Capabilities
Connect and prepare data
- Bring together spreadsheets, business systems, and data from Nextcloud Files, Forms, and Tables.
- Configure data sources visually with intuitive field selection and live data previews.
- Combine current figures and historical data for recurring reporting and long-term comparisons.
- Reuse your data across reports to give teams a consistent basis for analysis.
Analyze and present
- Build interactive charts and tables with visual configuration and live previews.
- Explore performance with filters, drilldowns, calculated measures, and trends.
- Assemble multi-page panoramas with reports, explanatory text, and images.
- Export dashboards and charts for meetings, presentations, and stakeholder updates.
Automate and collaborate
- Keep reports current with scheduled updates and automated workflows.
- Highlight exceptions with color coding and notifications.
- Share with teams and external stakeholders while controlling access to your reports.
- Bring live charts and tables into everyday work across Nextcloud.
- Explore deeper insights with Nextcloud Assistant. Ask questions about your data in natural language.
Documentation
Languages
Support translations on Transifex.
Maintainers
- Marcel Scherello (author, project leader)


Explorer des projets similaires
Asabeneh/30-Days-Of-Python
Le défi de programmation 30 Days of Python est un guide pas à pas pour apprendre le langage de programmation Python en 30 jours. Ce défi peut prendre plus de 100 jours. Avancez à votre rythme. Ces vidéos peuvent aussi vous aider : https://www.youtube.com/channel/UC7PNRuno1rzYPb1xLa4yktw
78,560 étoilesgrafana/grafana
Plateforme ouverte et composable d’observabilité et de visualisation de données. Visualise les métriques, les journaux et les traces issus de plusieurs sources, comme Prometheus, Loki, Elasticsearch, InfluxDB, Postgres et bien d’autres.
77,830 étoilesredis/redis
Pour les développeurs qui créent des applications en temps réel pilotées par les données, Redis est le cache, le serveur de structures de données et le moteur de requêtes documentaires et vectorielles préféré, le plus rapide et le plus riche en fonctionnalités.
77,395 étoilesapache/superset
Apache Superset est une plateforme de visualisation et d'exploration de données.
75,473 étoiles