
yotambraun/APDTFlow
yotambraun/APDTFlow has 44 GitHub stars and 5 forks. Star changes are not measured yet. Last checked 2026-11-10 03:08 UTC. Last push 2026-11-03.
APDTFlow is a modern and extensible forecasting framework for time series data that leverages advanced techniques including neural ordinary differential equations (Neural ODEs), transformer-based components, and probabilistic modeling. Its modular design allows researchers and practitioners to experiment with multiple forecasting models and easily
Crecimiento de estrellas medido
- in 24h
- Actualización retrasada
- in 7 days
- Actualización retrasada
- in 15 days
- Actualización retrasada
- in 1 month
- Actualización retrasada
Cambios netos en períodos que se solapan, no totales diarios. Los datos no disponibles se dejan en blanco. Las estrellas indican interés, no calidad.
README.md
Original

APDTFlow: know WHEN it will happen


Website · Quickstart notebook · Docs · Features · Benchmarks · GPU & performance · Methodology
Most forecasting tools tell you what the value will be. Operations and reliability
teams usually need something else: when will this metric cross the line? APDTFlow
models time as continuous (Neural ODEs), so one trained model answers that question
directly, with a calibrated uncertainty window on the time itself and an act_by
date to schedule against.
| Question | API |
|---|---|
| What are the next k values? | model.predict() |
| What is the value at any moment (14:37, in 3.6 steps, beyond the trained horizon)? | model.predict_at(timestamps) |
| When will the value cross a threshold, with uncertainty on the time itself? | model.predict_when(threshold) |
| Which assets in a fleet need attention first? | model.predict_when_fleet(assets, threshold) |
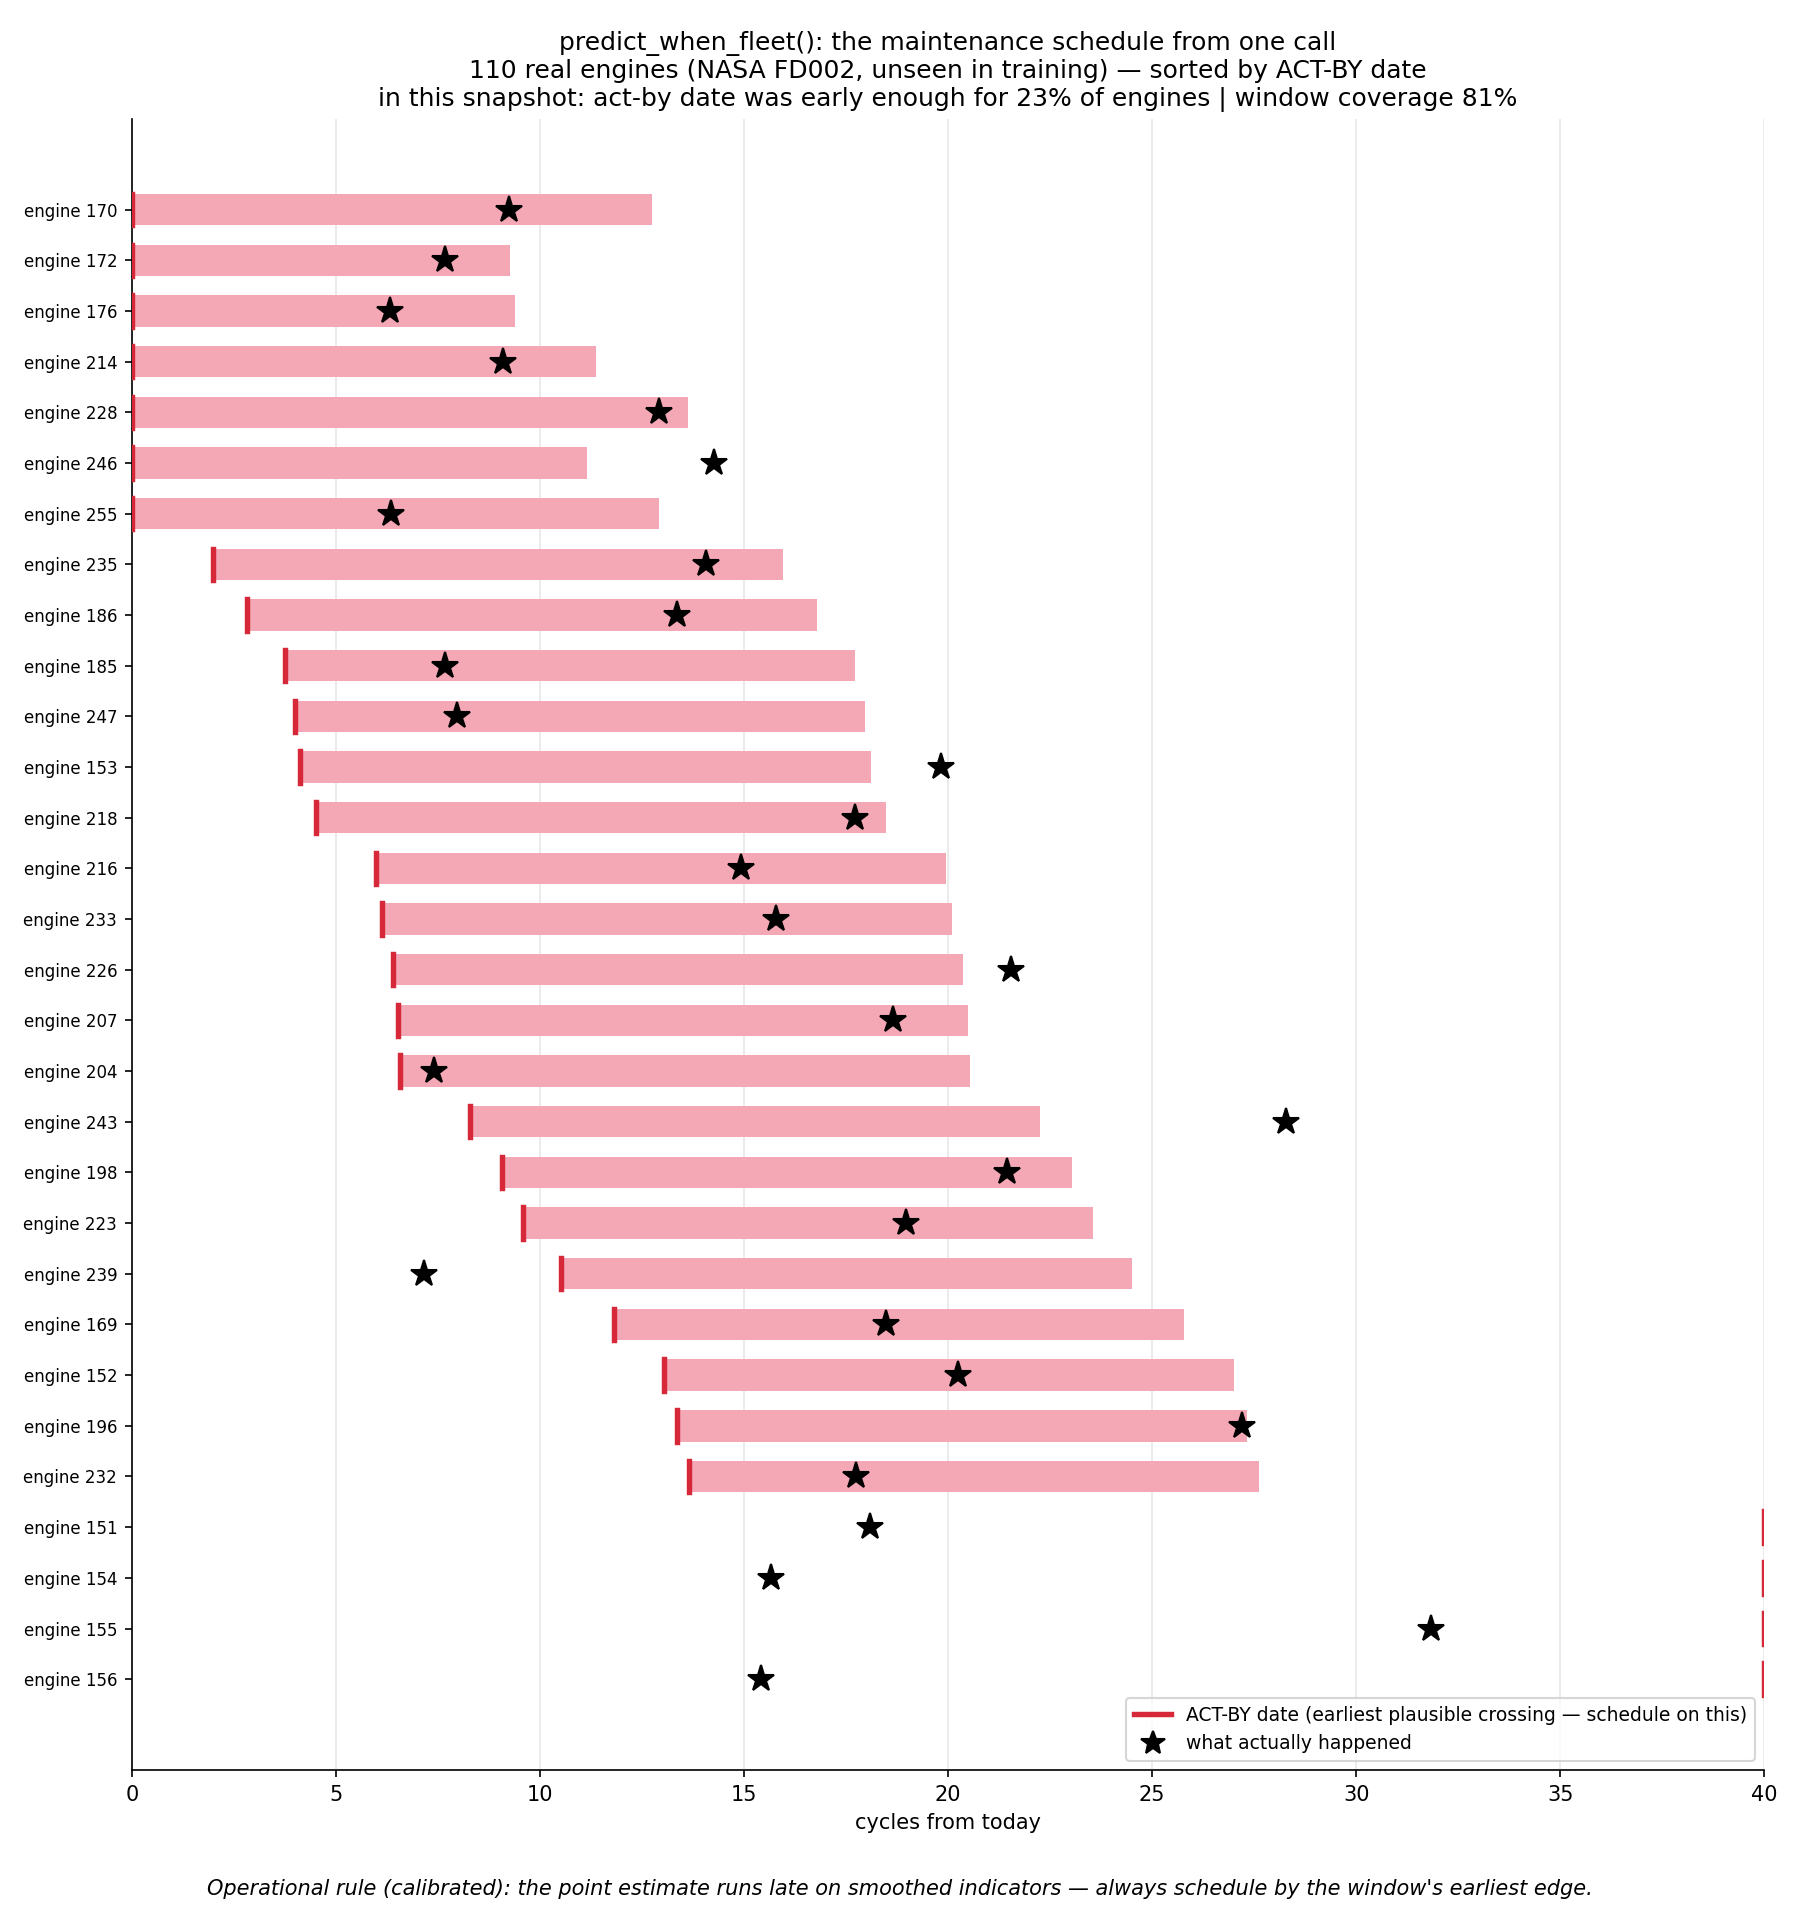
predict_when_fleet() turns real NASA jet engines (never seen in training) into a
maintenance schedule sorted by act-by date, with what actually happened marked. In
this measured snapshot the calibrated windows covered 81% of the actual crossings.
Install
pip install apdtflow
Python 3.10–3.14. PyTorch is installed automatically; on Linux the default wheel
already includes CUDA. On Windows, install the CUDA build of PyTorch first
(pytorch.org) to use an NVIDIA GPU. On
CPU-only Linux machines, pip install torch --index-url https://download.pytorch.org/whl/cpu is a much smaller download. Extras:
apdtflow[serve], [mlflow], [wandb], [dev].
Quickstart
import pandas as pd
from apdtflow import APDTFlowForecaster

url = ("https://raw.githubusercontent.com/yotambraun/APDTFlow/main/"
       "dataset_examples/daily-minimum-temperatures-in-me_clean.csv")
df = pd.read_csv(url, parse_dates=["Date"])

model = APDTFlowForecaster(forecast_horizon=14, history_length=30, num_epochs=5,
                           decoder_type="continuous", use_conformal=True)
model.fit(df, target_col="Daily minimum temperatures", date_col="Date")

print(model.predict())                          # next 14 days
print(model.predict_at(["1991-01-01 14:37", 3.6]))  # any moment: timestamp or step offset
r = model.predict_when(threshold=11.0, direction="below", alpha=0.1)  # below 11 °C?
print(r.eta, r.earliest, r.latest, r.act_by, r.censored)  # schedule by act_by
Runs in about a minute and a half on a laptop CPU (87 s measured on an i7-12700H, download included). decoder_type="continuous" enables predict_at / predict_when;
use_conformal=True calibrates the value intervals and predict_when's time window
with conformal prediction. A result with censored=True means "no crossing
within the horizon at this confidence", which is a valid answer, and a common one on
this series: a 14-day forecast of the daily minimum stays near its recent level. Event
timing on real degradation data, measured over many seeds, is in the next section; a
single fit is one draw.
Measured results (scripts in experiments/)
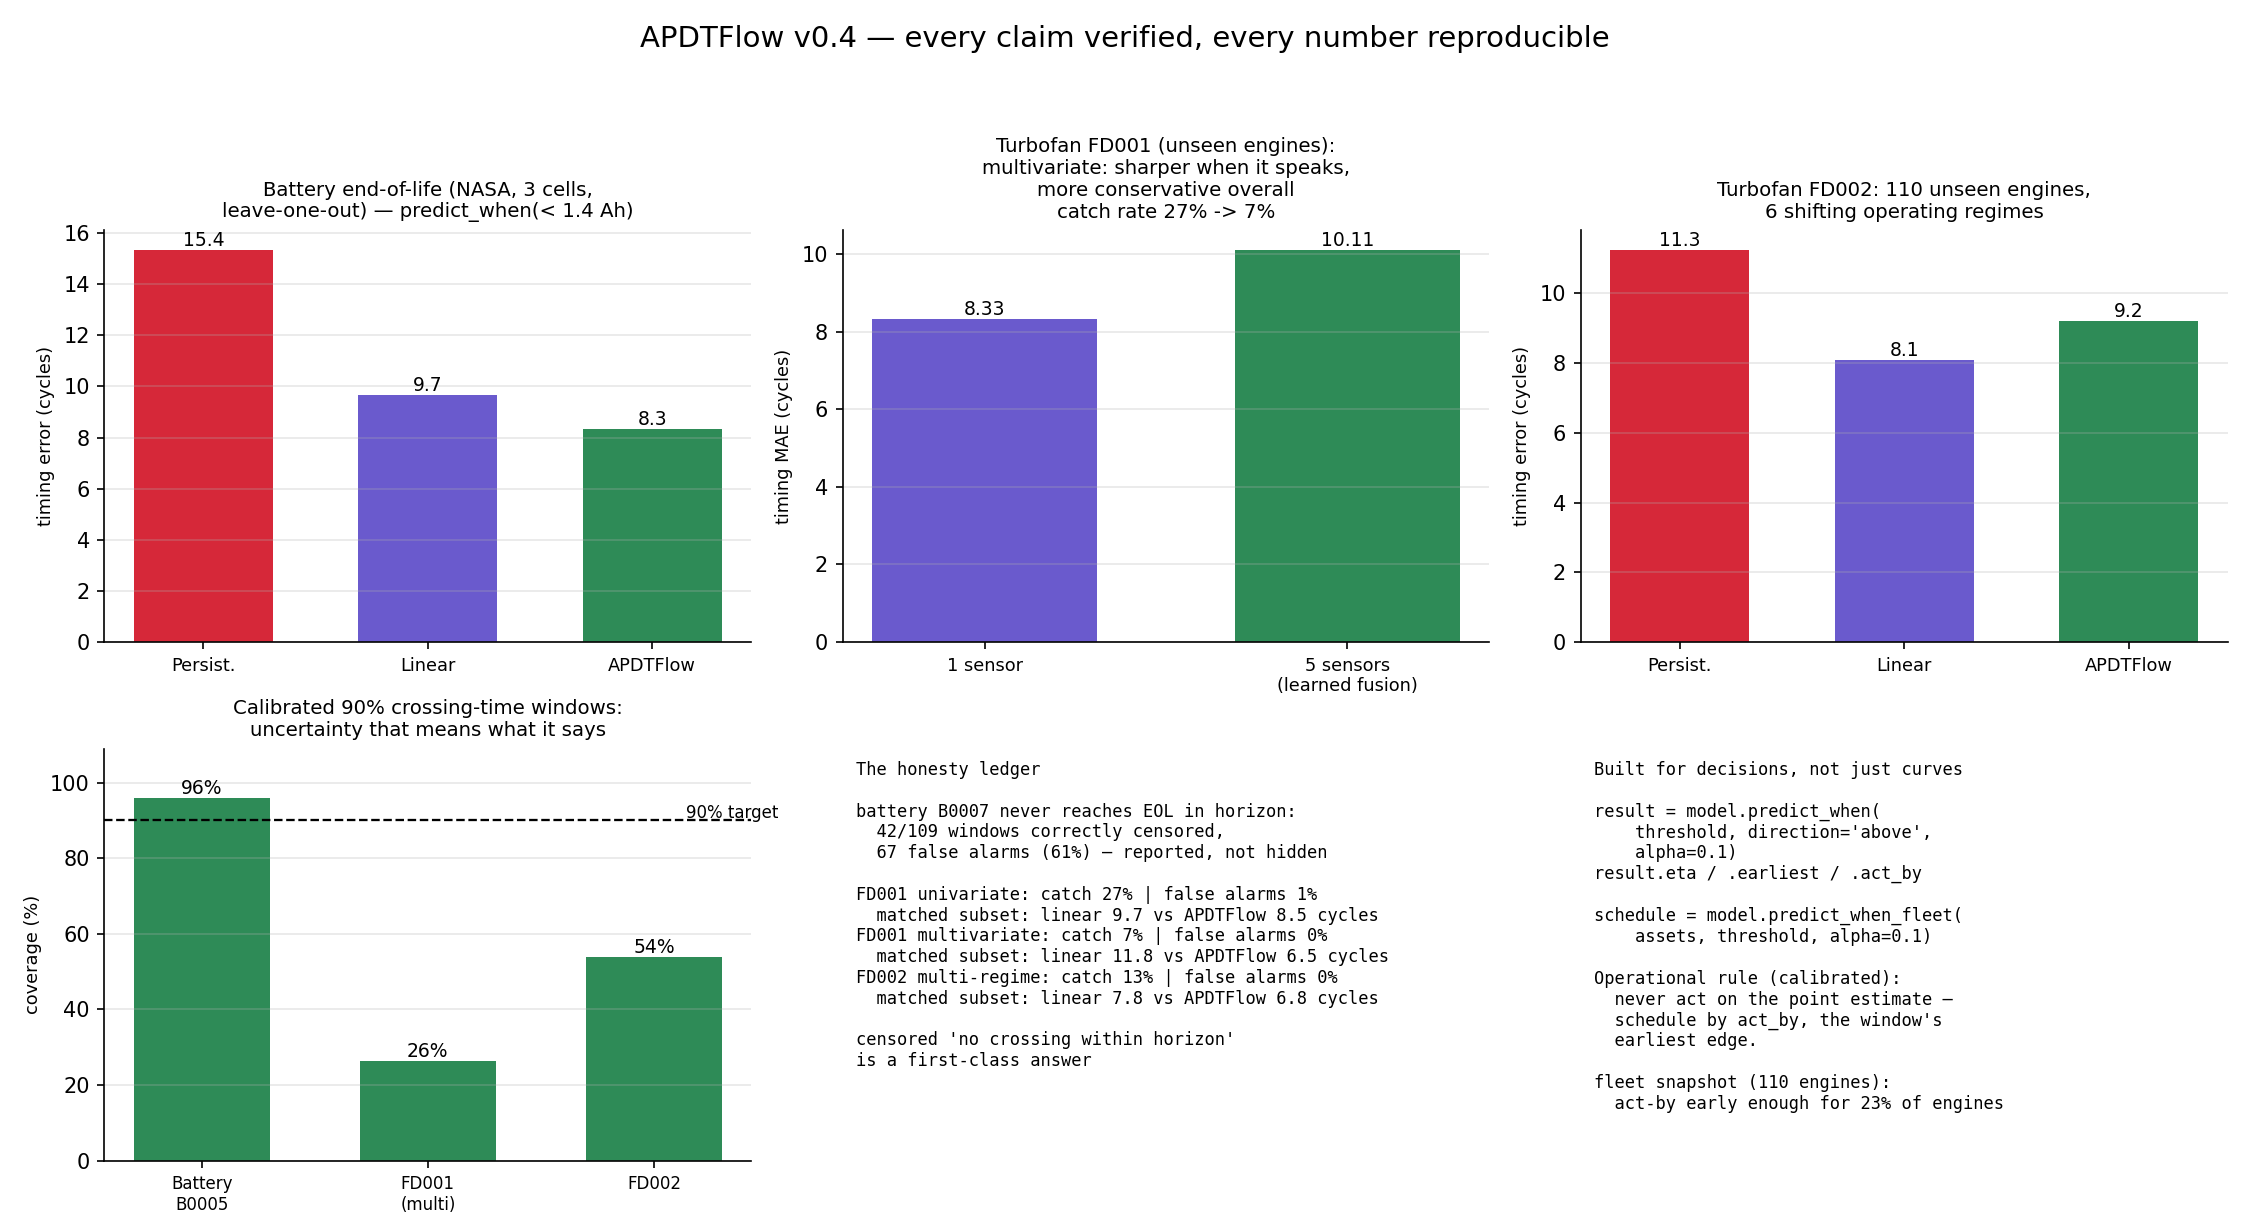
| Event-timing audit (real NASA data, held-out units) | APDTFlow | Linear extrap. | Persistence |
|---|---|---|---|
| Battery end-of-life, 3 cells leave-one-battery-out (timing MAE, measured cycles; June, one seed) | 8.3 (2.8 on the typical cell) | 9.7 | 15.4 |
| Turbofan FD001, 40 unseen engines (timing MAE, cycles; 0.6% false alarms) | 8.3 | 8.7 | 11.5 |
| Turbofan FD002, 110 unseen engines, 6 operating regimes (timing MAE, cycles; 0.0% false alarms) | 9.2 | 8.1 | 11.3 |
These are single-seed runs from June 2026. In them APDTFlow beat both baselines on the battery and FD001 audits and lost to linear extrapolation on FD002 (while posting zero false alarms across its 2,638 no-crossing windows). A November re-run of the battery audit across 10 seeds, on different hardware and PyTorch, put APDTFlow slightly behind linear extrapolation on average (pooled MAE 9.1–12.0, mean 10.7, vs 9.7; it won on 2 of 10 seeds), with honest censoring on every seed. Read the single-seed rows as one draw, not a ranking. FD001 and FD002 have not been re-run across seeds yet. Time-window coverage measured 96% / 40% / 54% against a 90% target in June (0–100% across the battery re-run seeds, mean 73%). These audits calibrate on the training windows, the library default (METHODOLOGY.md compares it with holding windows out). Details and per-seed tables: docs/experiment_results.md.
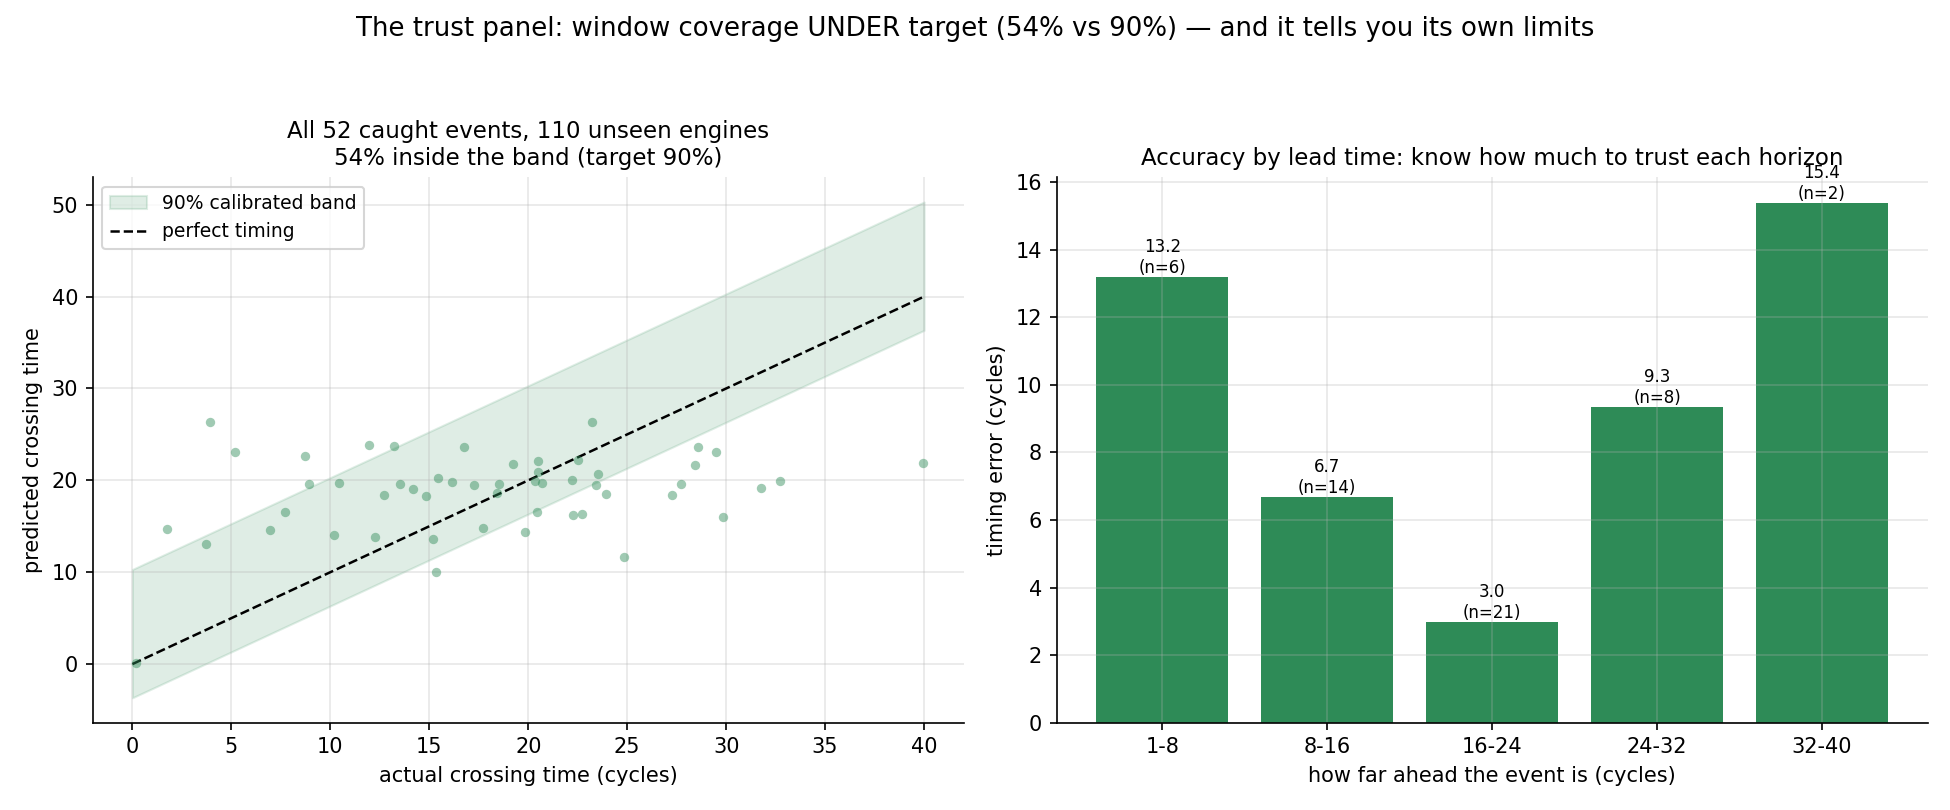
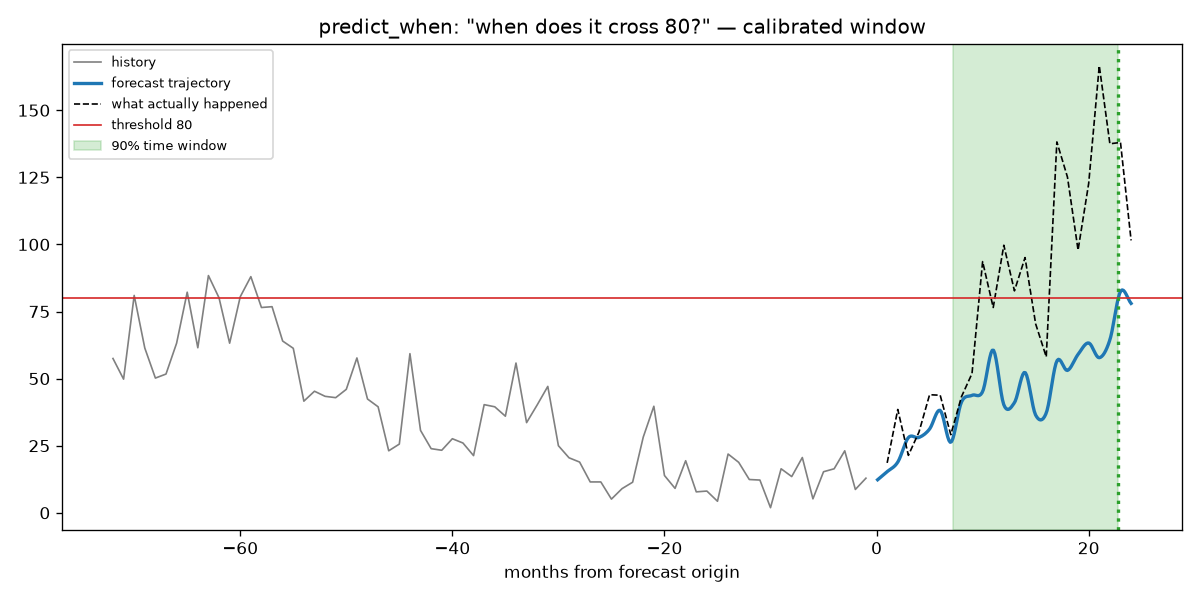
The operational rule: schedule by act_by (the window's earliest edge), never by
the point estimate. The trust panel shows why. Point estimates saturate toward
mid-horizon for distant events, and the per-lead-time error bars tell you how much
to trust each horizon.
 |
 |
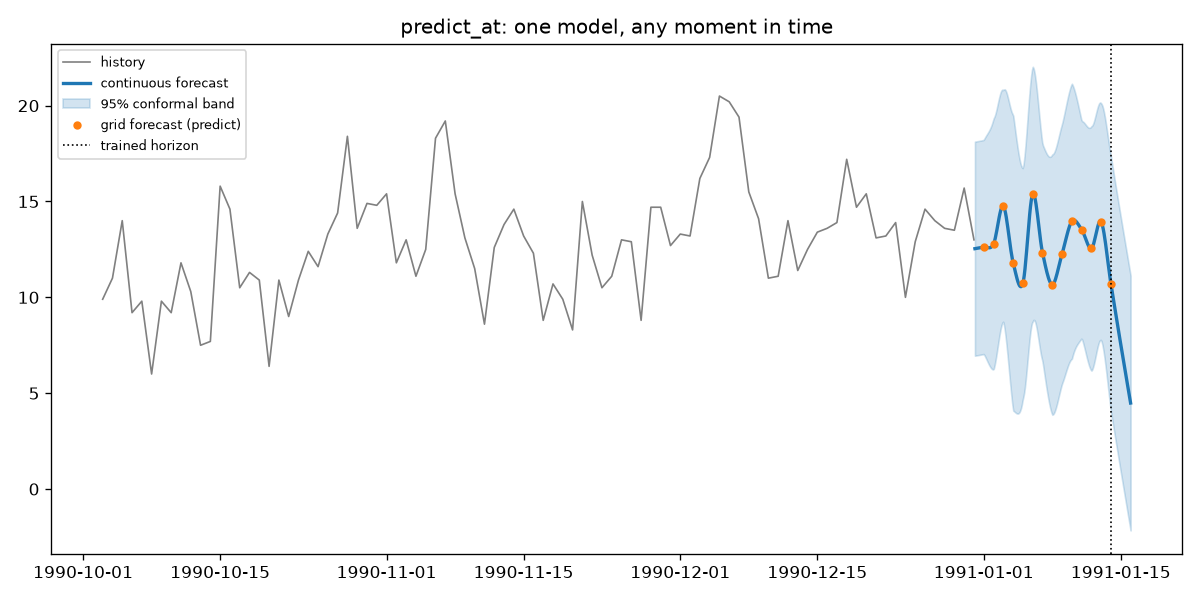
predict_at: one model queried at arbitrary real-valued times, with interpolated conformal intervals (examples/predict_at_demo.py). |
predict_when: "when will solar activity rise above 80?" The point estimate (month 23) is late; the 90% window (months 7–23) held the real crossing at month 10, and act_by (month 7) was on time (examples/predict_when_demo.py). |
Is the base forecaster accurate?
MAE relative to seasonal-naive (<1.0 beats it), 12-step horizon, 6 datasets (2 real),
measured June 2026 with experiments/benchmark_multidomain.py:
| Dataset | APDTFlow | Linear | Holt-Winters |
|---|---|---|---|
| Daily min temperature (real) | 0.73 | 0.74 | 0.80 |
| Regime-switching nonlinear | 0.77 | 0.83 | 0.86 |
| Trend + dual seasonality | 0.85 | 0.50 | 0.38 |
| Retail-like multiplicative seasonal | 1.01 | 0.68 | 0.81 |
| Electric production (real, 397 pts) | 1.52 | 1.03 | 1.23 |
| Random walk (unpredictable) | 1.86 | 1.15 | 1.12 |
For pure grid accuracy on regular data, tuned deep models (NeuralForecast) or
zero-shot foundation models (Chronos-2, TimesFM, Moirai-2) may be stronger. APDTFlow's
value is the questions grid models do not answer: predict_at at arbitrary times and
calibrated predict_when event timing. It complements a foundation model rather than
replacing one.
GPU and performance
device="auto" (the default) picks CUDA, then Apple MPS, then CPU. Every code path
runs on the selected device: training, conformal calibration, predict,
predict_at, predict_when and fleet scoring. Checkpoints are stored on CPU, so a
model trained on a GPU loads anywhere, and model.to("cpu") moves a fitted model.
On an NVIDIA GPU each training step is captured once and replayed as a CUDA
graph: the same arithmetic without the ~20,000 tiny kernel launches per step that
used to make the GPU slower than the CPU. Measured on one laptop (Intel i7-12700H vs
an RTX 3050 Ti Laptop GPU, WSL2), the GPU now trains 4.4x faster than the CPU at
the default size (1.0 vs 4.6 s per epoch) and 5–7x faster for bigger models.
Single-window calls are still faster on the CPU, so train on the GPU and serve with
model.to("cpu"); fleet-scale scoring favours the GPU. Full tables, the profile, the
method and the measured reason AMP is not used:
docs/gpu_and_performance.md.
When NOT to use APDTFlow
- Stock prices or crypto: random-walk regime. Nothing beats naive, including us (it's in the benchmark table on purpose).
- Event timing on noise-driven crossings (which exact day a noisy daily series first dips): no model has skill there; expect wide, honest windows.
- Irregularly sampled or heavily missing data: our ODE-RNN encoders and missingness features lost to simple imputation baselines (documented).
- Very short series (< ~500 points): use ETS/ARIMA.
What's inside
- Split and adaptive conformal prediction on held-out windows;
predict_whenwindows calibrated in time space (on crossing-time errors), with analphasensitivity knob - Multivariate sensor fusion (
feature_cols=) with readablesensor_importance_; per-regime normalization for multi-condition equipment - Fleet API:
predict_when_fleet()returns an act-by-sorted schedule ready for CSV (train on a whole fleet withfit(df, ..., group_col="unit"), so no window spans two units) - Exogenous and categorical features, rolling-origin backtesting
(
historical_forecasts), MASE/sMAPE/CRPS/coverage metrics,score_recent()drift checks - Production plumbing:
save/loadwith scalers and calibration, TorchScript export, FastAPI serving example, sklearn-styleget_params/set_params,set_seed(), MLflow/W&B logging hook,py.typed, CLI (apdtflow train/infer --device) - Architectures: Neural ODE (default), Transformer, TCN
The full list with usage snippets: docs/features.md and the website.
Have degradation or depletion data?
python experiments/audit_predict_when.py --csv your.csv --value-col y --threshold 80 --direction above
benchmarks predict_when against persistence, linear extrapolation and seasonal
baselines on your data. If APDTFlow wins, open a PR and we will feature your domain
with your numbers. That is how every result above was produced, including the ideas
we tested and rejected (docs/METHODOLOGY.md).
Versioning
SemVer, pre-1.0: breaking changes land only in minor releases and are flagged in the CHANGELOG. 0.5.0 changes how conformal calibration splits data (see the changelog). Checkpoints from ≤ 0.3.x are rejected: those versions had a defect that made predictions independent of the input data (engineering history).
Articles
- A Practical Approach to Time Series Forecasting with APDTFlow (Towards AI)
- APDTFlow v0.3.0: From Research to Production-Ready Time Series Forecasting (Towards AI)
Both cover earlier versions; the API has grown since, and v0.4.0 fixed a critical model defect. Check the CHANGELOG before following old snippets.
Citation
@software{apdtflow,
  author  = {Braun, Yotam},
  title   = {APDTFlow: continuous-time forecasting with Neural ODEs},
  url     = {https://github.com/yotambraun/APDTFlow},
  year    = {2026},
  version = {0.5.0}
}
Contributing and license
See CONTRIBUTING.md for the dev setup, the evidence rules, and the benchmark roadmap. MIT licensed (LICENSE).
Explorar proyectos relacionados
tensorflow/tensorflow
Un framework de código abierto de aprendizaje automático para todos
201,427 estrellashuggingface/transformers
🤗 Transformers: el framework de definición de modelos para modelos de aprendizaje automático de vanguardia en texto, visión, audio y multimodal, tanto para inferencia como para entrenamiento.
168,711 estrellasAUTOMATIC1111/stable-diffusion-webui
Interfaz web de Stable Diffusion
165,289 estrellasComfy-Org/ComfyUI
La GUI, la API y el backend más potentes y modulares para modelos de difusión, con una interfaz de grafos y nodos. El motor de inferencia local más rápido del mundo.
146,271 estrellas