Proyectos Ver en GitHub
shahinrostami/plotapi
shahinrostami/plotapi has 272 GitHub stars and 17 forks. GitHot measured 0 stars in 24 hours and 0 in 7 days. Last checked 2026-11-22 00:17 UTC. Last push 2025-07-22.
What you can do
- PlotAPI Chord - Illustrate inter-relationships between data.
- PlotAPI SplitChord - Illustrate inter-relationships between bipartite data.
- PlotAPI Sankey - Illustrate the flow from one set of values to another.
- PlotAPI Terminus - Illustrate distributing something out amongst recipients.
Crecimiento de estrellas medido
- in 24h
- 0
- in 7 days
- 0
- in 15 days
- Recopilando historial
- in 1 month
- Recopilando historial
Cambios netos en períodos que se solapan, no totales diarios. Los datos no disponibles se dejan en blanco. Las estrellas indican interés, no calidad.
Acerca de
Engaging visualisations, made easy.
DatosREADME.md
Original
Engaging visualisations, made easy.


Key Features • Get Access • Installation • Usage • Docs
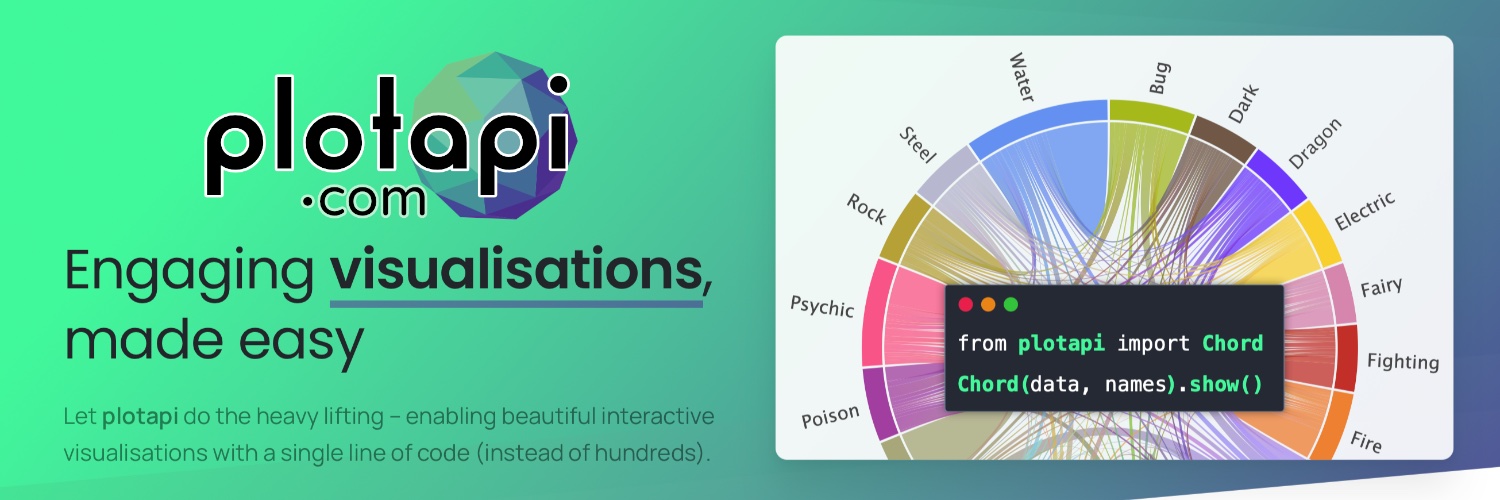
Key Features
- PlotAPI Chord - Illustrate inter-relationships between data.
- PlotAPI SplitChord - Illustrate inter-relationships between bipartite data.
- PlotAPI Sankey - Illustrate the flow from one set of values to another.
- PlotAPI Terminus - Illustrate distributing something out amongst recipients.
- PlotAPI Bar Fight - A beautiful take on the classic Bar Chart Race.
- PlotAPI Pie Fight - A beautiful take on the classic Pie Chart Race.
- PlotAPI Heat Map - Beautiful and interactive heat maps.
- PlotAPI Line Fight - A beautiful take on the classic Line Chart Race.
- PlotAPI Pareto Front - Illustrate non-dominated (Pareto) fronts over time.
- PlotAPI Goal rush - Illustrate progress toward a goal over time.
- Upcoming Visualisations - Access to new visualisations as they are introduced.
- Supports Most Programming Languages - Get started with any language able to make HTTP requests.
- First-Class Python Support - Get started with pip install plotapi
- Jupyter Lab/Notebook + Google Colab Support - Super-charge your notebooks with inline visualisations.
- Beautiful Themes & Fonts - Select from pre-made beautiful themes, or add your own.
- Share or Embed Interactive HTML - Download and embed your interactive visualisations.
- Upload and Share - Upload and share your visualisations, privately or publicly.
- Render to PDF, SVG, or PNG - Generate high-quality output ready for print.
- Record Animation to MP4 Video - Create social media-ready animated visualisations.
Get Access
Visit the website to get access to PlotAPI.
Installation
Get up and running with Python with the following command.
pip install plotapi
Usage
Example - Chord Pro
Created with PlotAPI
Chord(matrix, names).show()
The data
matrix = [
    [0, 5, 6, 4, 7, 4],
    [5, 0, 5, 4, 6, 5],
    [6, 5, 0, 4, 5, 5],
    [4, 4, 4, 0, 5, 5],
    [7, 6, 5, 5, 0, 4],
    [4, 5, 5, 5, 4, 0],
]

names = ["Action", "Adventure", "Comedy", "Drama", "Fantasy", "Thriller"]
Example - Sankey Pro
Created with PlotAPI
Sankey(links).show()
The data
links = [
    {"source":"Salary", "target":"Me", "value": 40000},
    {"source":"Freelance", "target":"Me", "value": 10000},
    {"source":"Dividends", "target":"Me", "value": 6000},

    {"source":"Me", "target":"Rent", "value": 1100*12},
    {"source":"Me", "target":"Food", "value": 300*12},
    {"source":"Me", "target":"Magazine Subscription", "value": 2000},
    {"source":"Me", "target":"Personal Tax", "value": 6000},
    {"source":"Me", "target":"Investments", "value": 30000},

    {"source":"Investments", "target":"Facebook", "value": 8000},
    {"source":"Investments", "target":"Amazon", "value": 7000},
    {"source":"Investments", "target":"Apple", "value": 6000},
    {"source":"Investments", "target":"Netflix", "value": 5000},
    {"source":"Investments", "target":"Google", "value": 4000},
]
License
MIT
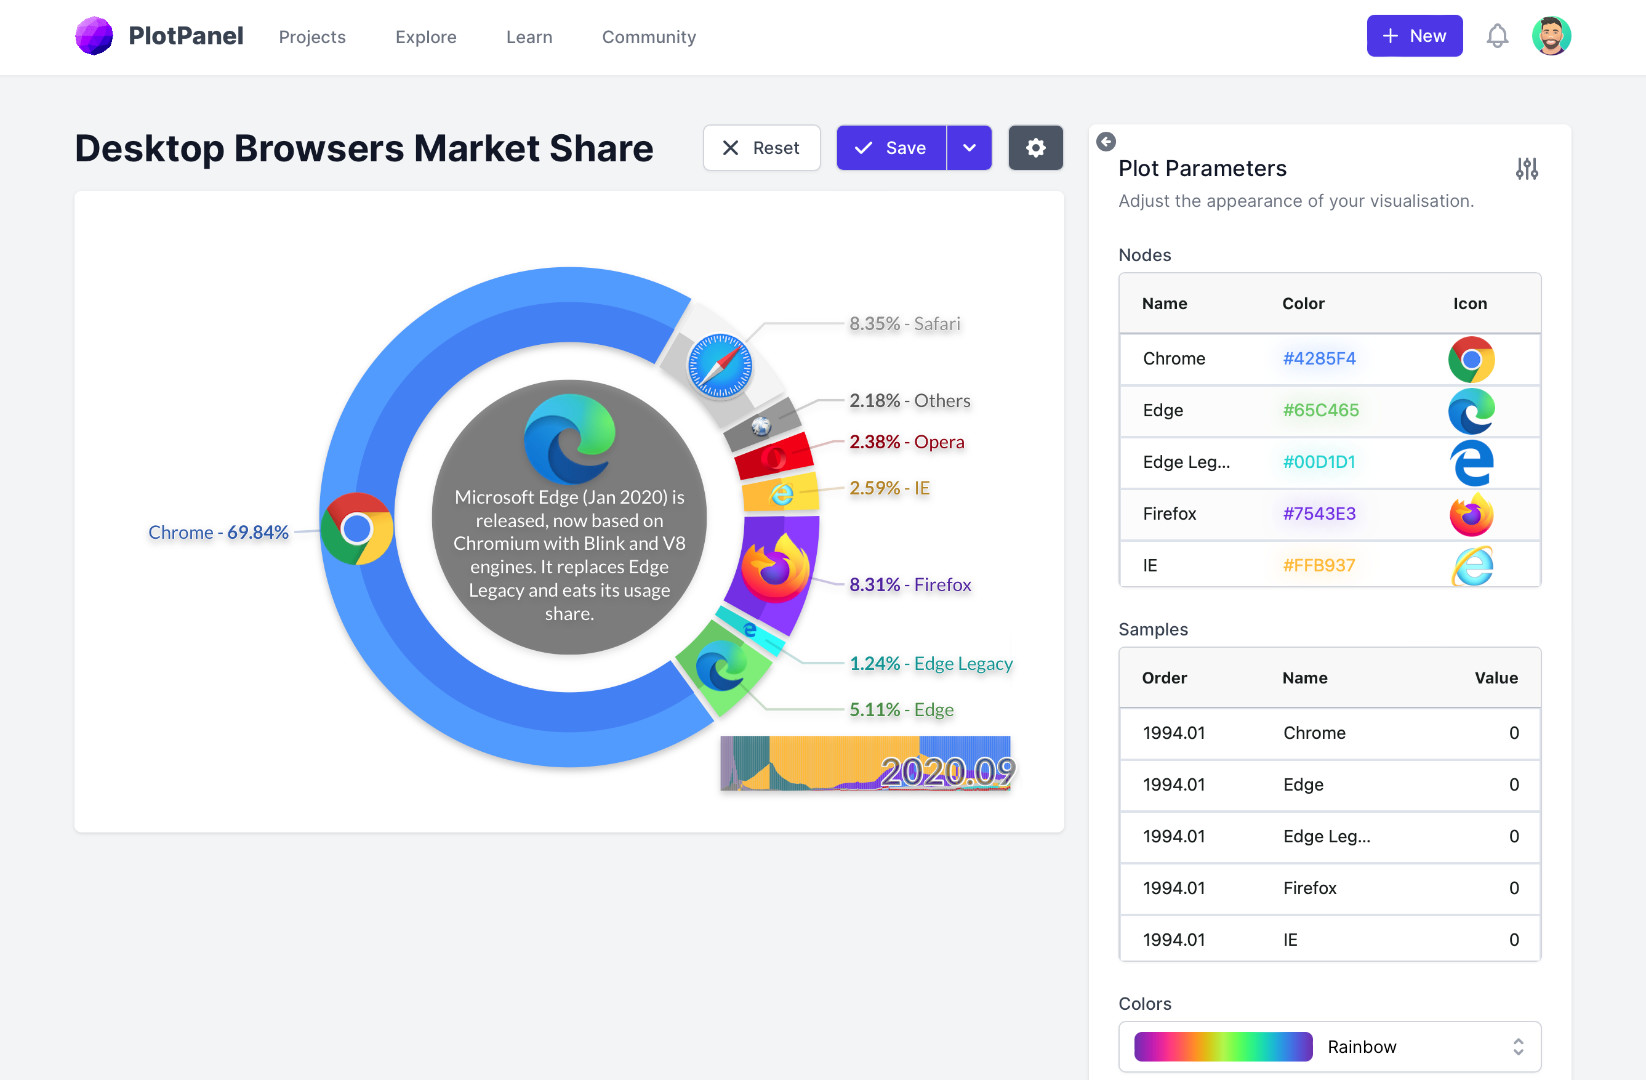
Prefer not to code? Try the App at PlotAPI.com
plotapi.com · GitHub @shahinrostami · Twitter @shahinrostami · A Polyra innovation
Explorar proyectos relacionados
Cargando…