
polakowo/vectorbt
polakowo/vectorbt has 9,787 GitHub stars and 1,280 forks. GitHot measured +120 in 7 days. Last checked 2026-11-10 03:39 UTC. Last push 2026-11-03.
El motor de investigación que te da una ventaja competitiva. Ejecuta miles de ideas de trading antes de que otros terminen de probar una sola.
What you can do
- Fast, vectorized backtesting Research strategies at scale with pandas, NumPy, and Numba. Backtesting examples → - Optional Rust engine Use precompiled kernels for supported operations without JIT compilation. Rust engine →
Crecimiento de estrellas medido
- in 24h
- Actualización retrasada
- in 7 days
- +120
- in 15 days
- Actualización retrasada
- in 1 month
- Actualización retrasada
Cambios netos en períodos que se solapan, no totales diarios. Los datos no disponibles se dejan en blanco. Las estrellas indican interés, no calidad.
README.md
Original











简体中文 / English | Features · Installation · Examples · Links
Trading research at scale.
VectorBT is a Python toolkit for trading research. Explore market data, build indicators and signals, and compare thousands of ideas across assets and timeframes. NumPy arrays, Numba acceleration, and an optional Rust engine let you run large experiments in a few lines of Python.
Move from exploring price patterns to evaluating strategies in one workflow. Inspect trades, fees, drawdowns, and portfolio performance, then explore the results with interactive charts. Built for traders, researchers, and AI agents, VectorBT brings data analysis, strategy simulation, and visualization together in a composable Python API.
VectorBT is the open-source community edition of VectorBT PRO. PRO extends the library with parallelization, additional data integrations, portfolio optimization, pattern recognition, event projections, limit orders, leverage, and over 100 other features, with new features added weekly.
See VectorBT vs PRO or browse PRO feature examples.
Features
Fast, vectorized backtestingResearch strategies at scale with pandas, NumPy, and Numba. |
Optional Rust engineUse precompiled kernels for supported operations without JIT compilation. |
Pandas-native APIWork with custom accessors and high-performance operations directly on pandas objects. |
Flexible broadcastingAnalyze multiple assets and sweep large parameter grids with flexible array broadcasting. |
Rich indicator ecosystemBuild custom indicators and use integrations for TA-Lib, Pandas TA, and more. |
Portfolio backtestingAnalyze trades, drawdowns, and performance, with QuantStats integration. |
Signal toolingGenerate, rank, map, and analyze the distribution of trading signals. |
Built-in data accessFetch market data, preprocess it, and generate synthetic time series. |
Robustness testingRun walk-forward optimization and generate labels for machine learning workflows. |
Interactive visualizationExplore results with Plotly charts, Jupyter widgets, and browser dashboards. |
Automation toolsSchedule data updates and send Telegram notifications. |
Composable Python APICombine building blocks for rapid experimentation and AI agent-driven workflows. |
Installation
pip install -U vectorbt
To install the optional Rust engine:
pip install -U "vectorbt[rust]"
To install all optional integrations (TA-Lib, Pandas TA, etc.):
pip install -U "vectorbt[full]"
To install all optional integrations together with the Rust engine:
pip install -U "vectorbt[full,rust]"
Examples
Invest $100 in Bitcoin since 2014
import vectorbt as vbt

data = vbt.YFData.download("BTC-USD")
price = data.get("Close")

pf = vbt.Portfolio.from_holding(price, init_cash=100)
print(pf.total_profit())
Output:
19501.10906763755
Trade a dual-SMA crossover strategy
fast_ma = vbt.MA.run(price, 10)
slow_ma = vbt.MA.run(price, 50)
entries = fast_ma.ma_crossed_above(slow_ma)
exits = fast_ma.ma_crossed_below(slow_ma)

pf = vbt.Portfolio.from_signals(price, entries, exits, init_cash=100)
print(pf.total_profit())
Output:
34417.80960086067
[!TIP] VectorBT PRO
Simulate limit orders, use leverage, and model futures with contract multipliers.
Generate 1,000 random strategies
import numpy as np

symbols = ["BTC-USD", "ETH-USD"]
data = vbt.YFData.download(symbols, missing_index="drop")
price = data.get("Close")

n = np.random.randint(10, 101, size=1000).tolist()
pf = vbt.Portfolio.from_random_signals(price, n=n, init_cash=100, seed=42)

mean_expectancy = pf.trades.expectancy().groupby(["randnx_n", "symbol"]).mean()
fig = mean_expectancy.unstack().vbt.scatterplot(xaxis_title="randnx_n", yaxis_title="mean_expectancy")
fig.show()
Output:

Test 10,000 dual-SMA window combinations
symbols = ["BTC-USD", "ETH-USD", "XRP-USD"]
data = vbt.YFData.download(symbols, missing_index="drop")
price = data.get("Close")

windows = np.arange(2, 101)
fast_ma, slow_ma = vbt.MA.run_combs(price, window=windows, r=2, short_names=["fast", "slow"])
entries = fast_ma.ma_crossed_above(slow_ma)
exits = fast_ma.ma_crossed_below(slow_ma)

pf = vbt.Portfolio.from_signals(price, entries, exits, size=np.inf, fees=0.001, freq="1D")

fig = pf.total_return().vbt.heatmap(
    x_level="fast_window", y_level="slow_window", slider_level="symbol", symmetric=True,
    trace_kwargs=dict(colorbar=dict(title="Total return", tickformat="%")))
fig.show()
Output:
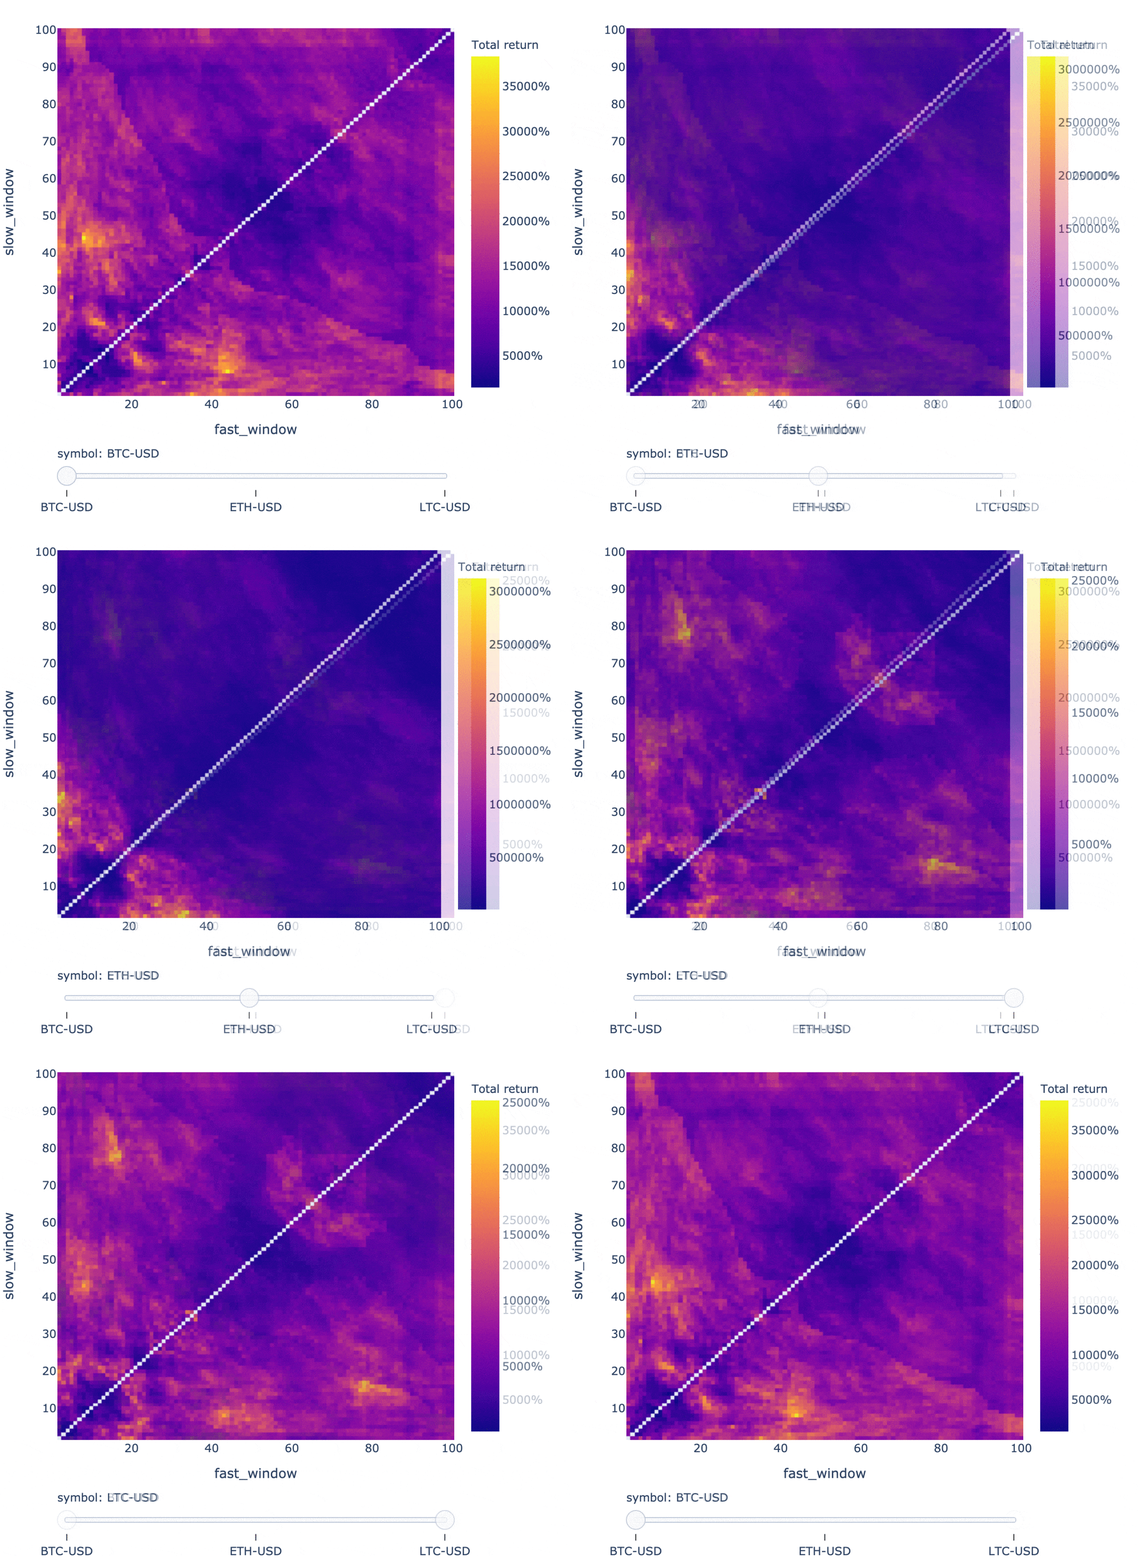
[!TIP] VectorBT PRO
Use random search to sample a large parameter grid, or conditional parameters to exclude combinations such as a fast MA window longer than the slow MA window. The cross-validation tutorial shows how to select parameters on training data and evaluate them on later periods.
Inspect any strategy configuration
print(pf[(10, 20, "ETH-USD")].stats())
Output:
Start                          2017-11-09 00:00:00+00:00
End                            2026-01-03 00:00:00+00:00
Period                                2978 days 00:00:00
Start Value                                        100.0
End Value                                    1604.093789
Total Return [%]                             1504.093789
Benchmark Return [%]                          866.094127
Max Gross Exposure [%]                             100.0
Total Fees Paid                               204.226289
Max Drawdown [%]                               70.734951
Max Drawdown Duration                 1095 days 00:00:00
Total Trades                                          81
Total Closed Trades                                   80
Total Open Trades                                      1
Open Trade PnL                                -14.232533
Win Rate [%]                                       41.25
Best Trade [%]                                120.511071
Worst Trade [%]                               -27.772271
Avg Winning Trade [%]                          27.265519
Avg Losing Trade [%]                           -9.022864
Avg Winning Trade Duration    32 days 20:21:49.090909091
Avg Losing Trade Duration      8 days 16:51:03.829787234
Profit Factor                                   1.275515
Expectancy                                     18.979079
Sharpe Ratio                                    0.861945
Calmar Ratio                                    0.572758
Omega Ratio                                      1.20277
Sortino Ratio                                   1.301377
Name: (10, 20, ETH-USD), dtype: object
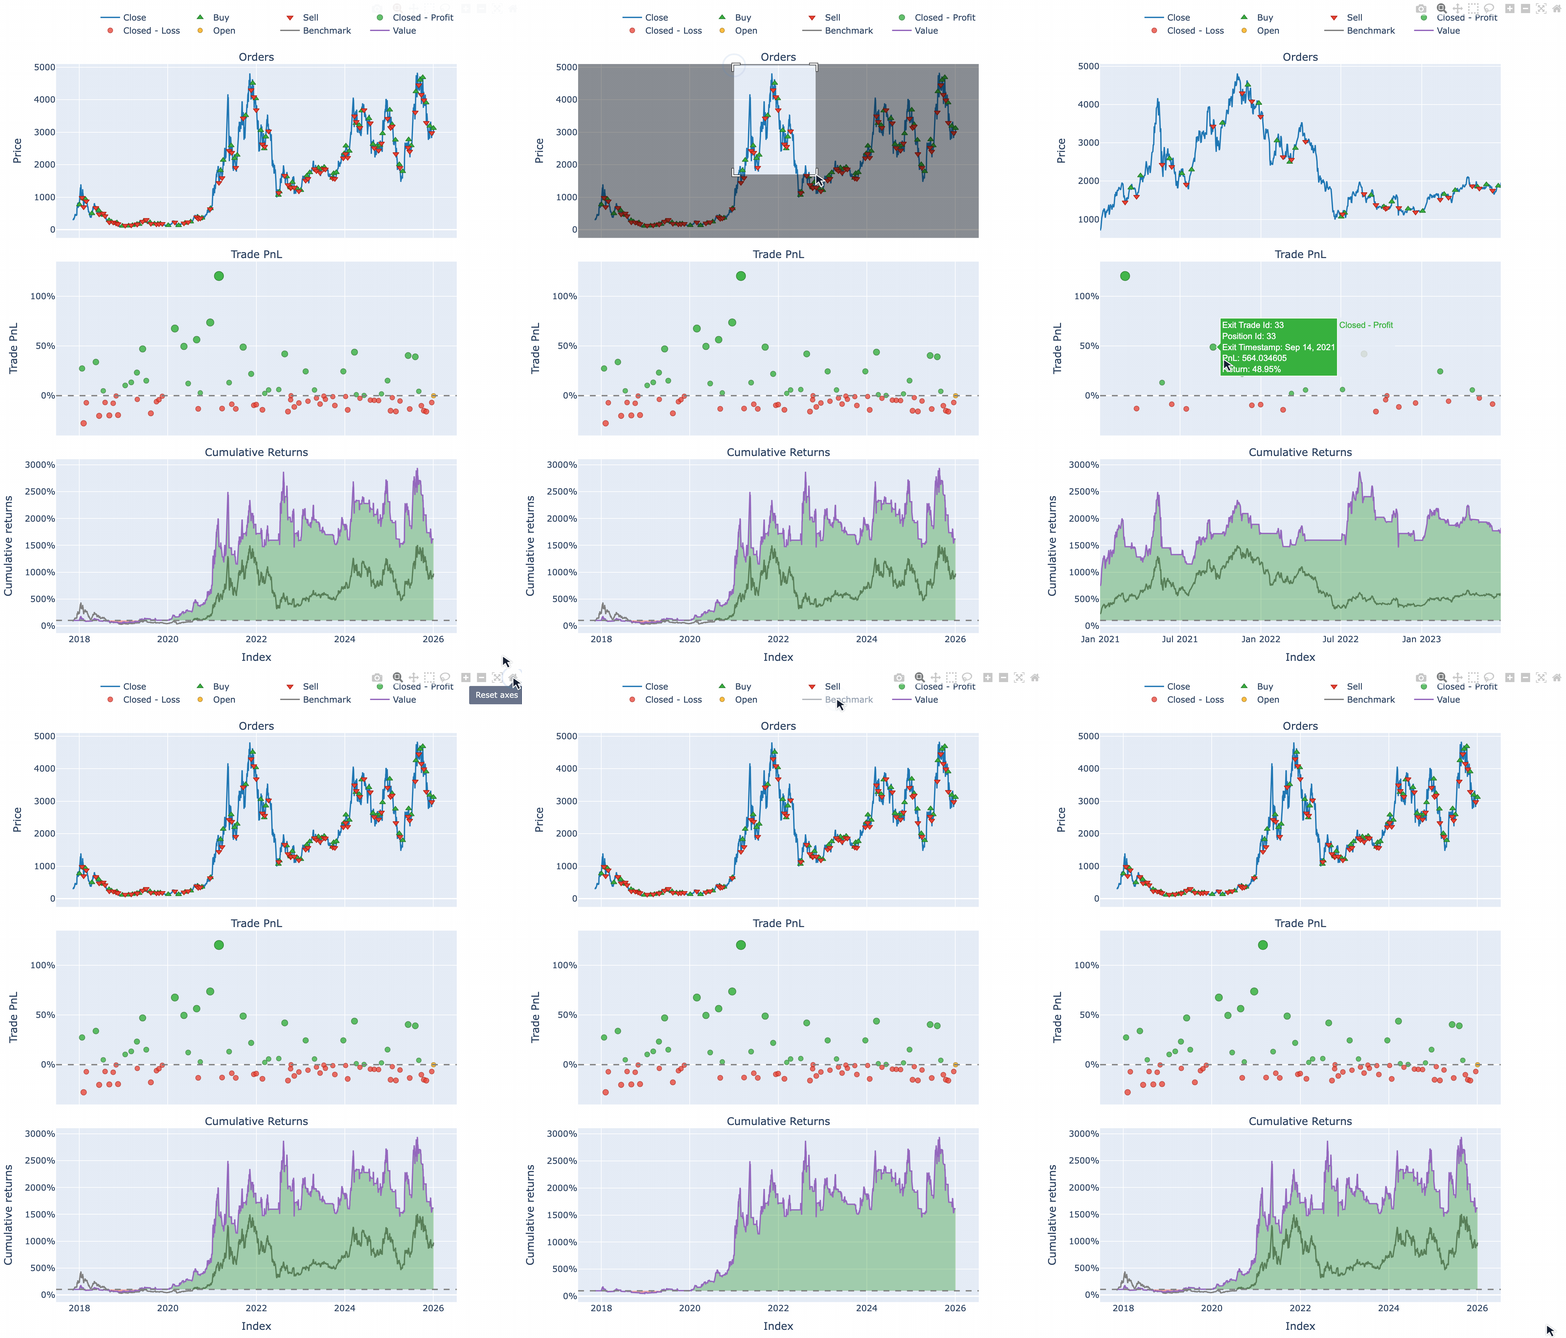
Plot any strategy configuration
pf[(10, 20, "ETH-USD")].plot().show()
Output:
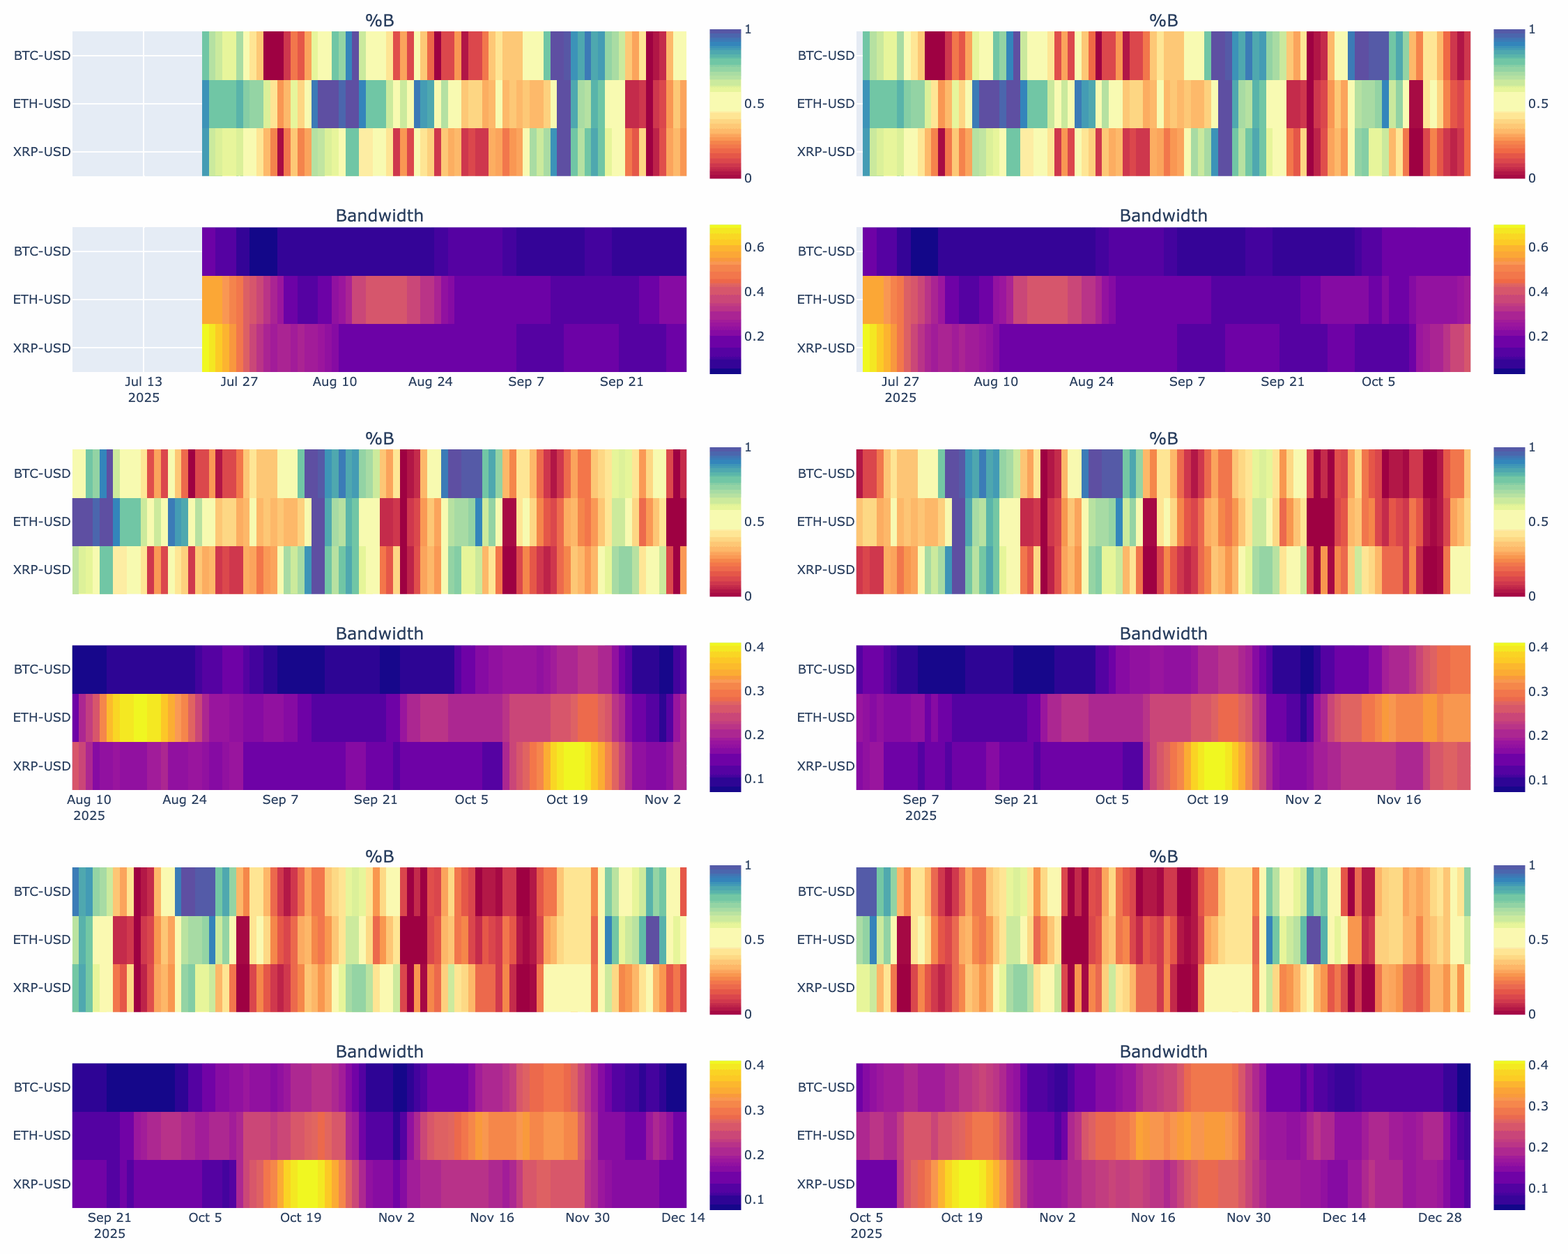
Animate Bollinger Bands across multiple symbols
VectorBT goes beyond backtesting, with tools for financial data analysis and visualization:
symbols = ["BTC-USD", "ETH-USD", "XRP-USD"]
data = vbt.YFData.download(symbols, period="6mo", missing_index="drop")
price = data.get("Close")
bbands = vbt.BBANDS.run(price)

def plot(index, bbands):
    bbands = bbands.loc[index]
    fig = vbt.make_subplots(
        rows=2, cols=1, shared_xaxes=True, vertical_spacing=0.15,
        subplot_titles=("%B", "Bandwidth"))
    fig.update_layout(showlegend=False, width=750, height=400)
    bbands.percent_b.vbt.ts_heatmap(
        trace_kwargs=dict(zmin=0, zmid=0.5, zmax=1, colorscale="Spectral", colorbar=dict(
            y=(fig.layout.yaxis.domain[0] + fig.layout.yaxis.domain[1]) / 2, len=0.5
        )), add_trace_kwargs=dict(row=1, col=1), fig=fig)
    bbands.bandwidth.vbt.ts_heatmap(
        trace_kwargs=dict(colorbar=dict(
            y=(fig.layout.yaxis2.domain[0] + fig.layout.yaxis2.domain[1]) / 2, len=0.5
        )), add_trace_kwargs=dict(row=2, col=1), fig=fig)
    return fig

vbt.save_animation(
    "bbands.gif", bbands.wrapper.index, plot, bbands,
    delta=90, step=3, fps=3, writer_kwargs=dict(loop=0))
Output:
100%|██████████| 31/31 [00:21<00:00, 1.21it/s]
Visit the website for more examples, documentation, and guides.
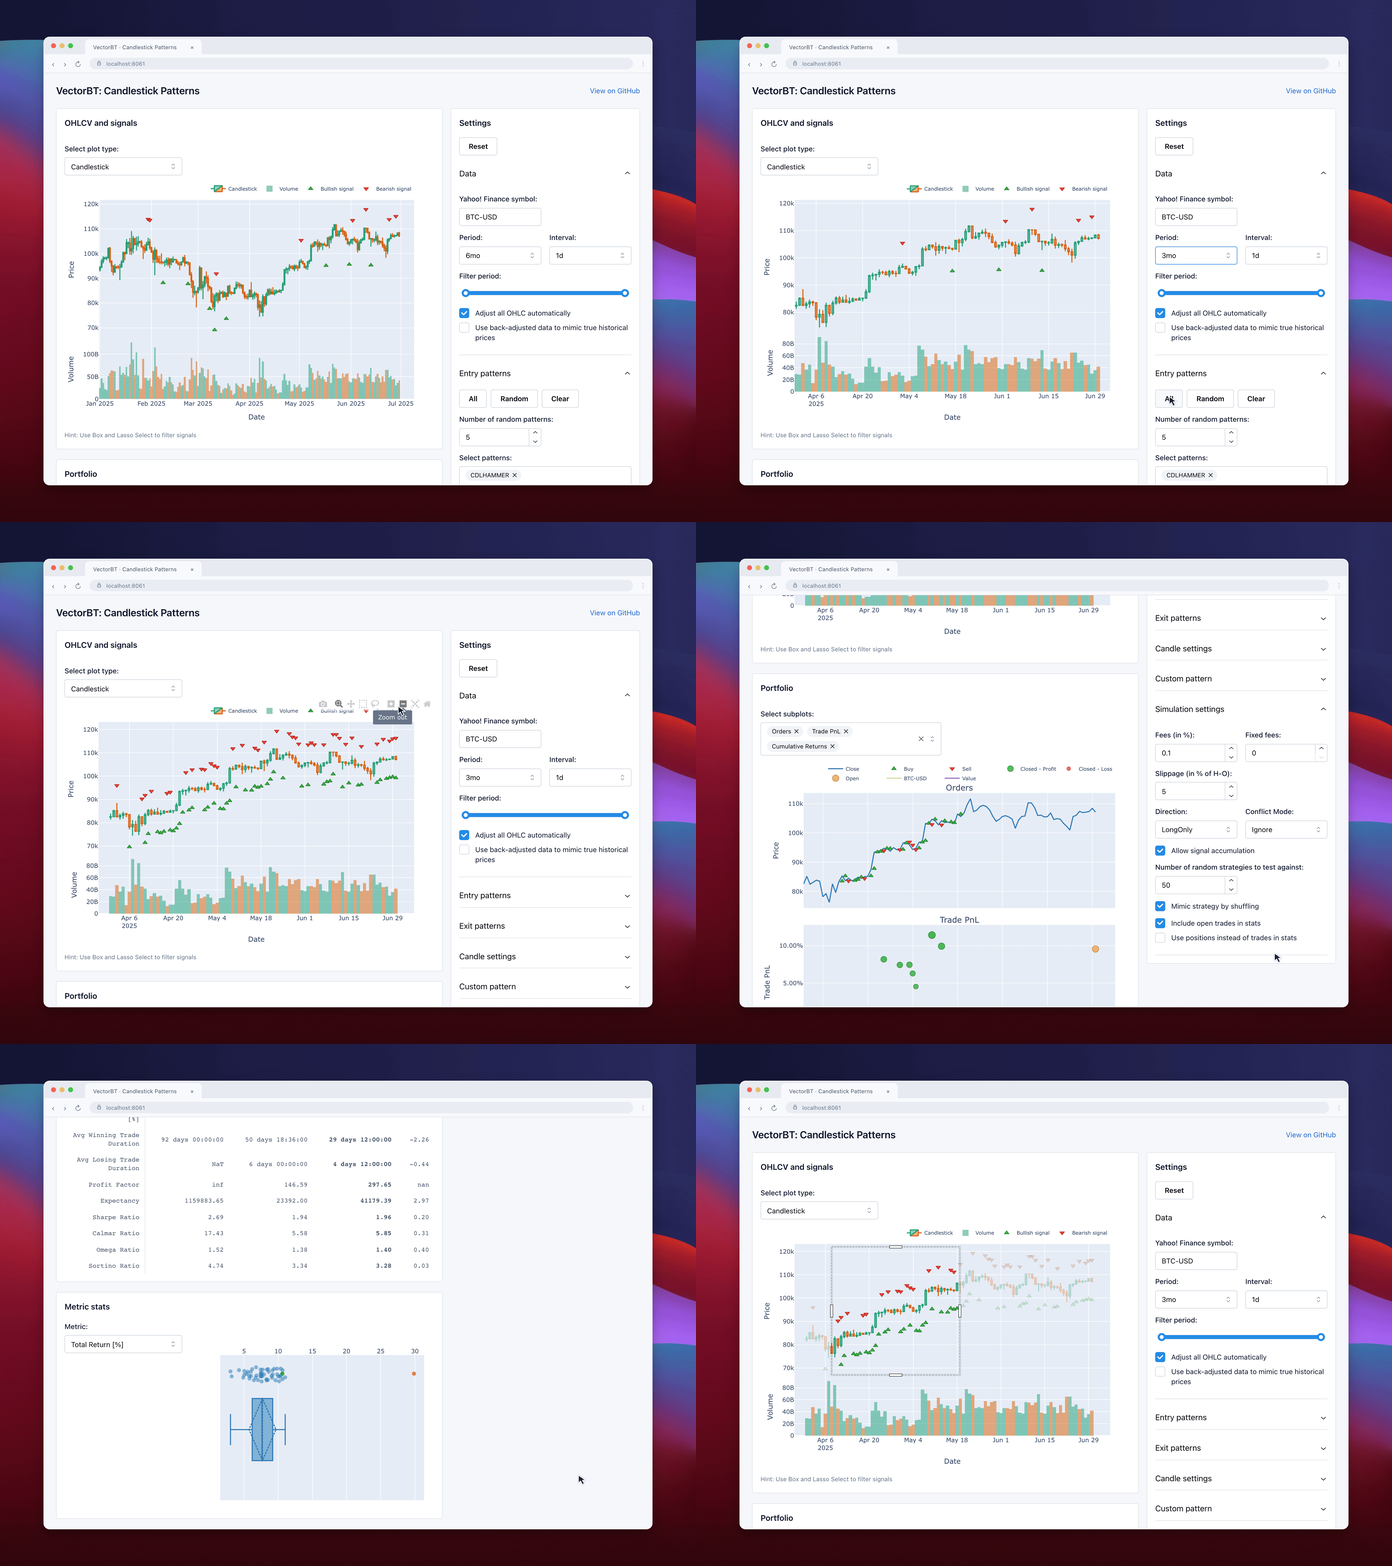
Example apps
Candlestick Patterns
Explore candlestick patterns interactively and backtest their signals with VectorBT.
Links
License
This work is fair-code distributed under the Apache 2.0 with Commons Clause license.
The source code is publicly available, and everyone (individuals and organizations) may use it for free. However, you may not sell products or services that are primarily this software.
If you have questions or want to request a license exception, please contact the author.
Installing optional dependencies may be subject to a more restrictive license.
Contributors
Thanks to everyone who has contributed to VectorBT!
Star History
Disclaimer
This software is for educational purposes only. Do not risk money you cannot afford to lose.
Use the software at your own risk. The authors and affiliates assume no responsibility for your trading results.
Explorar proyectos relacionados
tensorflow/tensorflow
Un framework de código abierto de aprendizaje automático para todos
201,505 estrellashuggingface/transformers
🤗 Transformers: el framework de definición de modelos para modelos de aprendizaje automático de vanguardia en texto, visión, audio y multimodal, tanto para inferencia como para entrenamiento.
168,815 estrellasAUTOMATIC1111/stable-diffusion-webui
Interfaz web de Stable Diffusion
165,289 estrellasComfy-Org/ComfyUI
La GUI, la API y el backend más potentes y modulares para modelos de difusión, con una interfaz de grafos y nodos. El motor de inferencia local más rápido del mundo.
146,271 estrellas