
percona/pmm has 1,135 GitHub stars and 238 forks. GitHot measured +1 stars in 24 hours and +7 in 7 days. Last checked 2026-11-10 23:58 UTC. Last push 2026-11-03.
Percona Monitoring and Management: an open source database monitoring, observability and management tool
Crecimiento de estrellas medido
- in 24h
- +1
- in 7 days
- +7
- in 15 days
- Actualización retrasada
- in 1 month
- Actualización retrasada
Cambios netos en períodos que se solapan, no totales diarios. Los datos no disponibles se dejan en blanco. Las estrellas indican interés, no calidad.
README.md
Original

Find the slow query, not just the slow server.
Open source monitoring and query analytics for MySQL, PostgreSQL, MongoDB and Valkey/Redis.
Self-hosted, and every feature is open source: there is no paid edition.





▶ Try the live demo · Quickstart · Docs · Forum
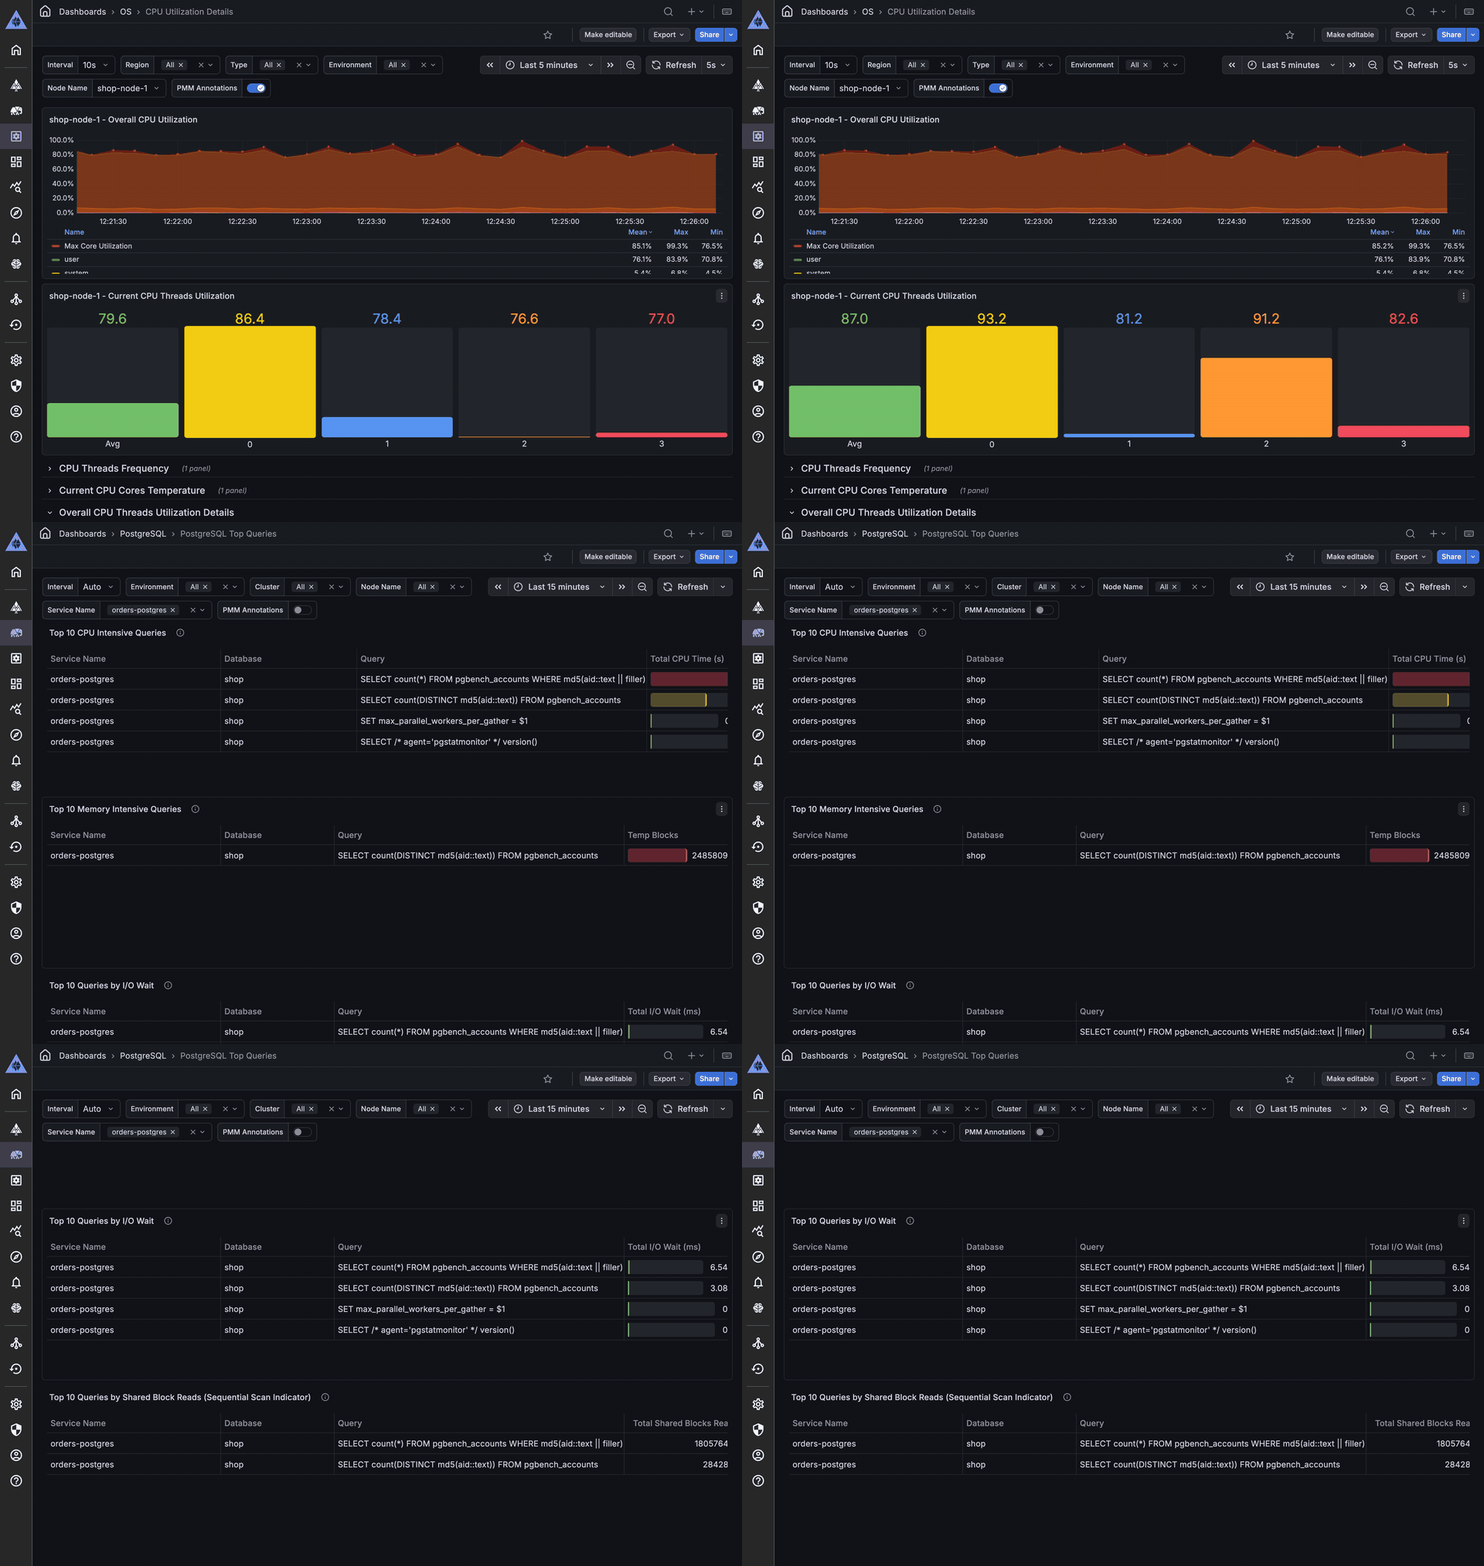
From a CPU spike on the node to the PostgreSQL query behind it.










Supported versions follow the Percona lifecycle policy.
Quickstart
1. Start PMM Server (needs Docker; the script installs it if it's missing)
curl -fsSL https://www.percona.com/get/pmm | /bin/bash
Open https://<server-ip> and log in as admin / admin, then set a new password.
2. Connect a database (on the database host; Debian/Ubuntu shown)
wget https://repo.percona.com/apt/percona-release_latest.generic_all.deb
sudo dpkg -i percona-release_latest.generic_all.deb
sudo percona-release enable pmm3-client release
sudo apt update && sudo apt install -y pmm-client

sudo pmm-admin config --server-insecure-tls --server-url=https://admin:<password>@<server-ip>:443
sudo pmm-admin add mysql --username=pmm --password=<pass> --query-source=perfschema
This assumes a fresh server with its self-signed certificate. For production, use a trusted certificate (drop --server-insecure-tls) and register with a service account token instead of the admin password.
Open Query Analytics and your queries appear within a minute. The pmm database user needs these privileges. Guides for RHEL, Docker, PostgreSQL, MongoDB, Valkey/Redis, Amazon RDS/Aurora, Azure and Google Cloud are in the full quickstart.
Other ways to run PMM Server: Docker · Podman · Kubernetes (Helm) · AWS Marketplace
Product tour
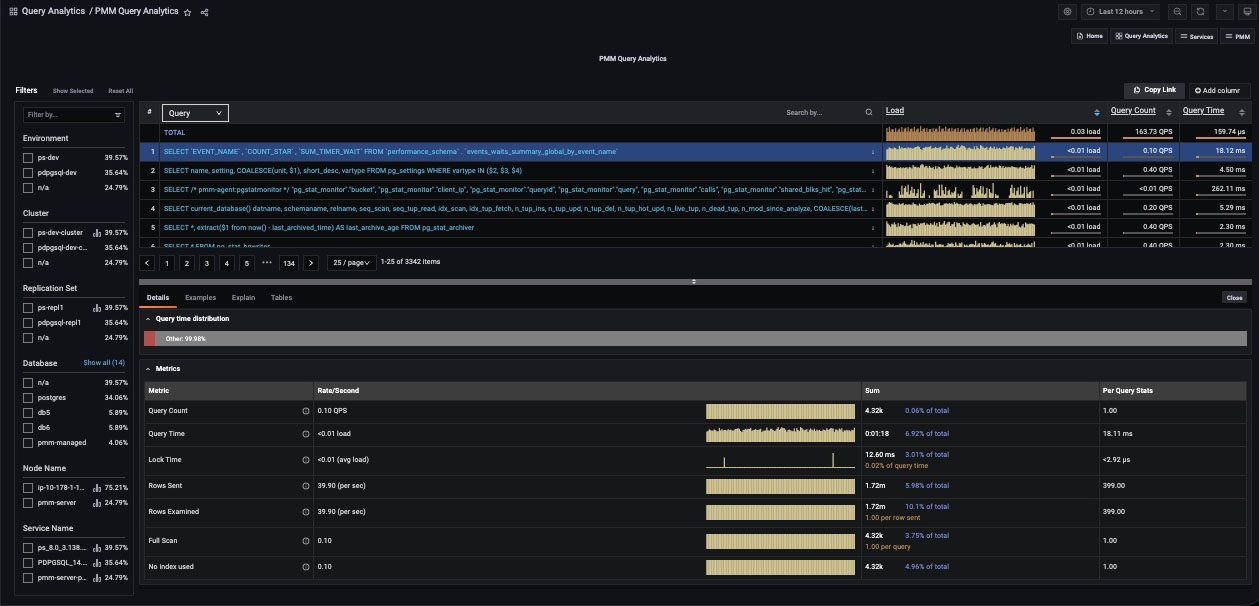
Query Analytics: find the queries that cost the most
Every query ranked by load, with examples, EXPLAIN plans and table stats. See the Query Analytics docs.
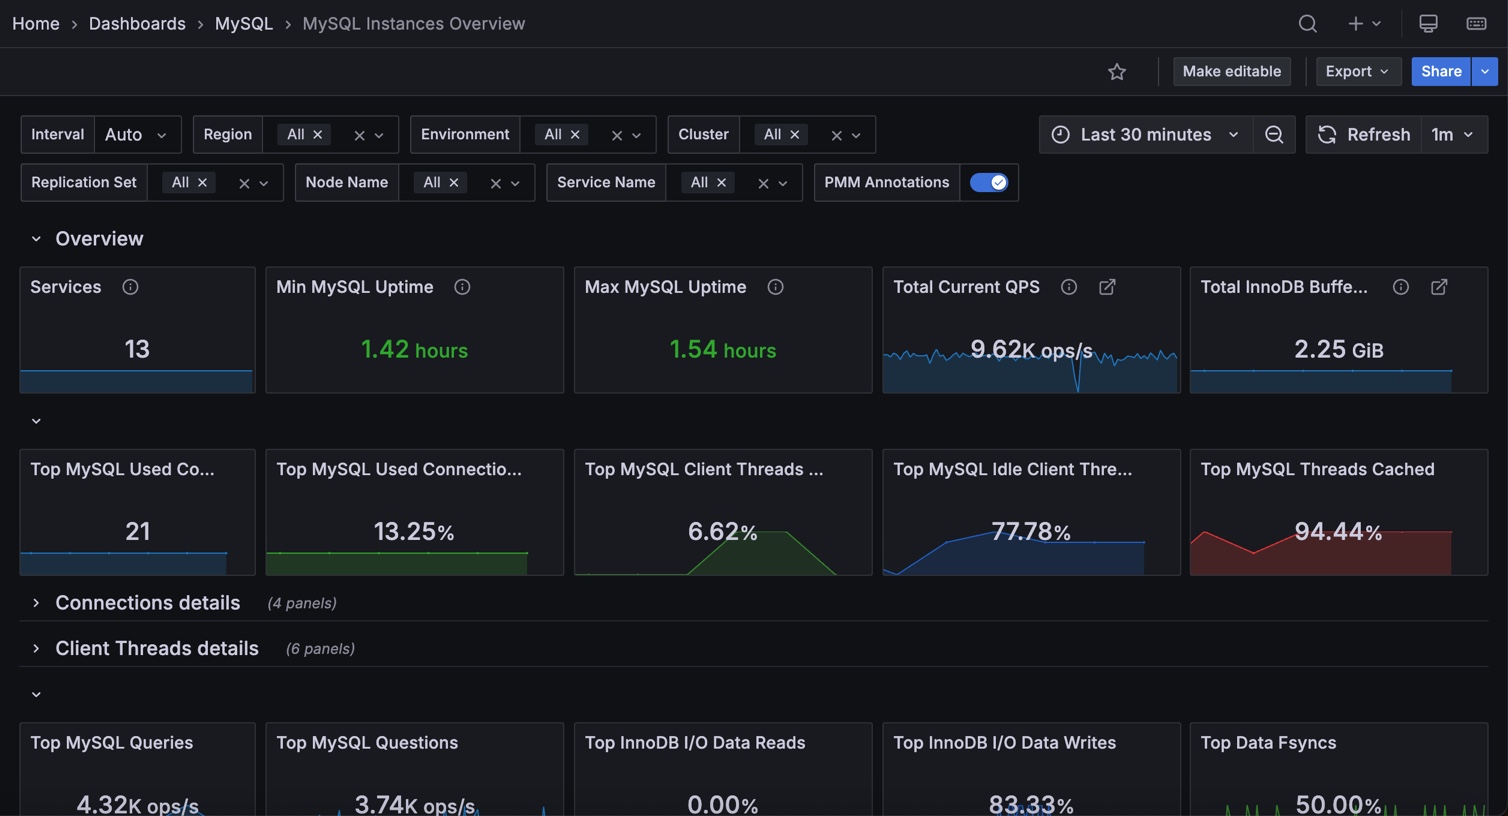
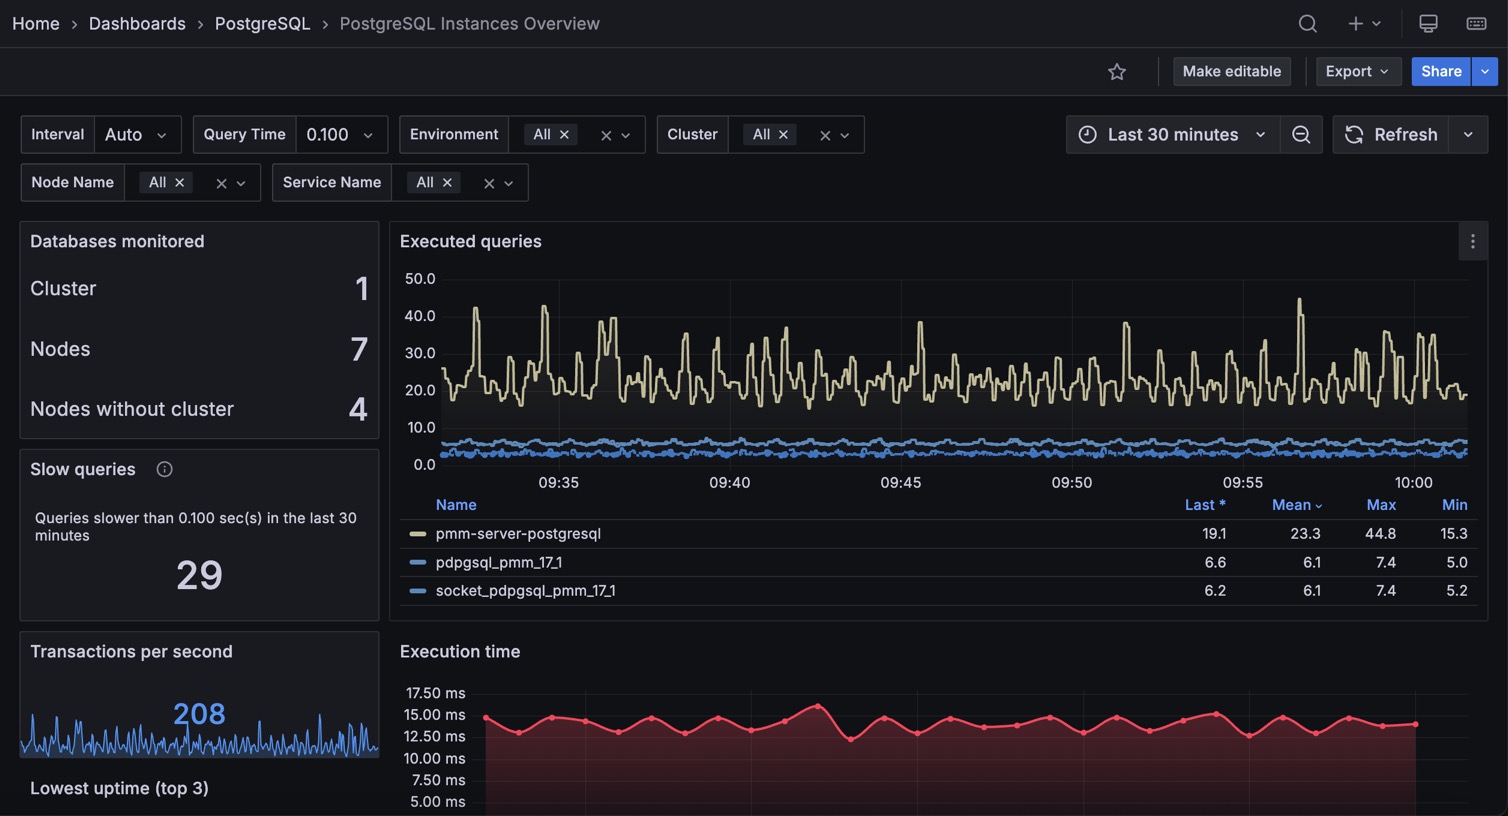
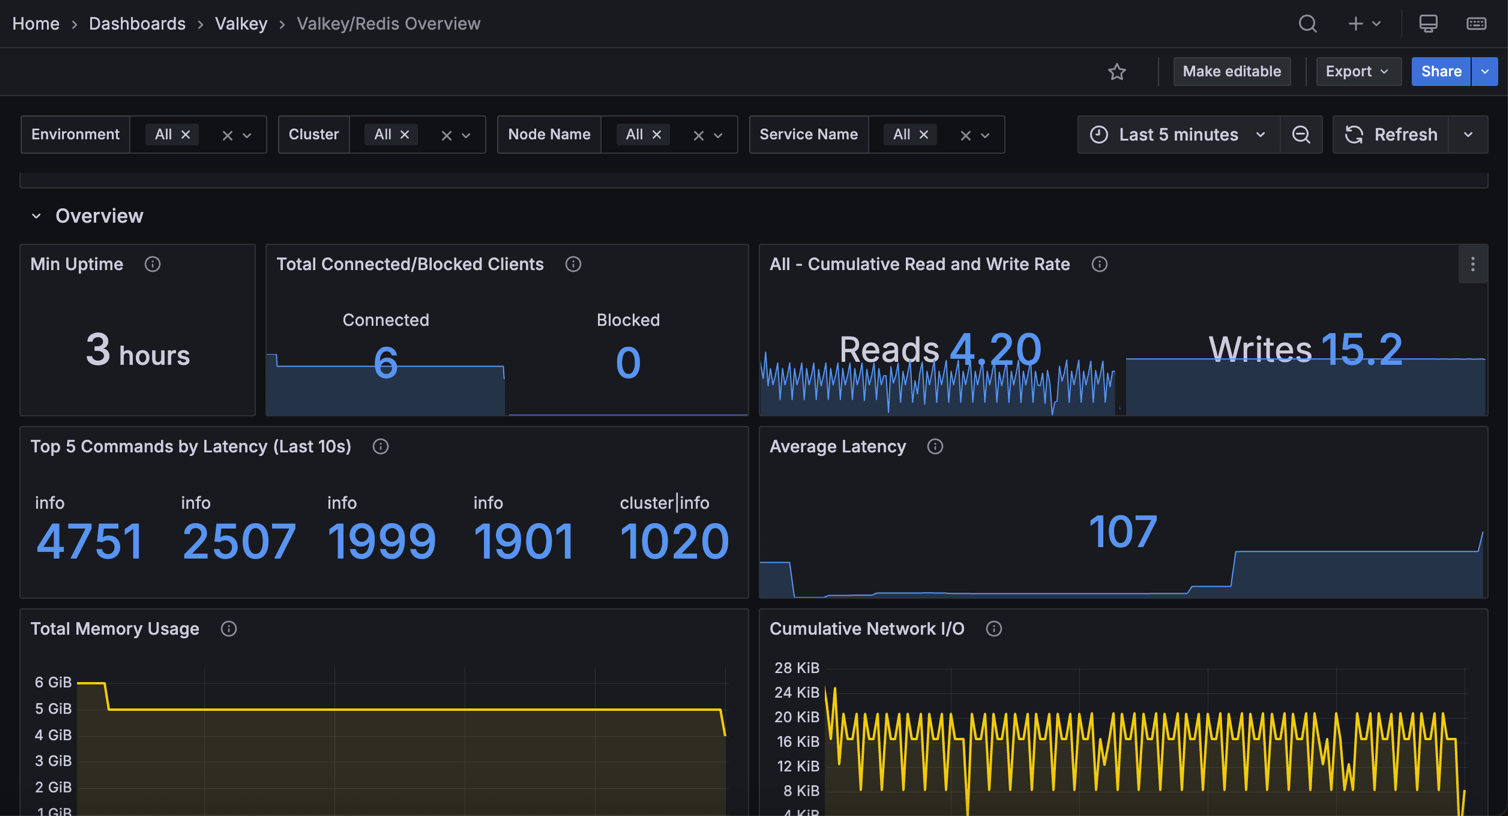
Dashboards for every layer: node → instance → query
For MySQL, PostgreSQL, MongoDB, Valkey/Redis, ProxySQL and HAProxy. Built on Grafana.
| MySQL | PostgreSQL | Valkey / Redis |
|---|---|---|
 |
 |
 |
Advisors: automatic checks for security, configuration and performance

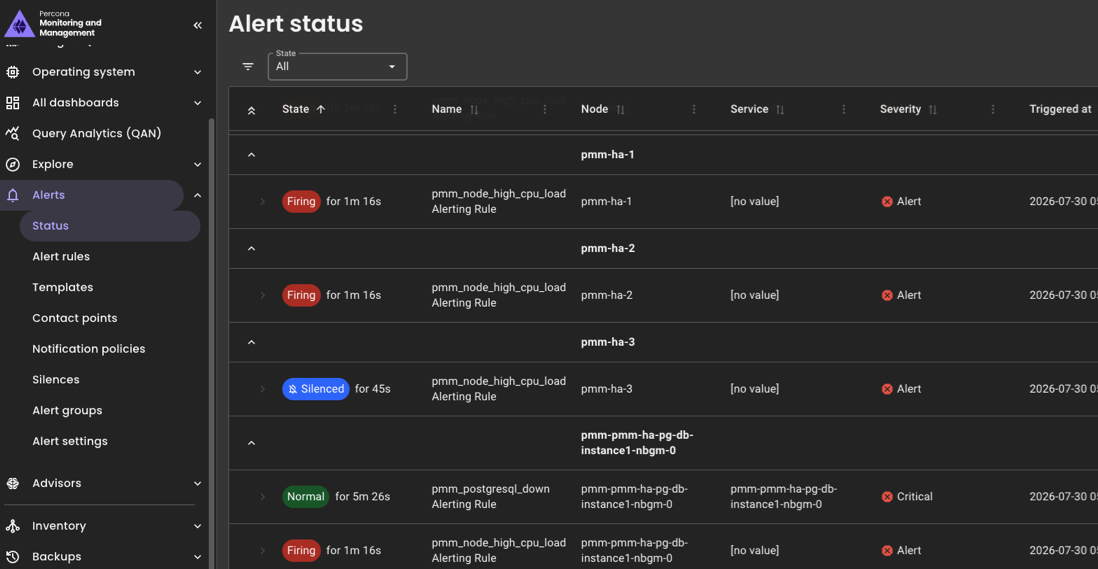
Alerting: ready-made templates, any Grafana contact point
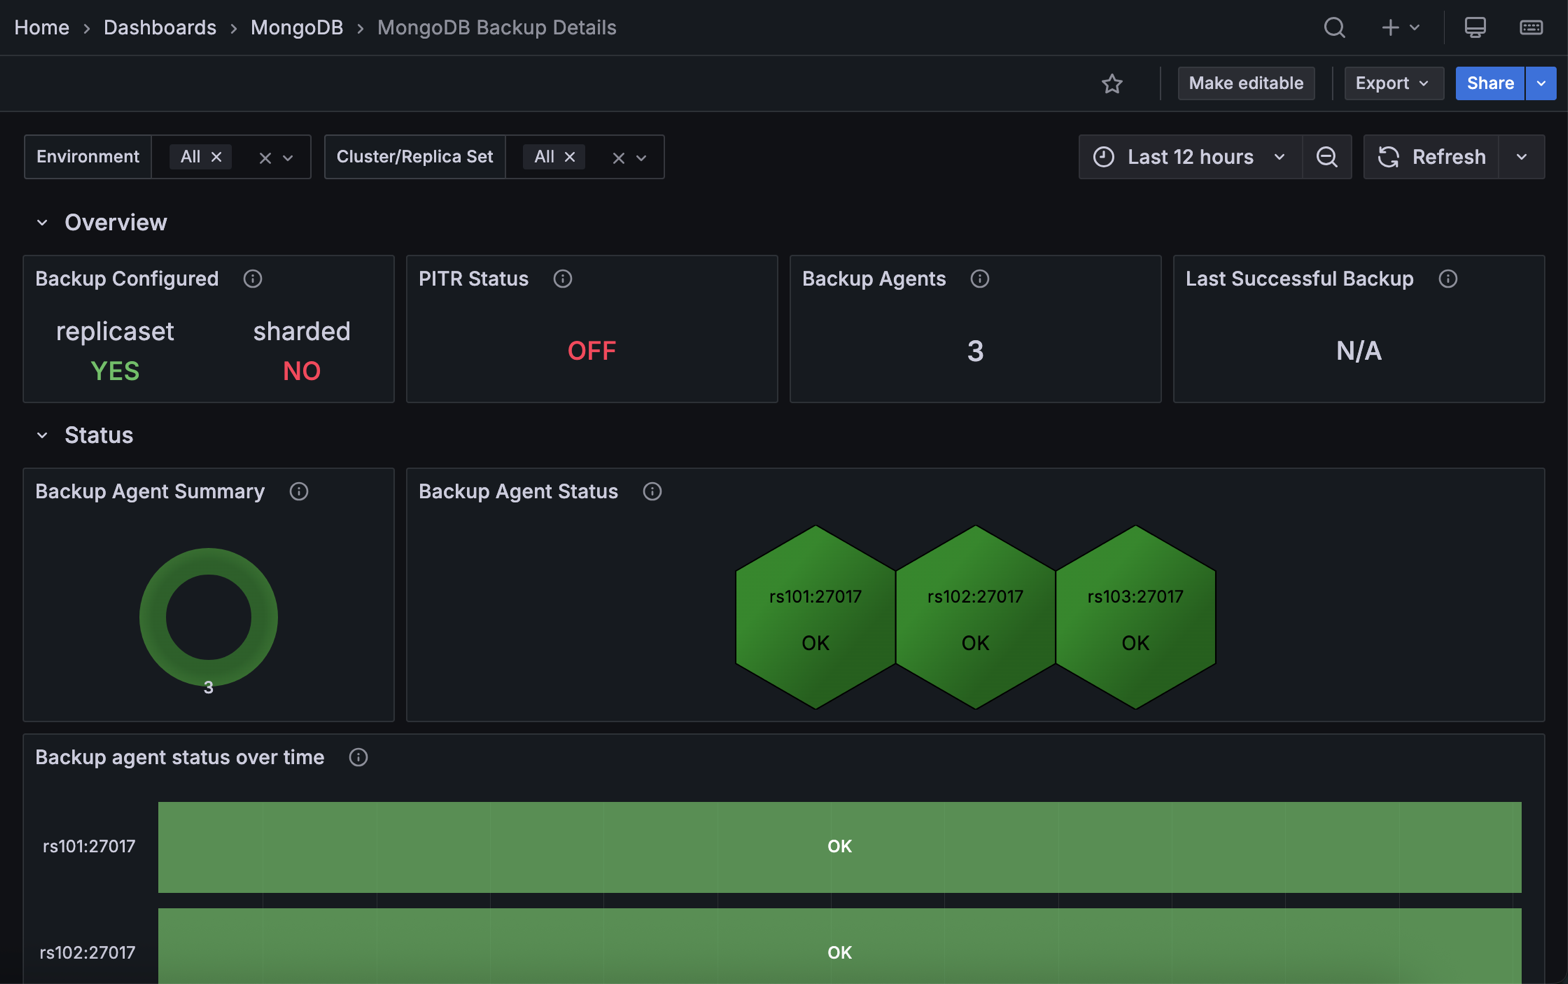
Backup and restore: MongoDB with point-in-time recovery, MySQL in Technical Preview
Runs where your databases run: bare metal, VMs, Kubernetes, Amazon RDS/Aurora, Azure and Google Cloud.
Why PMM?
| PMM | Prometheus + Grafana, self-built | Hosted DB monitoring | |
|---|---|---|---|
| Per-query analytics | Built in | Build it yourself | Yes |
| DB dashboards, advisors, alert templates | Built in | Assemble by hand | Yes |
| Where your data lives | Your servers | Your servers | Vendor cloud |
| Cost | Free, open source | Free + your time | Per host, per month |
Compared with tools you know
Prometheus + exporters
Good if you want to assemble it yourself. PMM ships the exporters, curated dashboards, query analytics, advisors and alert templates as one install with one upgrade path.
Datadog Database Monitoring
SaaS, priced per database host. PMM is self-hosted, so query text and samples stay on your servers.
pganalyze
Commercial and PostgreSQL only. PMM covers PostgreSQL, MySQL, MongoDB and Valkey in one tool.
How it works
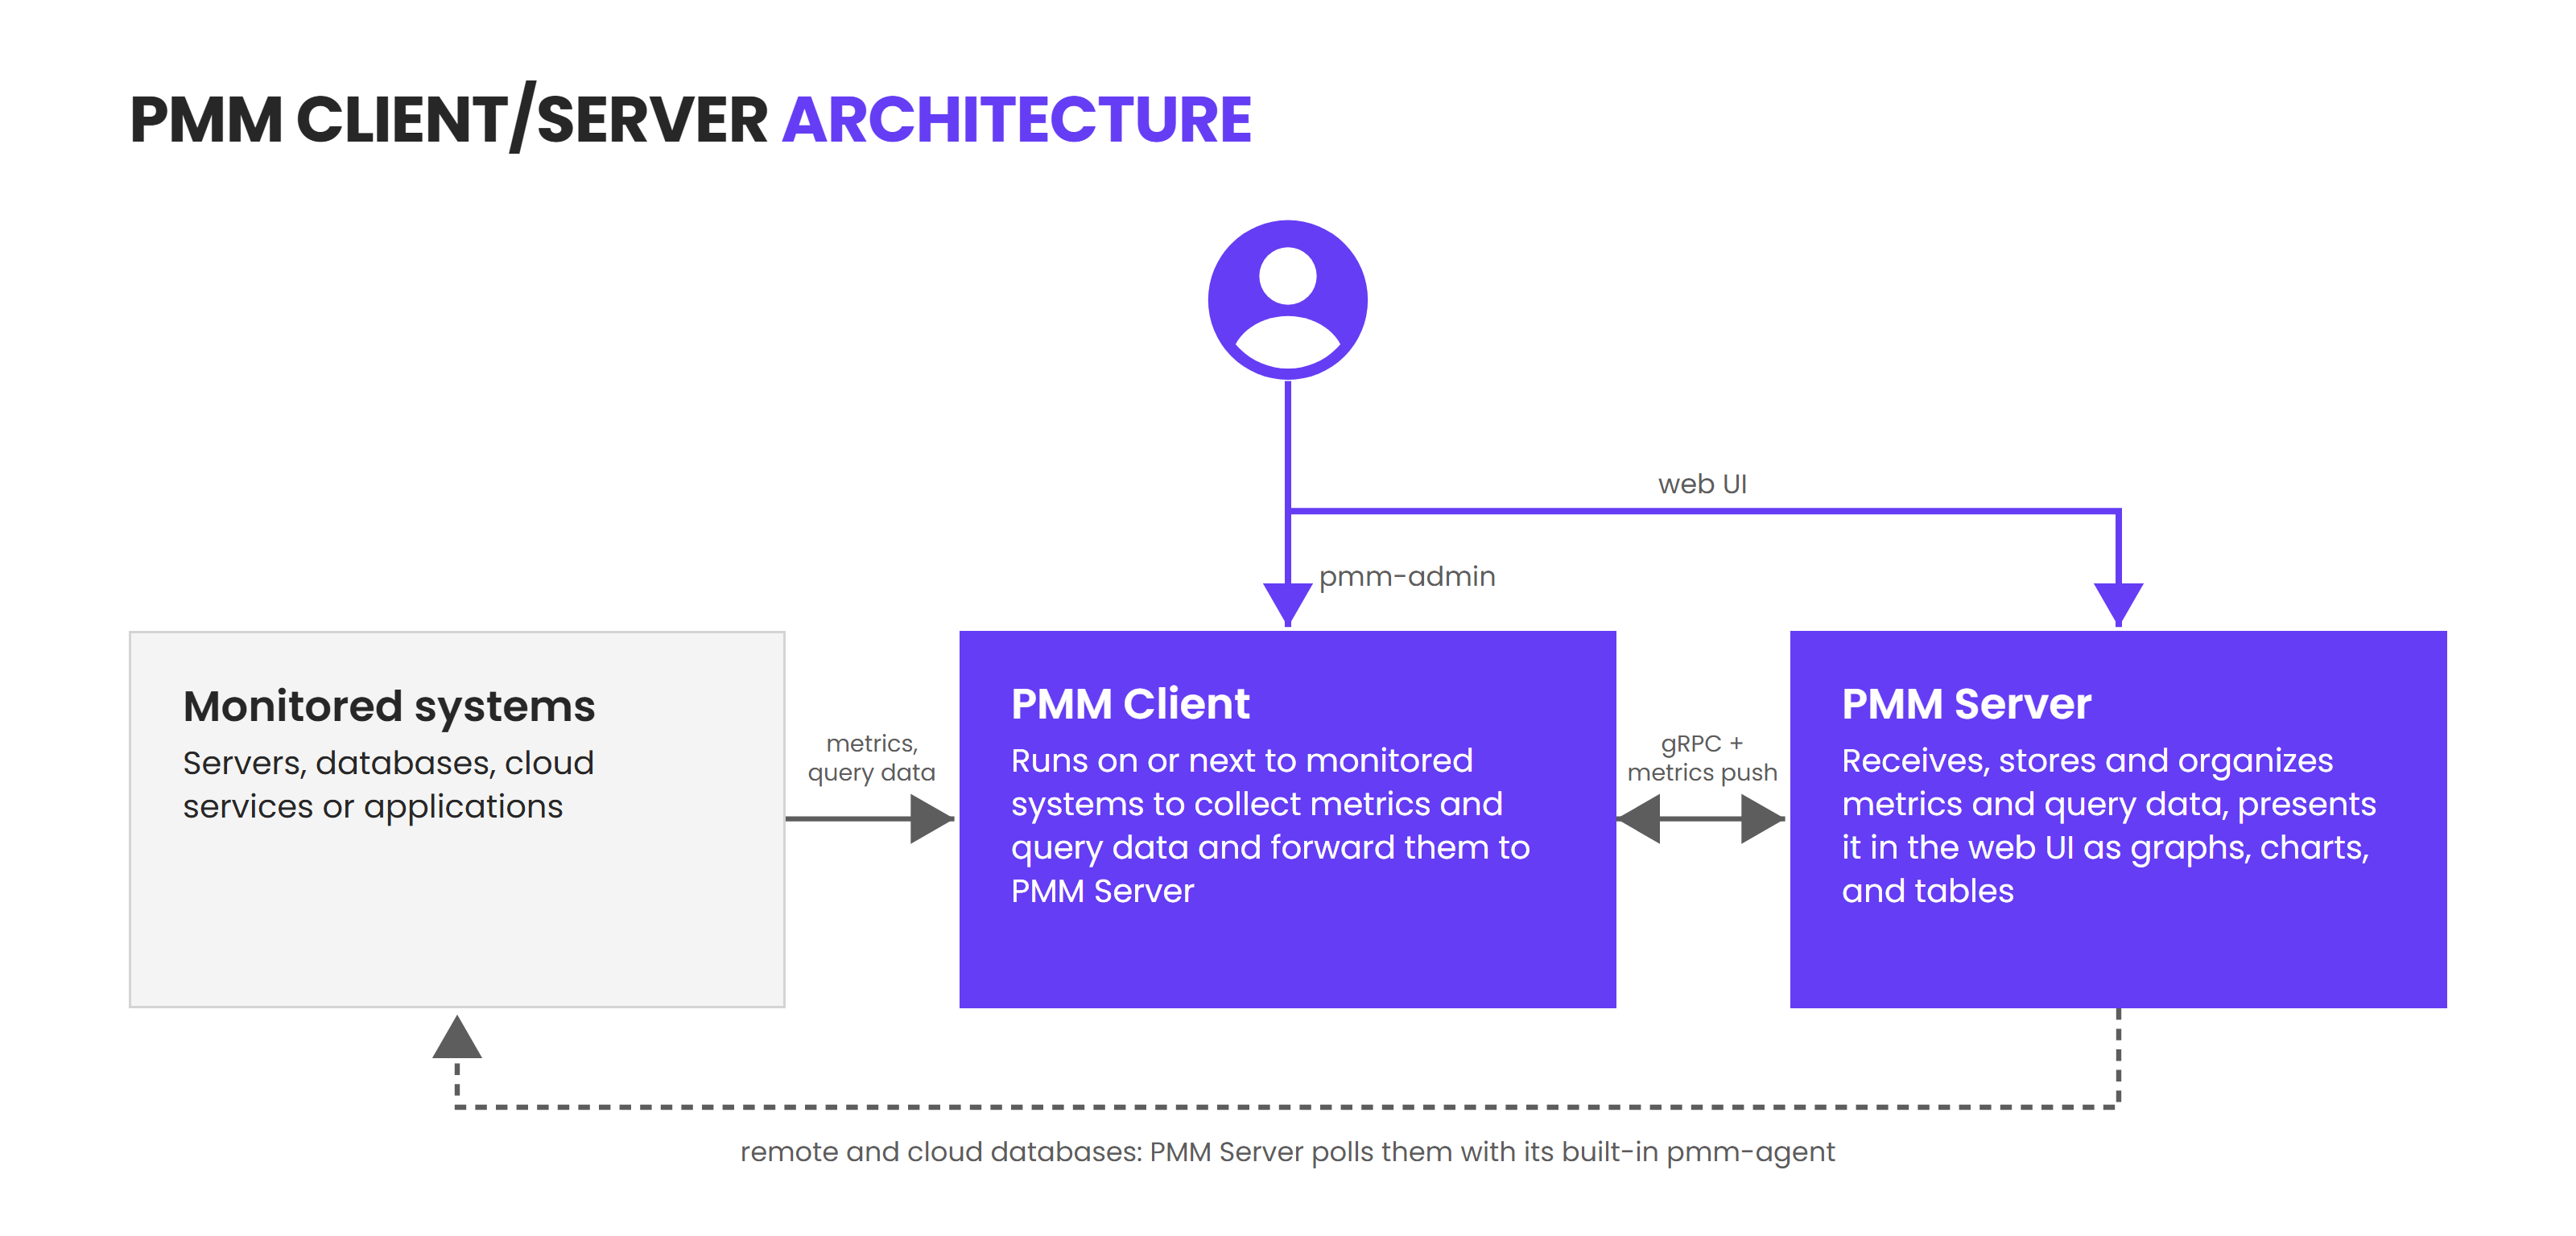
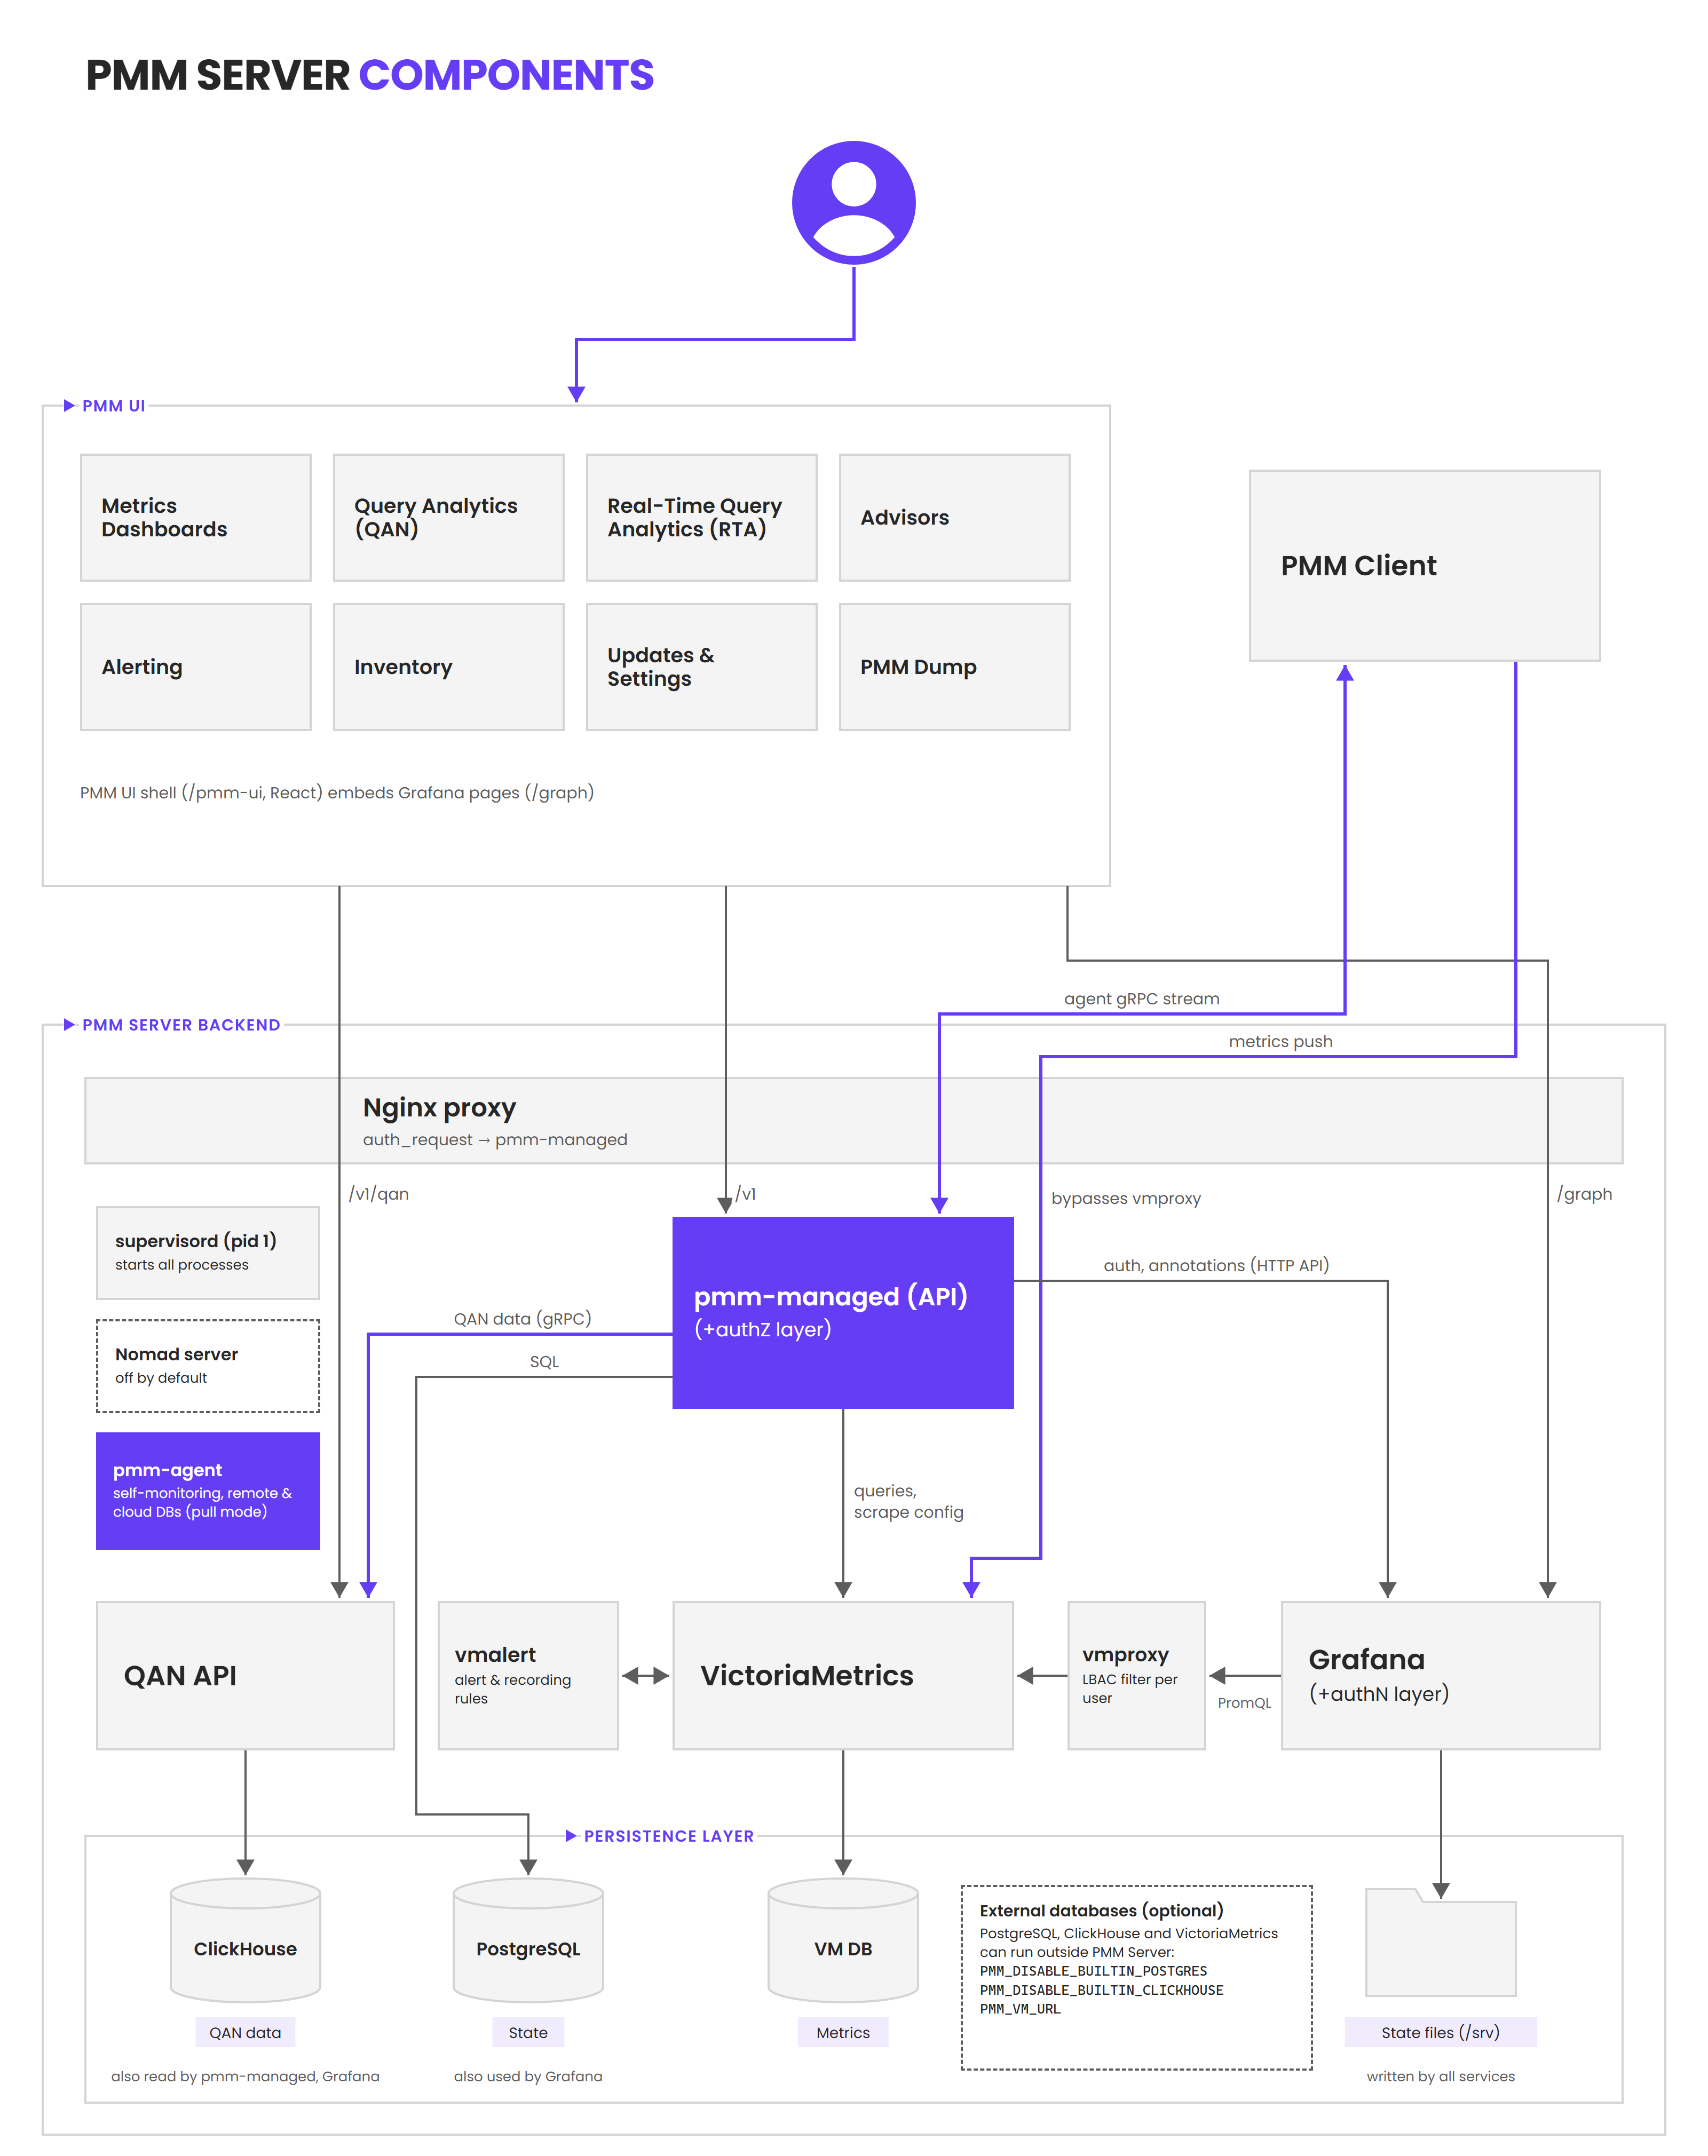
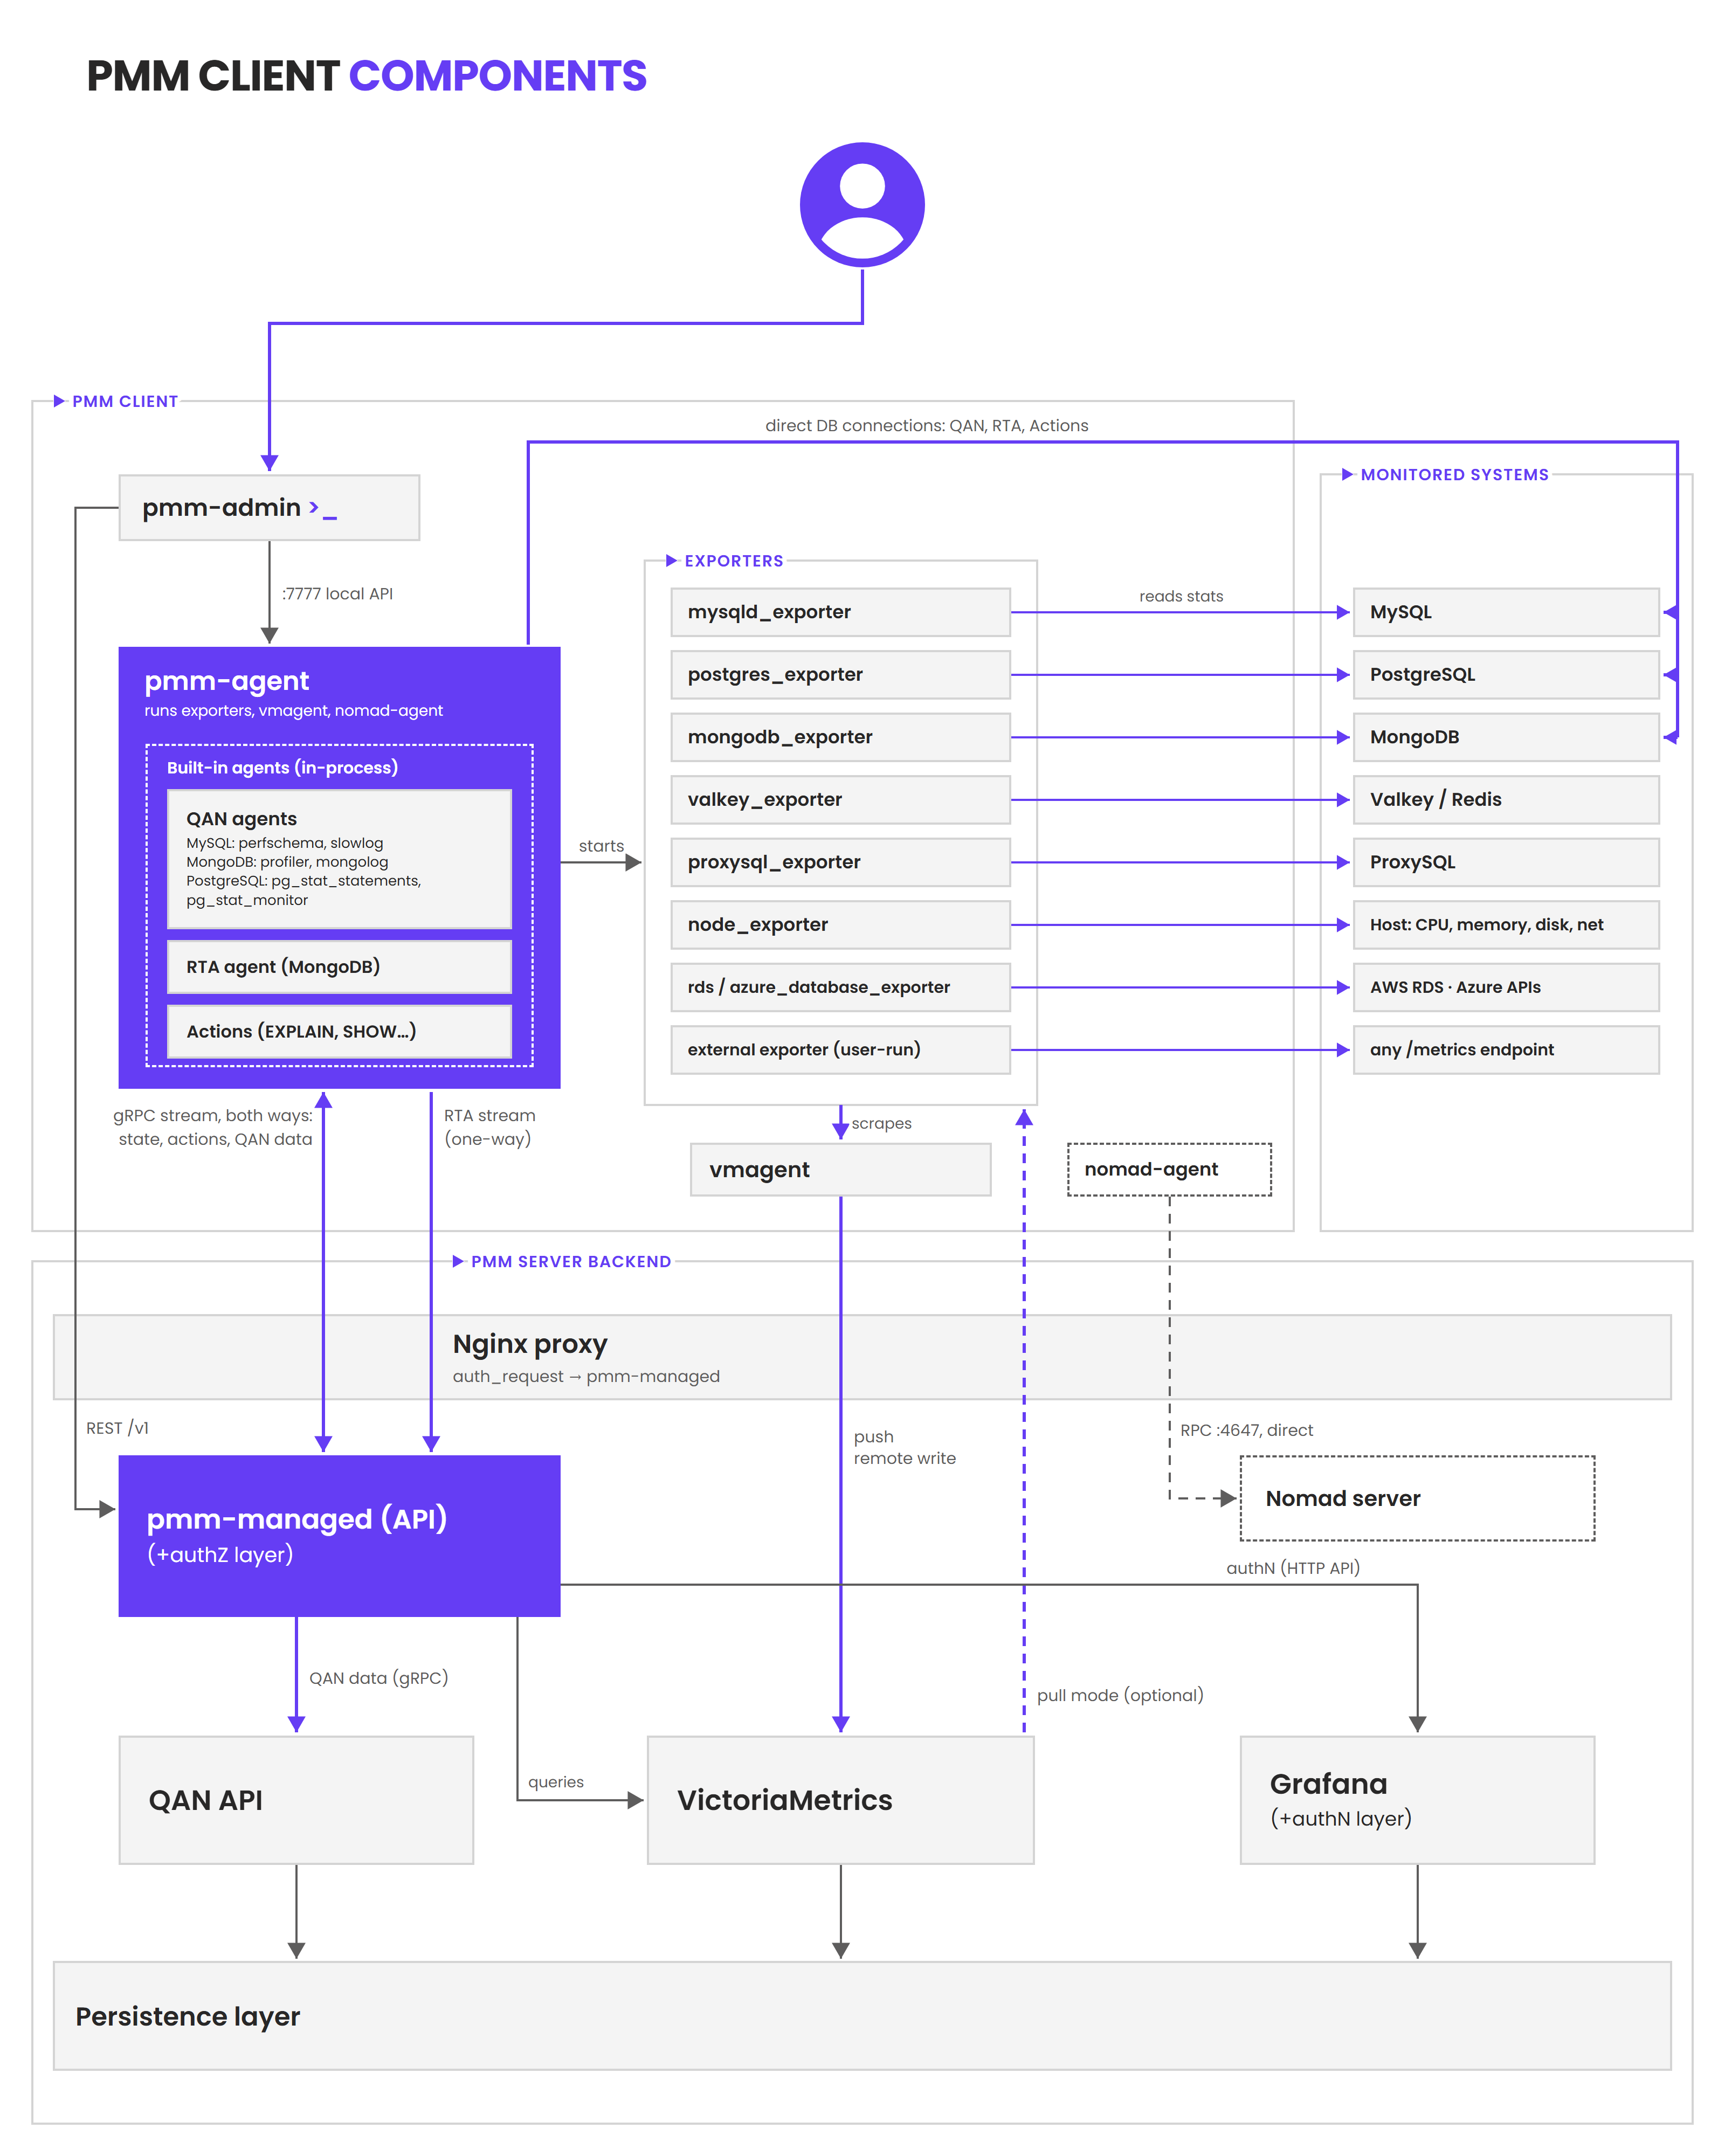
PMM Server (Grafana, VictoriaMetrics, ClickHouse, PostgreSQL) stores metrics and query data. PMM Client (pmm-agent plus exporters) runs next to each database and sends them. Details are in the architecture reference.
Architecture diagrams
FAQ
How is PMM different from Prometheus + Grafana?
PMM is built on Grafana and VictoriaMetrics (PromQL-compatible) and adds the database parts: exporters configured for you, query analytics stored in ClickHouse, curated dashboards, advisors, alert templates and backups. It installs and upgrades as one product.
Will it slow down my database?
The client reads statistics the database already collects (Performance Schema or the slow log, pg_stat_statements or pg_stat_monitor, the MongoDB profiler or log), and you choose the query source for each service. See choosing a query source.
Can I monitor Amazon RDS, Aurora or Azure without access to the host?
Yes. Add the instance from the PMM web interface; nothing is installed on the database host. For RDS, PMM also reads Enhanced Monitoring metrics through the AWS API. See Connect Amazon RDS.
Is any feature paid?
No. Every feature is in the open source release. Percona sells support, not features.
How do I upgrade?
PMM Server: pull the new image for Docker or Podman, or run helm upgrade for Helm. PMM Client: your package manager. See the upgrade guide.
Community and support
- Questions and ideas: Percona Forum
- Bugs: PMM on Jira. See how to report a bug.
- Contributing: CONTRIBUTING.md · good first issues
- Commercial support: Percona Support for production deployments
If PMM saves you time, give the repo a ⭐. It helps other DBAs find it.
License
- PMM Server: GNU AGPLv3
- PMM Client: Apache 2.0
- PMM Documentation: GNU AGPLv3
Explorar proyectos relacionados
Asabeneh/30-Days-Of-Python
El reto de programación 30 Days of Python es una guía paso a paso para aprender el lenguaje de programación Python en 30 días. Este reto puede llevar más de 100 días. Sigue tu propio ritmo. Estos vídeos también pueden ayudarte: https://www.youtube.com/channel/UC7PNRuno1rzYPb1xLa4yktw
78,560 estrellasgrafana/grafana
Plataforma abierta y componible de observabilidad y visualización de datos. Visualiza métricas, registros y trazas de múltiples fuentes, como Prometheus, Loki, Elasticsearch, InfluxDB, Postgres y muchas más.
77,830 estrellasredis/redis
Para los desarrolladores que crean aplicaciones en tiempo real basadas en datos, Redis es la opción preferida, la más rápida y la de más funciones como caché, servidor de estructuras de datos y motor de consultas de documentos y vectores.
77,395 estrellasapache/superset
Apache Superset es una plataforma de visualización y exploración de datos.
75,473 estrellas