
metricsgraphics/metrics-graphics
metricsgraphics/metrics-graphics has 7,389 GitHub stars and 460 forks. GitHot measured -1 stars in 24 hours, -3 in 7 days, and -1 in 15 days. Last checked 2026-11-21 12:58 UTC. Last push 2022-05-31.
Crecimiento de estrellas medido
- in 24h
- -1
- in 7 days
- -3
- in 15 days
- -1
- in 1 month
- Recopilando historial
Cambios netos en períodos que se solapan, no totales diarios. Los datos no disponibles se dejan en blanco. Las estrellas indican interés, no calidad.
Acerca de
Una biblioteca optimizada para crear gráficos y diseños de datos concisos y rigurosos.
Creación y multimediaREADME.md
Original
MetricsGraphics is a library built for visualizing and laying out time-series data. At around 15kB (gzipped), it provides a simple way to produce common types of graphics in a principled and consistent way. The library currently supports line charts, scatterplots and histograms, as well as features like rug plots.
Example
All you need to do is add an entry node to your document:
<div id="chart"></div>
Then, use the id to mount the chart:
import LineChart from 'metrics-graphics'

new LineChart({
  data, // some array of data objects
  width: 600,
  height: 200,
  target: '#chart',
  area: true,
  xAccessor: 'date',
  yAccessor: 'value'
})
That's it!
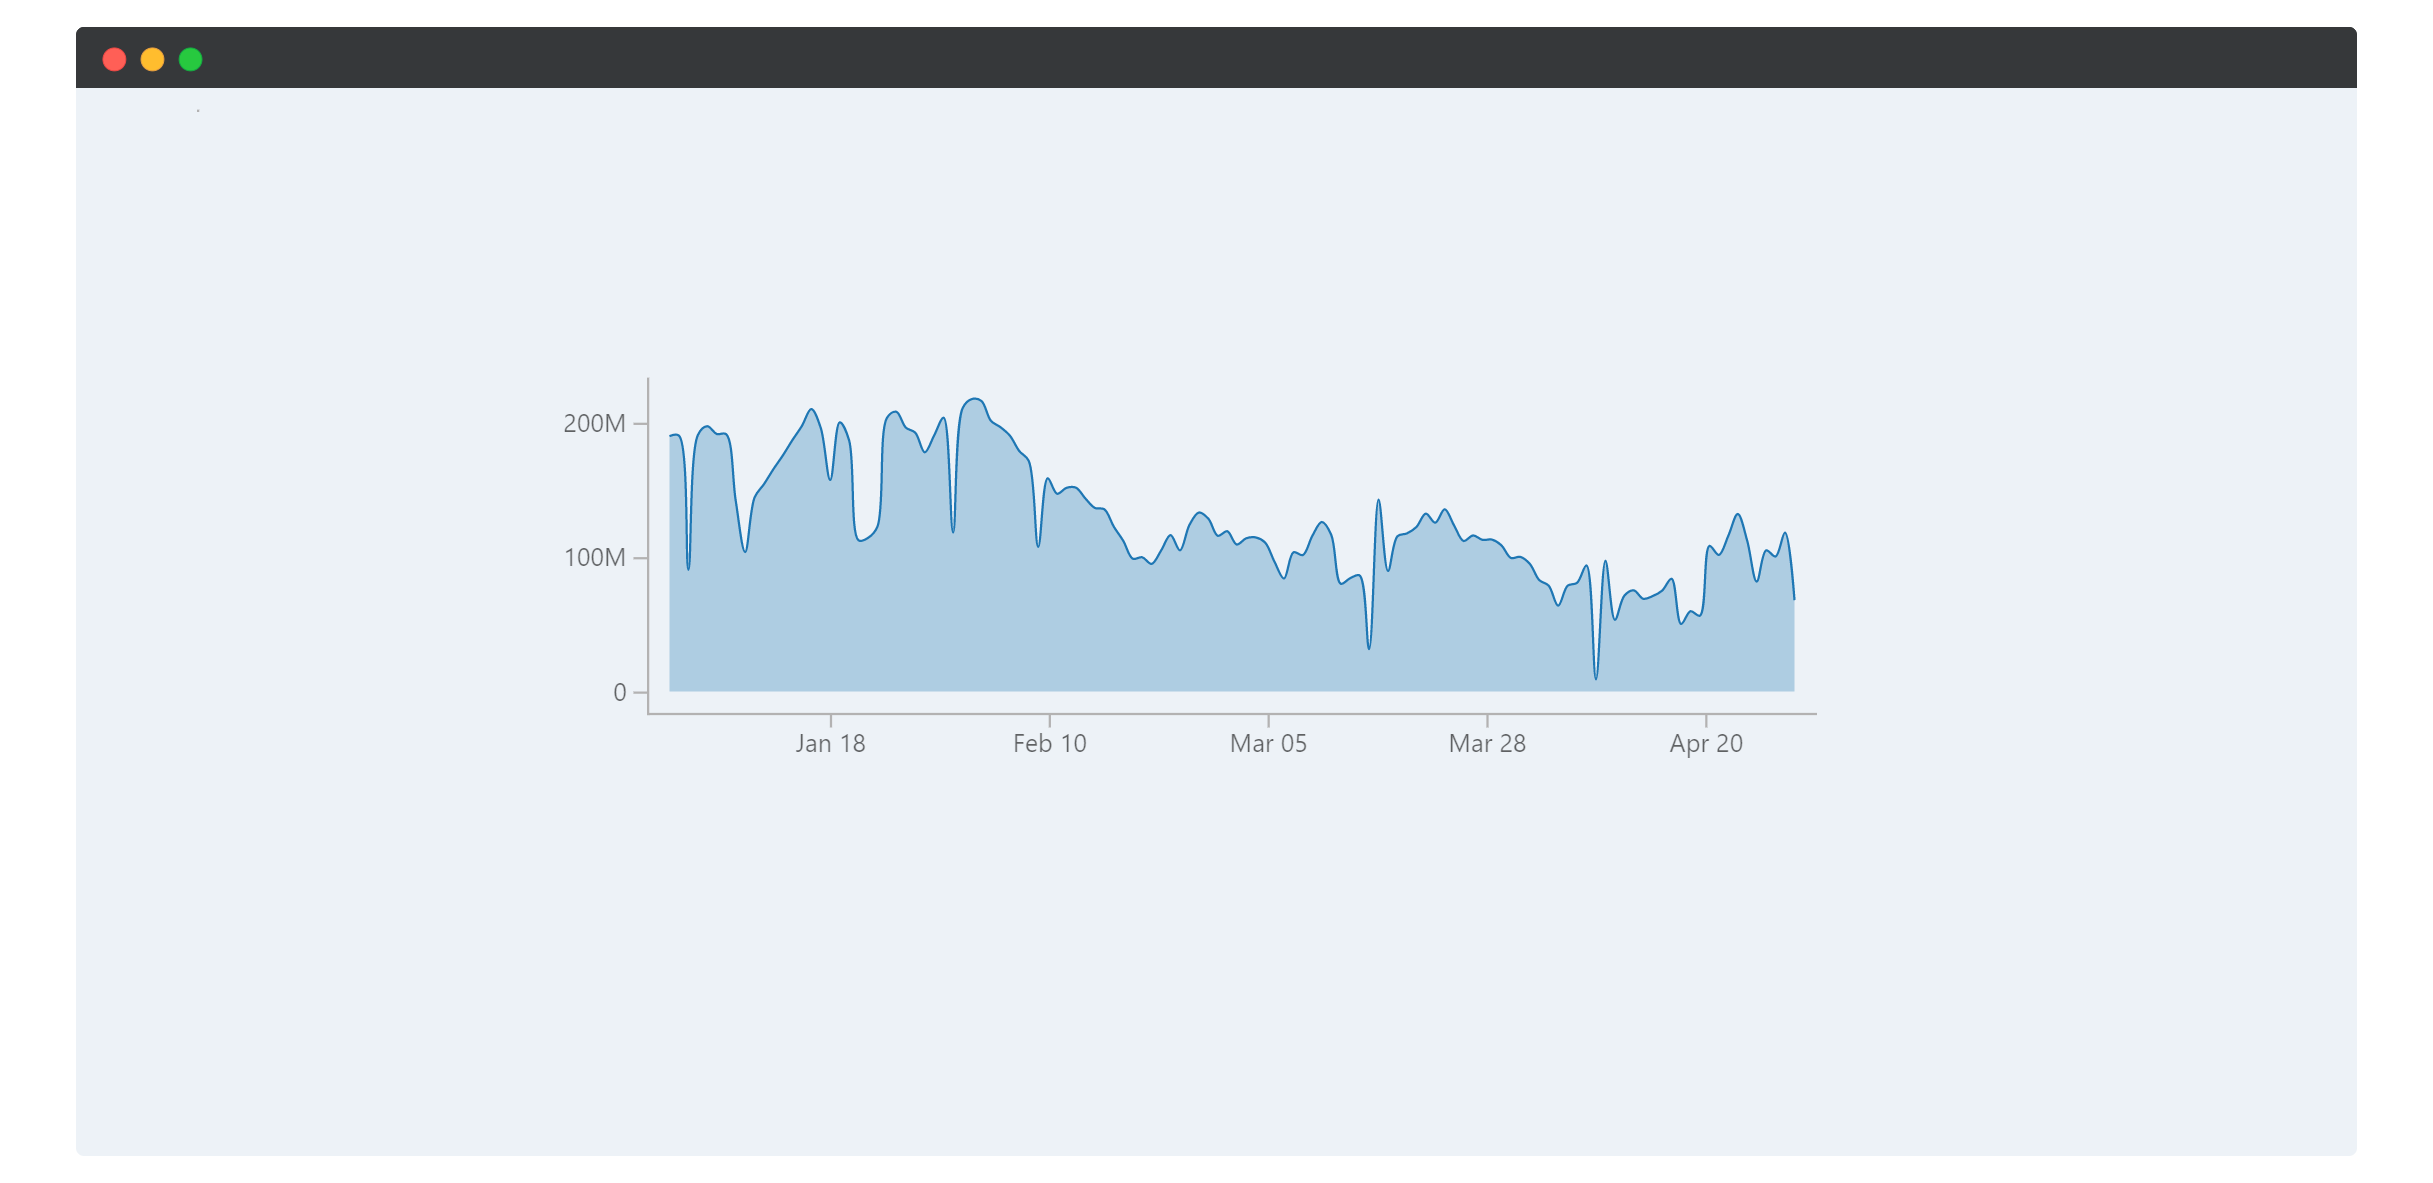
The raw data for this example can be found here
Documentation
If you want to use MetricsGraphics, you can find the public API here.
If you want to extend MetricsGraphics, you can read up on the components and utilities.
Development Setup
This project uses Yarn Workspaces. Please make sure that Yarn is installed.
# clone and setup
git clone https://github.com/metricsgraphics/metrics-graphics
cd metrics-graphics
yarn install
Run both the development setup of the library and the development setup of the examples
# inside packages/lib
yarn dev

# inside packages/examples
yarn dev
Explorar proyectos relacionados
Cargando…