
Steema/TeeBI
Steema/TeeBI has 152 GitHub stars and 63 forks. Star changes are not measured yet. Last checked 2026-11-14 03:44 UTC. Last push 2026-11-12.
Crecimiento de estrellas medido
- in 24h
- Recopilando historial
- in 7 days
- Recopilando historial
- in 15 days
- Recopilando historial
- in 1 month
- Recopilando historial
Cambios netos en períodos que se solapan, no totales diarios. Los datos no disponibles se dejan en blanco. Las estrellas indican interés, no calidad.
Acerca de
Data-mining and Visualization components for RAD Studio
DatosREADME.md
OriginalTeeBI
Telegram forums: https://t.me/steema_bi


Datamining, Visualization, Multidimensional Queries, Pivot Tables, Big data
What is TeeBI ?
A simple class to implement in-memory database complex structures, to provide:
Ultra fast speed (every column or field is a simple array)
Big-data ready, billions of cells supported
Multi-platform (Windows, Mac OSX, Android, iOS, Linux and more), for VCL, Firemonkey, Delphi and C++. 100% Pure Pascal, no dependencies, no server, just RTL.
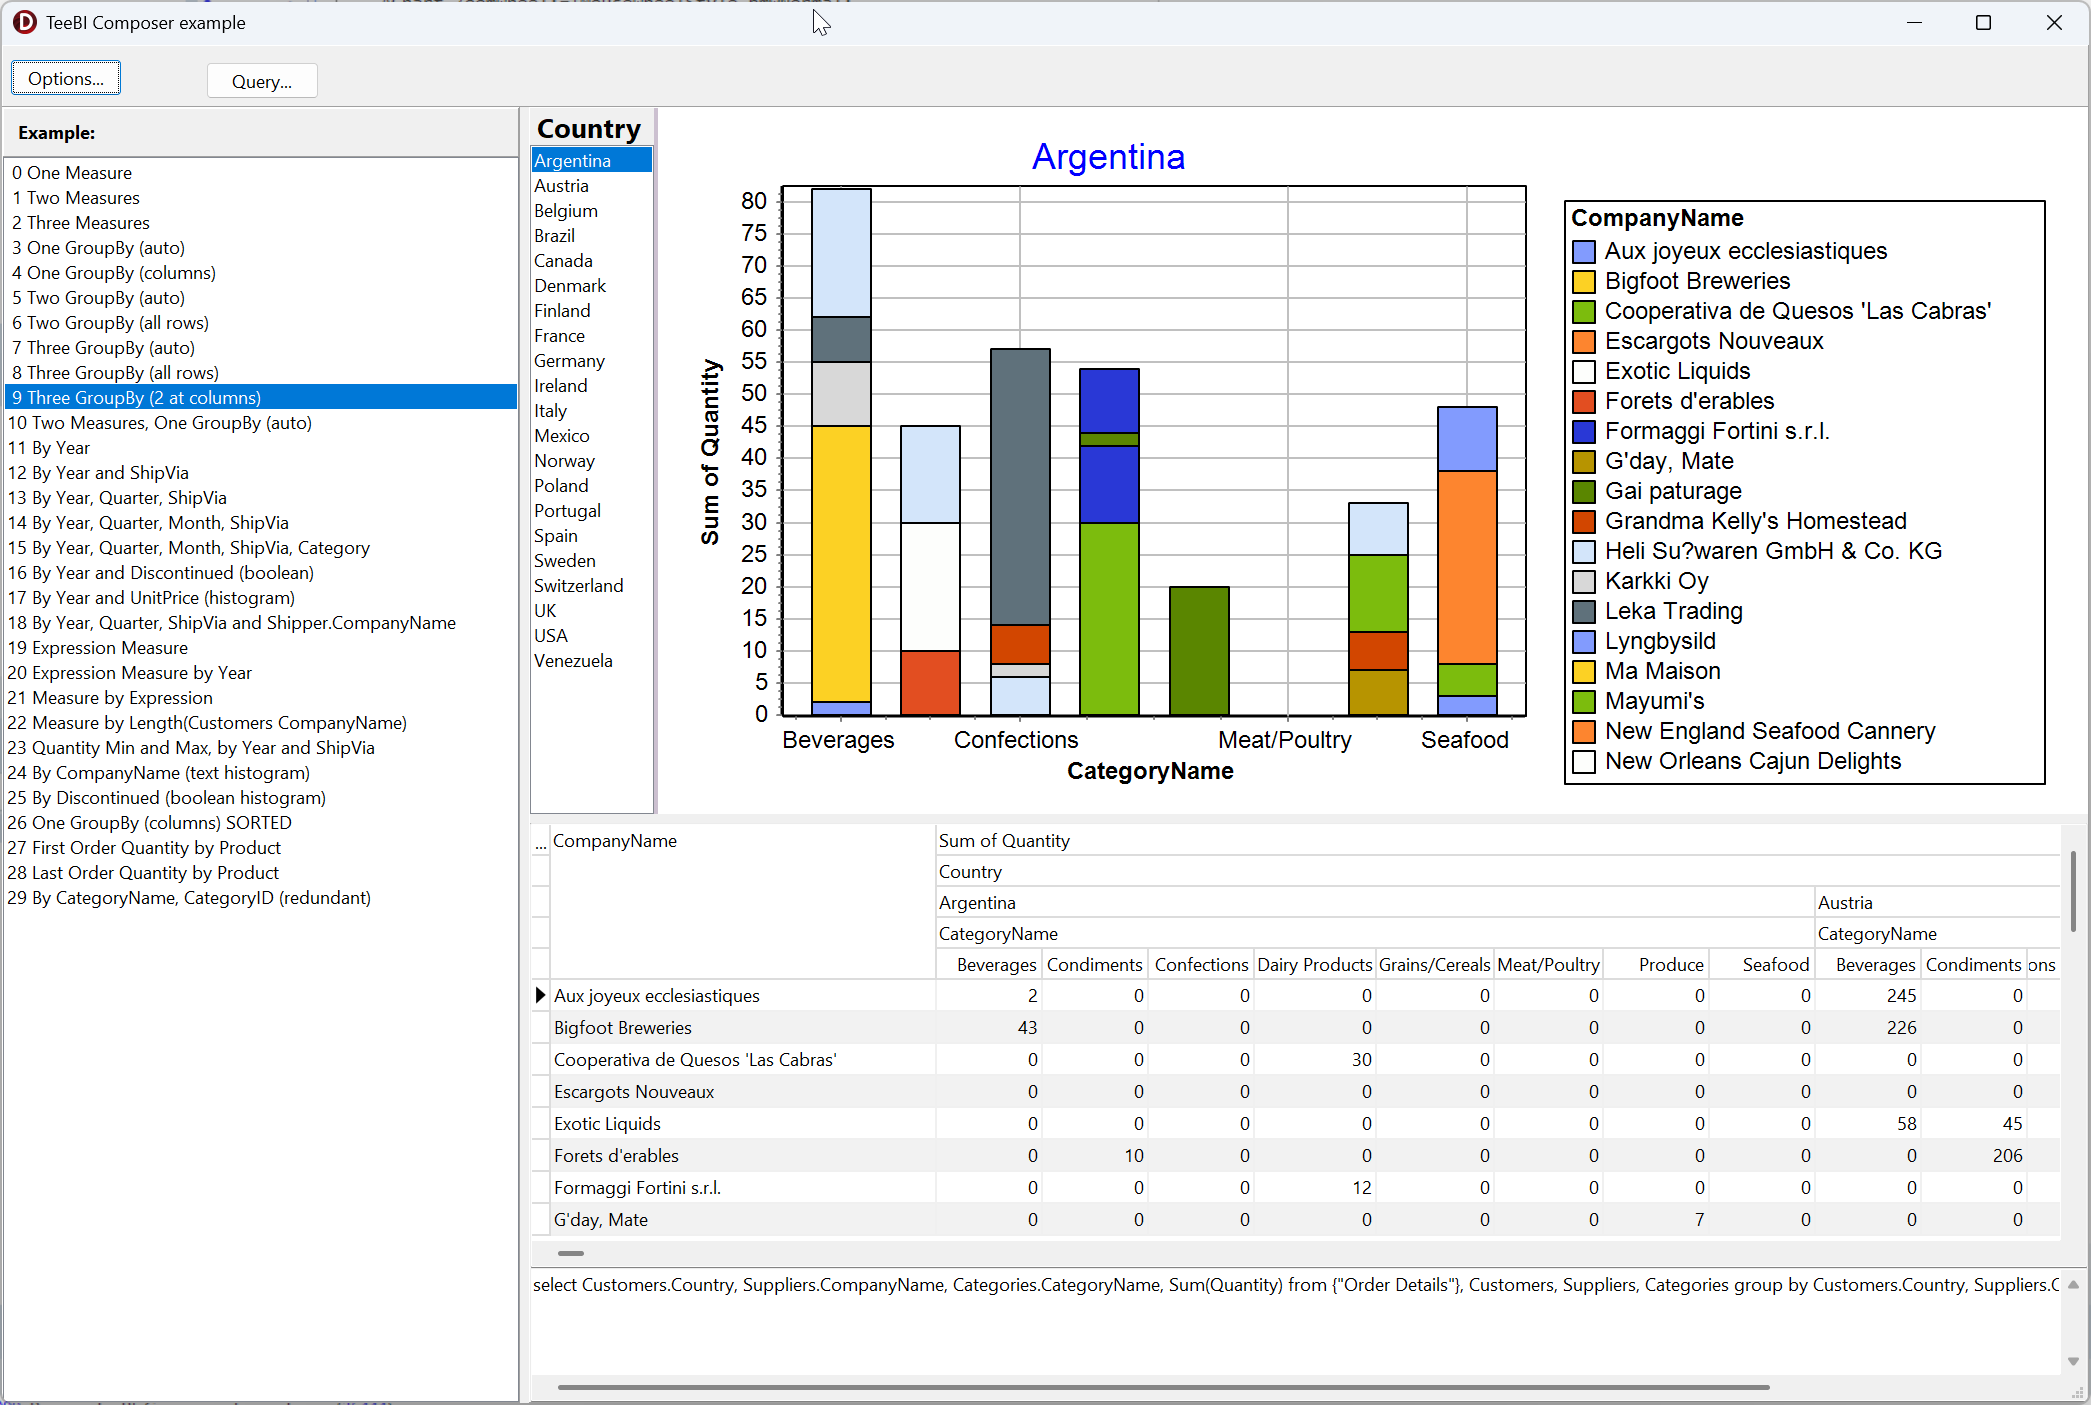
Automatic visualizations of complex structures (charts, grids, optional TeeGrid and more)
SQL-like high-speed queries and summaries by code or "select" scripts
Multi-dimensional Excel-like pivot tables, with drag & drop editor
Geographic database (Countries, States, Provinces...) to automatically create summary geo queries, TeeChart world maps, and statistics

Transparent optional remote web server fast data access (compressed binary streams of raw arrays)
Automatic relationships between columns (master-detail), indexes and foreign keys
Import data from files, databases, objects (ORM), AI in one or few lines of code
Export data (to csv,pdf,html,xml,excel,json), comparisons, manipulations and conversions
TeeBI makes very easy to create custom dashboard no-code analytic applications for your end-users. Ready to use dialogs enable easy runtime connections to many database engines and to all kind of data sources, and drag and drop in the query dialogs allow selecting fields as measures, dimensions, parameters and filters with just mouse clicks.
Supported development environments:
- Embarcadero RAD Studio Florence 13.0, and from Studio XE4 and up (Delphi and C++)
- Lazarus / FreePascal
Getting started
Example code
uses BI.DataItem, BI.CSV, BI.Db, BI.Xml, BI.Json, BI.AI;

var Data1 : TDataItem;
Data1 := TBICSV.FromFile( 'mydata.csv' );  // also From TStrings, String etc

// other importing methods:
Data1 := TBIDB.From( SQLConnection1 ); // loads all tables in the connection in one line of code

// import all tables from a database, one line of code:
Data1 := TBIDB.Import(FDConnection1, False).ToItem;

// import data from different formats
Data1 := TBIJson.From ...
Data1 := TBIXML.From ...

// import from Artificial Intelligence AI agents, like Google Gemini:
Data1 := TBIAI.From('Give me the list of the highest 10 mountains by elevation in csv format, just the list');

// from arrays, TCollection, custom Records (via RTTI):
Data1 : TTypeProvider<TCustomer>.Create(Self, MyArrayOfCustomers).Data;

// import from components with automatic detection:
Data1 := TComponentImporter.From(Self, Memo1.Lines);
Data1 := TComponentImporter.From(Self, DataSource1);

// importing from any URL, automatic detection of content format:
Data1 := TBIURLSource.From('https://www.mysite.com/get/mydata?param=123');

// queries, including group by, sort, expressions, having, sub-select, distinct, date operators etc
Data1 := TBISQL.From( Data2, 'sum(Amount) where (Customer=123) and (Product<456) group by Country, Year');
Data1 := TBISQL.From( Data2, 'ProductName, UnitPrice where UnitPrice > select Average(UnitPrice)');
Data1 := TBISQL.From( Movies, 'top 100 offset 15000 year, length');

// visualizing
BIGrid1.Data := Data1;
BIChart1.Data := Data1;

BIGrid2.Data := Data1['Products']; // sub-tables

// importing data from a standard TeeChart Series:
Data1 := TChartData.From(Series1);
Online grids and charts from remote queries using BIWeb Server:
http://steema.cat:15015/?data=SQLite_demo&format=.jpg
Related
Deprecated
Features marked as obsolete and moved to a separate folder, but still usable:
Machine-learning (native data pass to R Language and Python Scikit)
Interactive Dashboards rendered to screen (desktop and mobile) and HTML Web pages
Explorar proyectos relacionados
Asabeneh/30-Days-Of-Python
El reto de programación 30 Days of Python es una guía paso a paso para aprender el lenguaje de programación Python en 30 días. Este reto puede llevar más de 100 días. Sigue tu propio ritmo. Estos vídeos también pueden ayudarte: https://www.youtube.com/channel/UC7PNRuno1rzYPb1xLa4yktw
78,711 estrellasgrafana/grafana
Plataforma abierta y componible de observabilidad y visualización de datos. Visualiza métricas, registros y trazas de múltiples fuentes, como Prometheus, Loki, Elasticsearch, InfluxDB, Postgres y muchas más.
77,894 estrellasredis/redis
Para los desarrolladores que crean aplicaciones en tiempo real basadas en datos, Redis es la opción preferida, la más rápida y la de más funciones como caché, servidor de estructuras de datos y motor de consultas de documentos y vectores.
77,491 estrellasapache/superset
Apache Superset es una plataforma de visualización y exploración de datos.
75,522 estrellas