
wangjiawen2013/charton
wangjiawen2013/charton has 453 GitHub stars and 18 forks. GitHot measured 0 stars in 24 hours. Last checked 2026-11-19 16:26 UTC. Last push 2026-11-14.
Gemessener Sternzuwachs
- in 24h
- 0
- in 7 days
- Verlauf wird gesammelt
- in 15 days
- Verlauf wird gesammelt
- in 1 month
- Verlauf wird gesammelt
Nettoänderungen in überlappenden Zeiträumen, keine Tagessummen. Fehlende Messwerte bleiben leer. Sterne zeigen Interesse, nicht Qualität.
Über uns
Grammar of Graphics in Rust
Kreativität und MedienREADME.md
OriginalCharton - A versatile plotting library for Rust
Altair-style declarative plotting for Rust. High-performance, Polars-friendly, and Wasm-ready.
"Really nice project. ... This works perfectly as an ecosystem." — Ritchie Vink, Creator of Polars


Chart like You Mean It
standard blocks — limitless charts
Charton is a high-performance Rust plotting library featuring a declarative API inspired by Altair. It provides Polars support for fast data processing. Integrated with evcxr_jupyter, it enables seamless interactive data exploration in notebooks.
Using Nushell? Charton also ships as a Nushell plugin:
nu_plugin_chartonturns any pipeline table into a chart, inline or saved as SVG/PNG. Install and usage → plugin README.
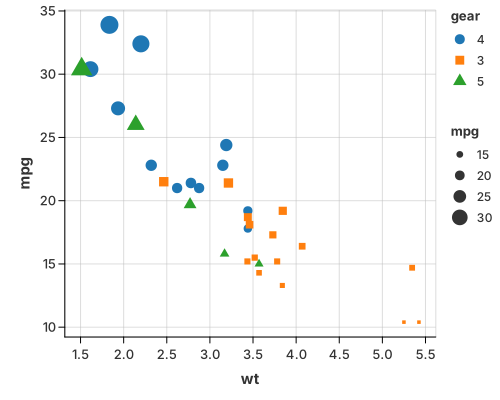 Grid Lines |
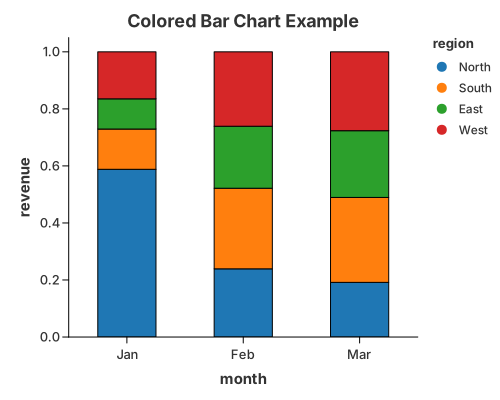 Stacked Bar Chart |
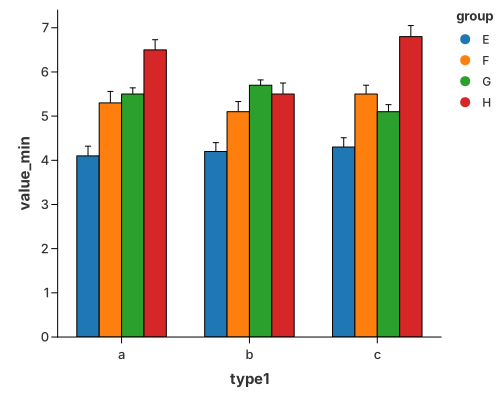 Grouped Bar With Errorbar |
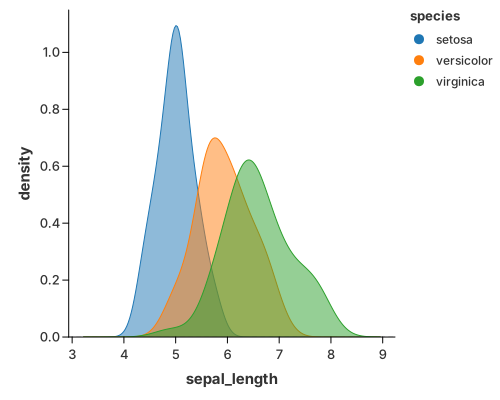 Density |
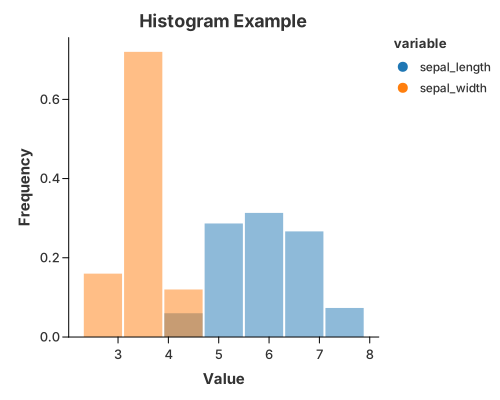 Histogram |
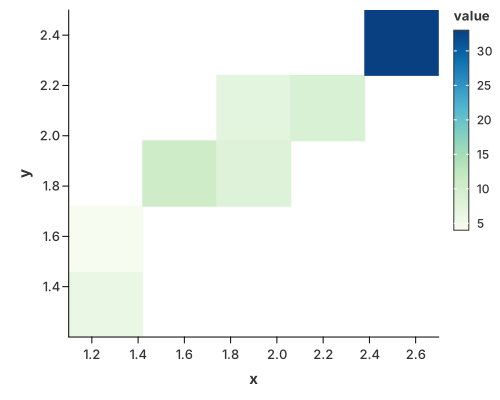 Heatmap (continuous) |
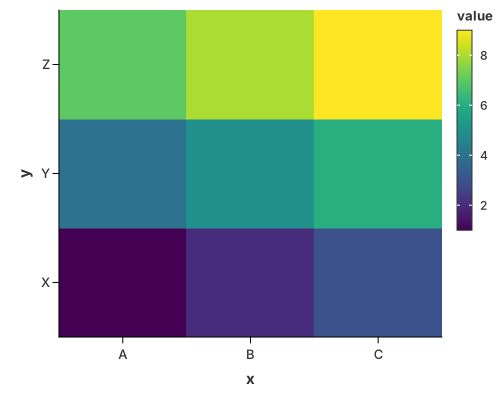 Heatmap |
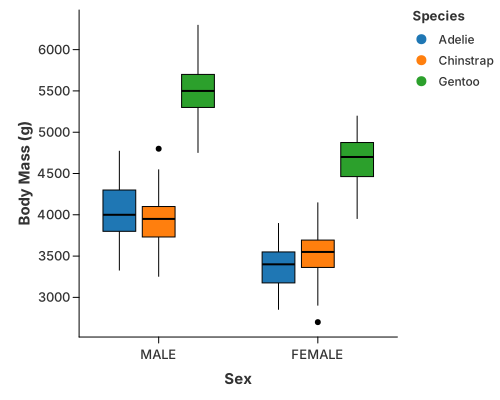 Grouped Boxplot |
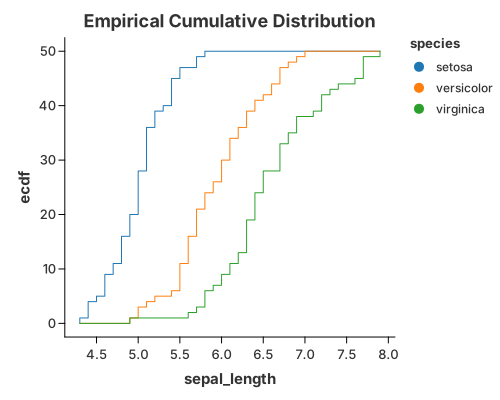 Cumulative Frequency |
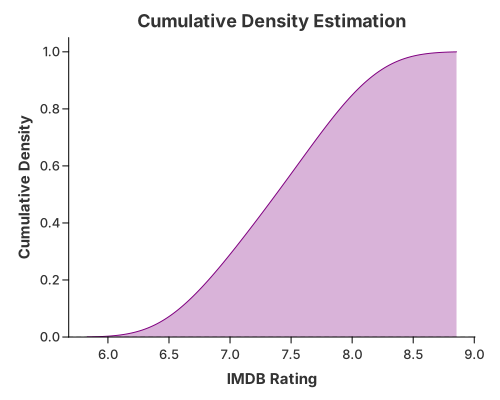 Distribution |
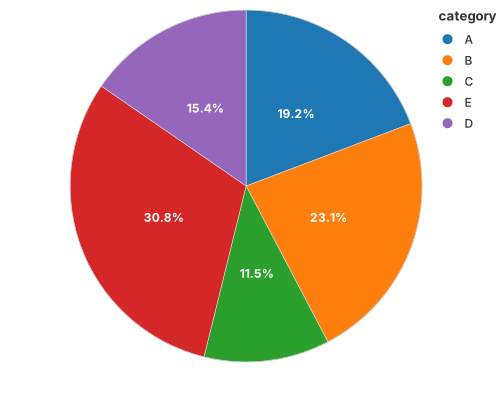 Pie |
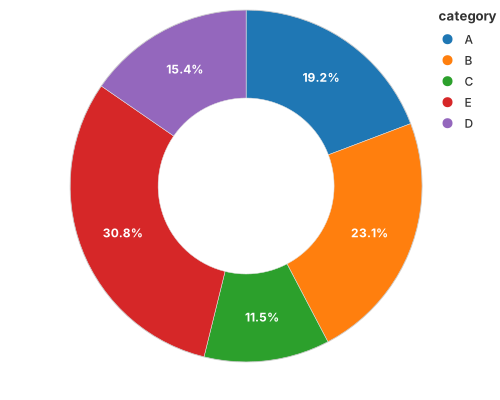 Donut |
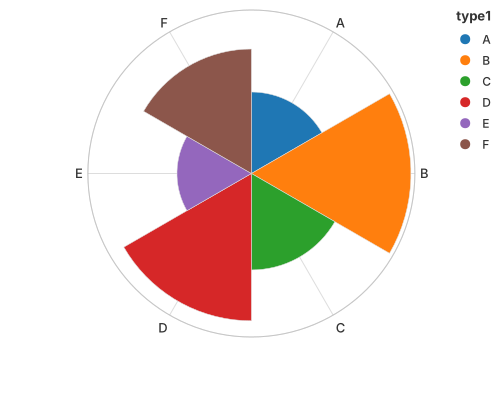 Rose |
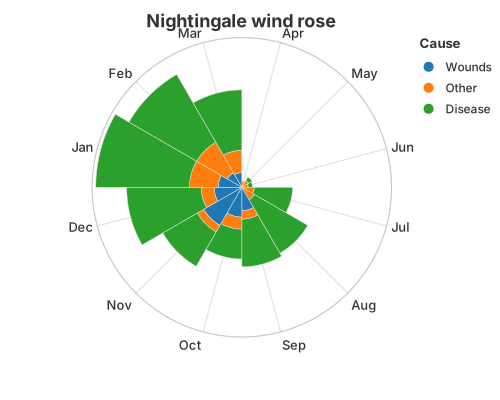 Nightingale |
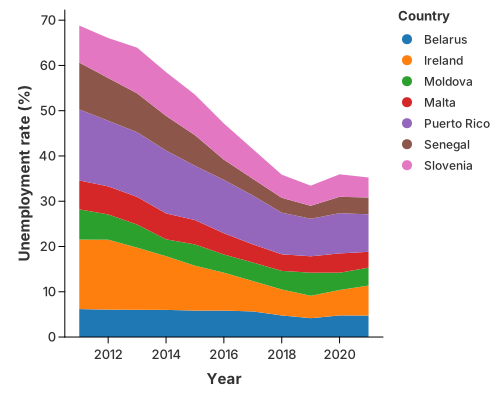 Simple Stack Area |
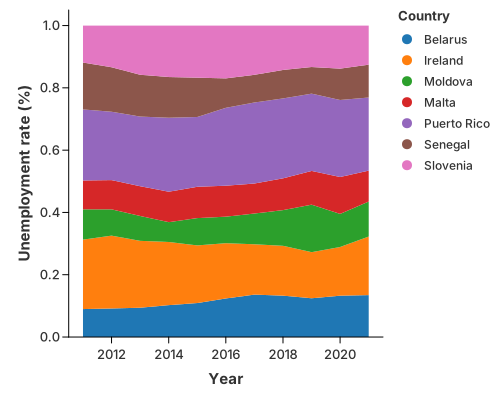 Normalized Stacked Area |
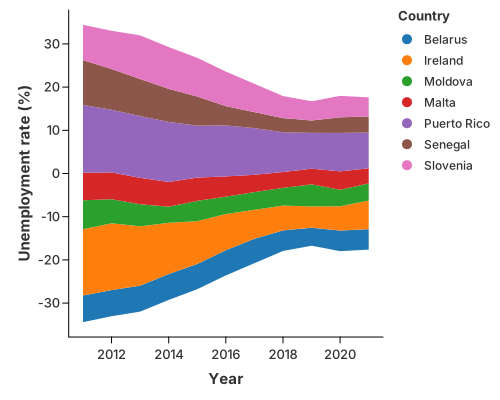 Steamgraph |
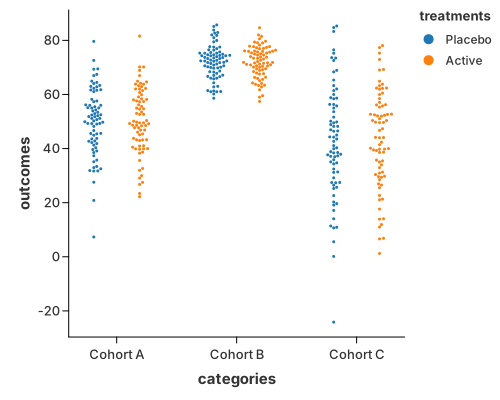 Beeswarm |
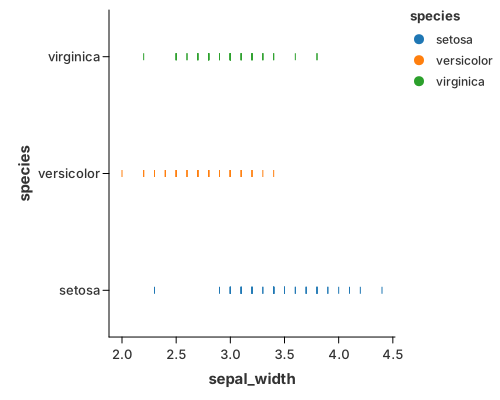 Strip |
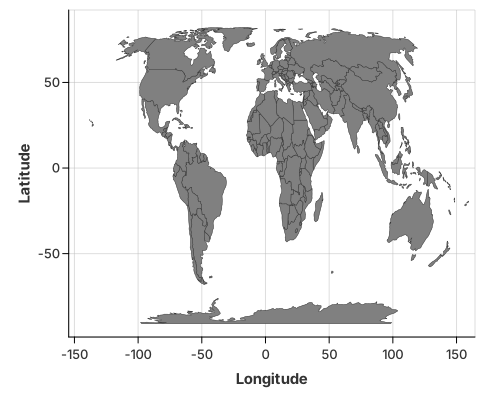 Geo Chart |
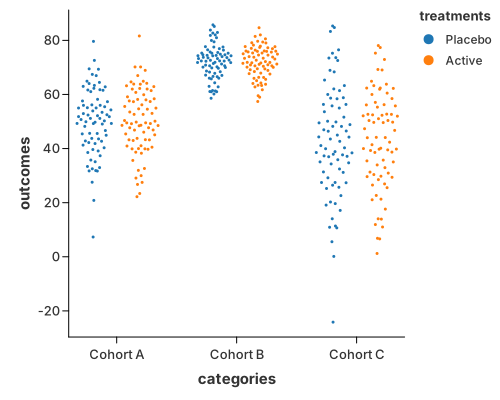 Quasirandom |
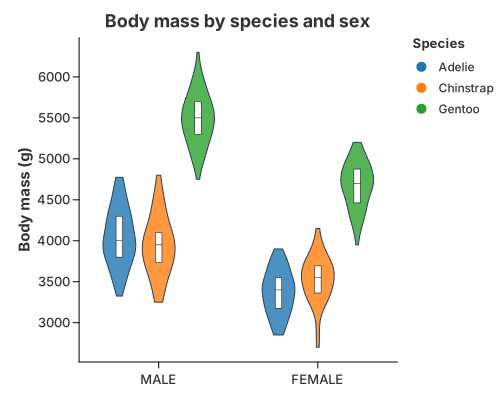 Grouped Violin |
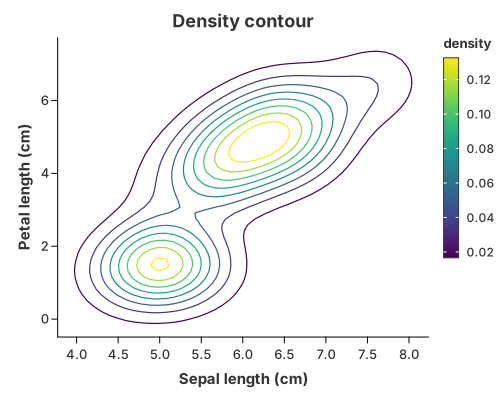 Density Contour |
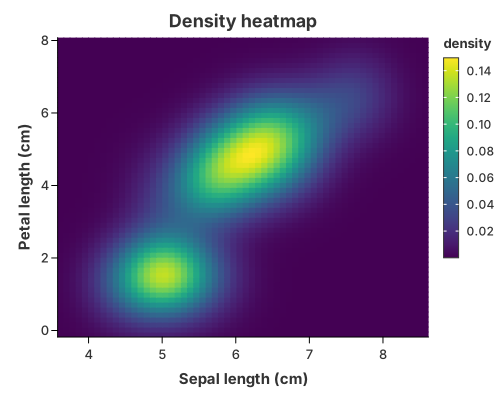 Density Heatmap |
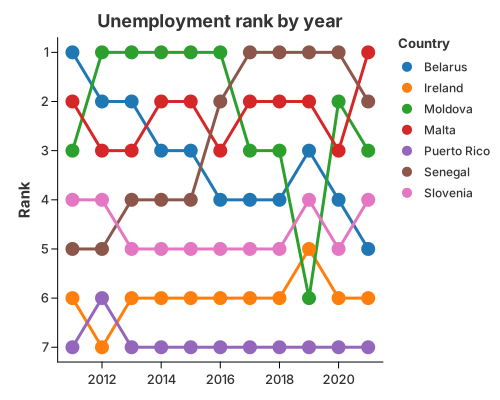 Bump Chart |
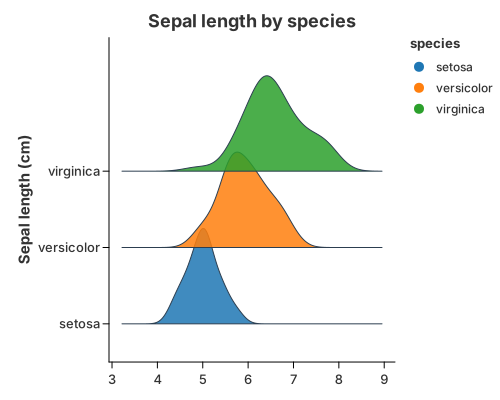 Ridgeline |
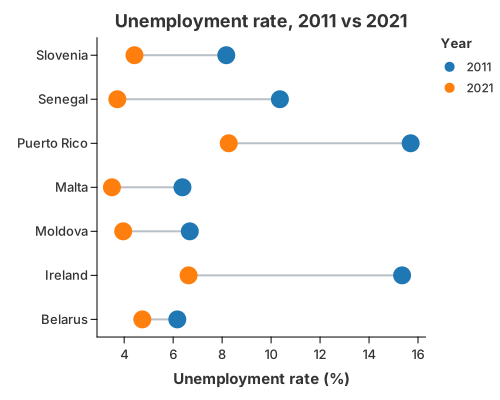 Dumbbell |
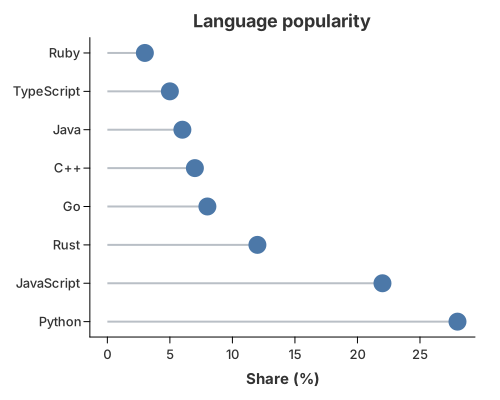 Lollipop |
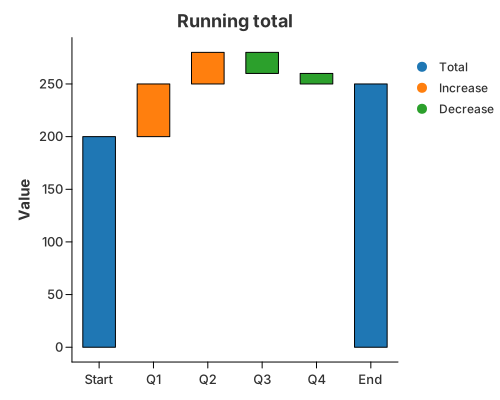 Waterfall |
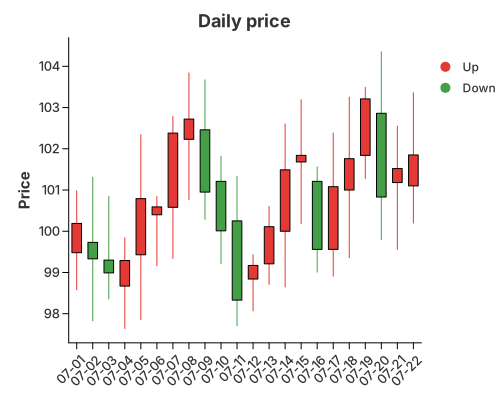 Candlestick |
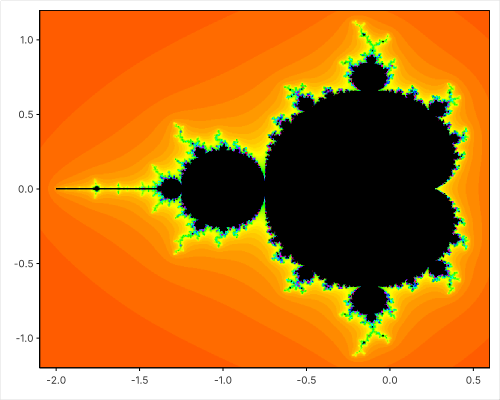 Mandelbrot |
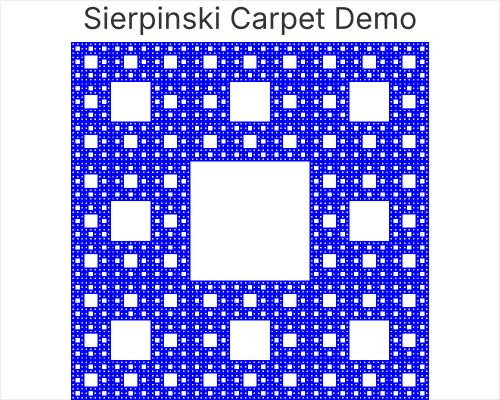 Sierpinski |
Installation
Add to Cargo.toml:
[dependencies]
charton = "0.9"                                            # Standard (Single-threaded + SVG export)
charton = { version = "0.9", features = ["png"] }          # Pure Headless Raster Renderer (CPU only)
charton = { version = "0.9", features = ["pdf"] }          # Export charts to PDF format
charton = { version = "0.9", features = ["wgpu", "png"] }  # Local Desktop with GPU acceleration + PNG export
charton = { version = "0.9", features = ["wgpu"] }         # Web Browsers (WebAssembly/Wasm target)
charton = { version = "0.9", features = ["parallel"] }     # Multi-threaded data processing (Rayon)
charton = { version = "0.9", features = ["geo"] }          # Enable geospatial coordinate support
Quick Start
Charton provides a high-level, declarative API. Standard visualizations can be generated using a concise one-liner syntax:
use charton::prelude::*;

// Data: Physical measurements (Height vs. Weight)
let height = vec![160.0, 165.0, 170.0, 175.0, 180.0];
let weight = vec![55.0, 62.0, 68.0, 75.0, 82.0];

// One-liner plotting
chart!(height, weight)?.mark_point()?.encode((alt::x("height"), alt::y("weight")))?.save("out.svg")?;
From Macros to Production API
While the chart! macro is a convenient syntactic sugar for rapid prototyping and simple scripts, the underlying Chart::build API is recommended for production environments where explicit data handling is required.
1. Professional Build API
For complex applications, use Chart::build to gain full control over the Dataset lifecycle.
let ds = Dataset::new()
    .with_column("height", height)?
    .with_column("weight", weight)?;

Chart::build(ds)? // Equivalent to chart!(ds)?
    .mark_point()?
    .encode((alt::x("height"), alt::y("weight")))?
    .save("out.svg")?;
Tip: Use
add_columninstead if you need to add columns dynamically within loops or conditional logic.
2. Polars Integration
For Polars users, Charton provides the load_polars_df! macro to seamlessly convert a DataFrame into a Charton-ready Dataset.
use polars::prelude::*;

let df = df![
    "height" => vec![160.0, 165.0, 170.0, 175.0, 180.0],
    "weight" => vec![55.0, 62.0, 68.0, 75.0, 82.0]
]?;

// Efficiently convert Polars DataFrame to Charton Dataset
let ds = load_polars_df!(df)?;

Chart::build(ds)? // Equivalent to chart!(ds)?
    .mark_point()?
    .encode((alt::x("height"), alt::y("weight")))?
    .save("out.svg")?;
Compatibility Note: Charton uses versioned macros to handle Polars' rapid API evolutions. Versions below 0.44 are no longer supported.
| Polars Version | Macro to Use | Status |
|---|---|---|
| 0.53+ | load_polars_df!(df)? |
Latest (Standard) |
| 0.44 - 0.52 | load_polars_v44_52!(df)? |
Legacy Support |
| < 0.44 | N/A | Unsupported |
Layered Grammar
Inspired by the Grammar of Graphics (as seen in ggplot2 and Altair), Charton replaces rigid templates with a modular, layer-based system. Visualizations are constructed by stacking atomic marks, offering infinite flexibility beyond fixed chart types.
// Create individual layers
let line = chart!(height, weight)?
    .mark_line()?
    .encode((alt::x("height"), alt::y("weight")))?;

let point = chart!(height, weight)?
    .mark_point()?
    .encode((alt::x("height"), alt::y("weight")))?;

// Combine into a composite chart
line.and(point).save("layered.svg")?;
Faceting Support
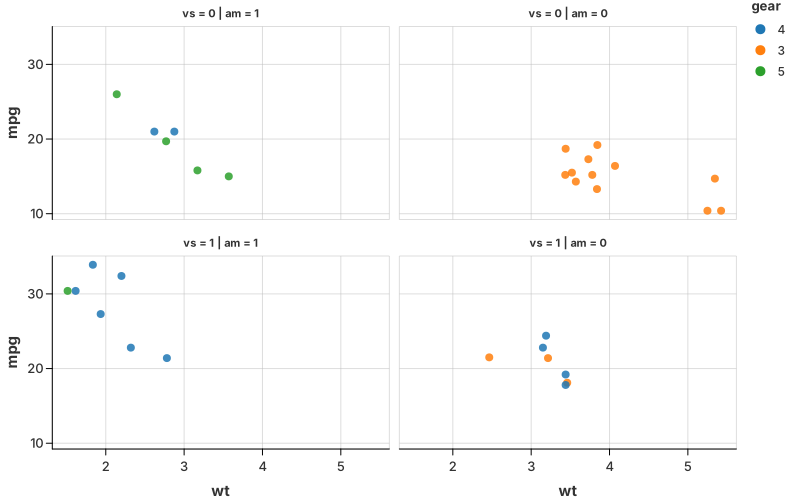
Now supporting multi-panel faceting (wrap and grid layouts), enabling you to easily split and compare complex datasets across coordinated subplots.
Desktop GUI Integration
Charton can render directly into native desktop applications via its GPU-accelerated backend. Below is a real-time system telemetry dashboard built with Charton and egui, demonstrating live CPU, memory, swap, and network monitoring with per-core load distribution:
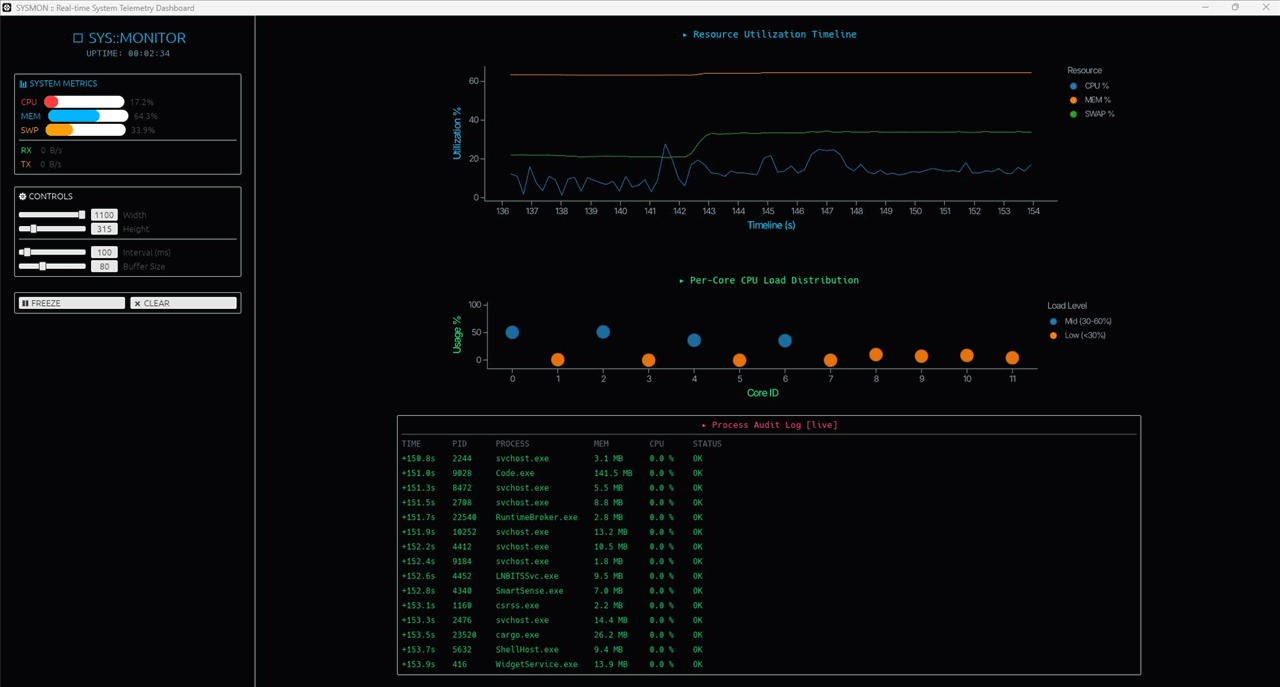
Charton offers two integration paths for GUI applications: render_to_surface for zero-copy GPU rendering (ideal for 60 FPS game loops where wgpu versions align), or the standalone WgpuRenderer that manages its own wgpu instance and returns a pixel buffer — slightly slower but immune to wgpu version conflicts between crates.
WebAssembly and Frontend
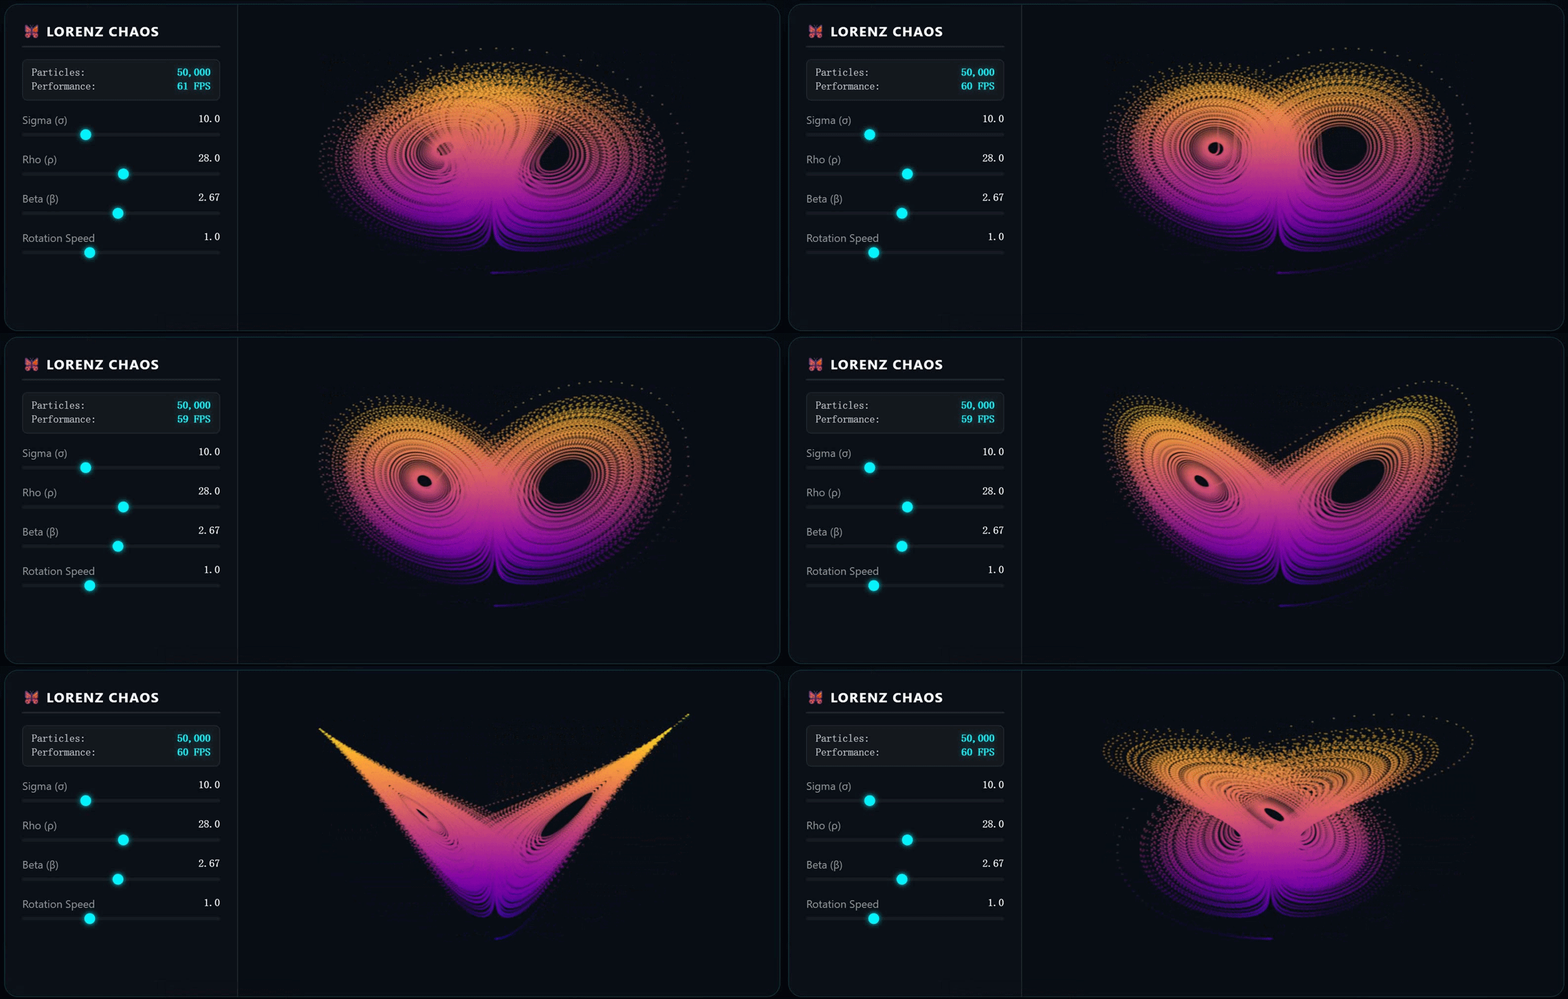
Charton supports WebAssembly and modern web frontend. Below is an interactive demo simulates a 50,000-point Lorenz Attractor at 60 FPS, demonstrating how WebAssembly enables high-performance, real-time data visualization in the browser.
The SVG it returns is a semantic document: elements carry role classes (charton-axis, charton-mark, charton-legend, …) and identity attributes, so a page stylesheet can restyle a chart — dark mode, brand colors, print — without re-rendering it, and screen readers get the chart's title and description instead of a stream of tick numbers. Exported PDFs carry the equivalent structure as tags. See Semantic Output.
Interactive Notebooks (Jupyter)
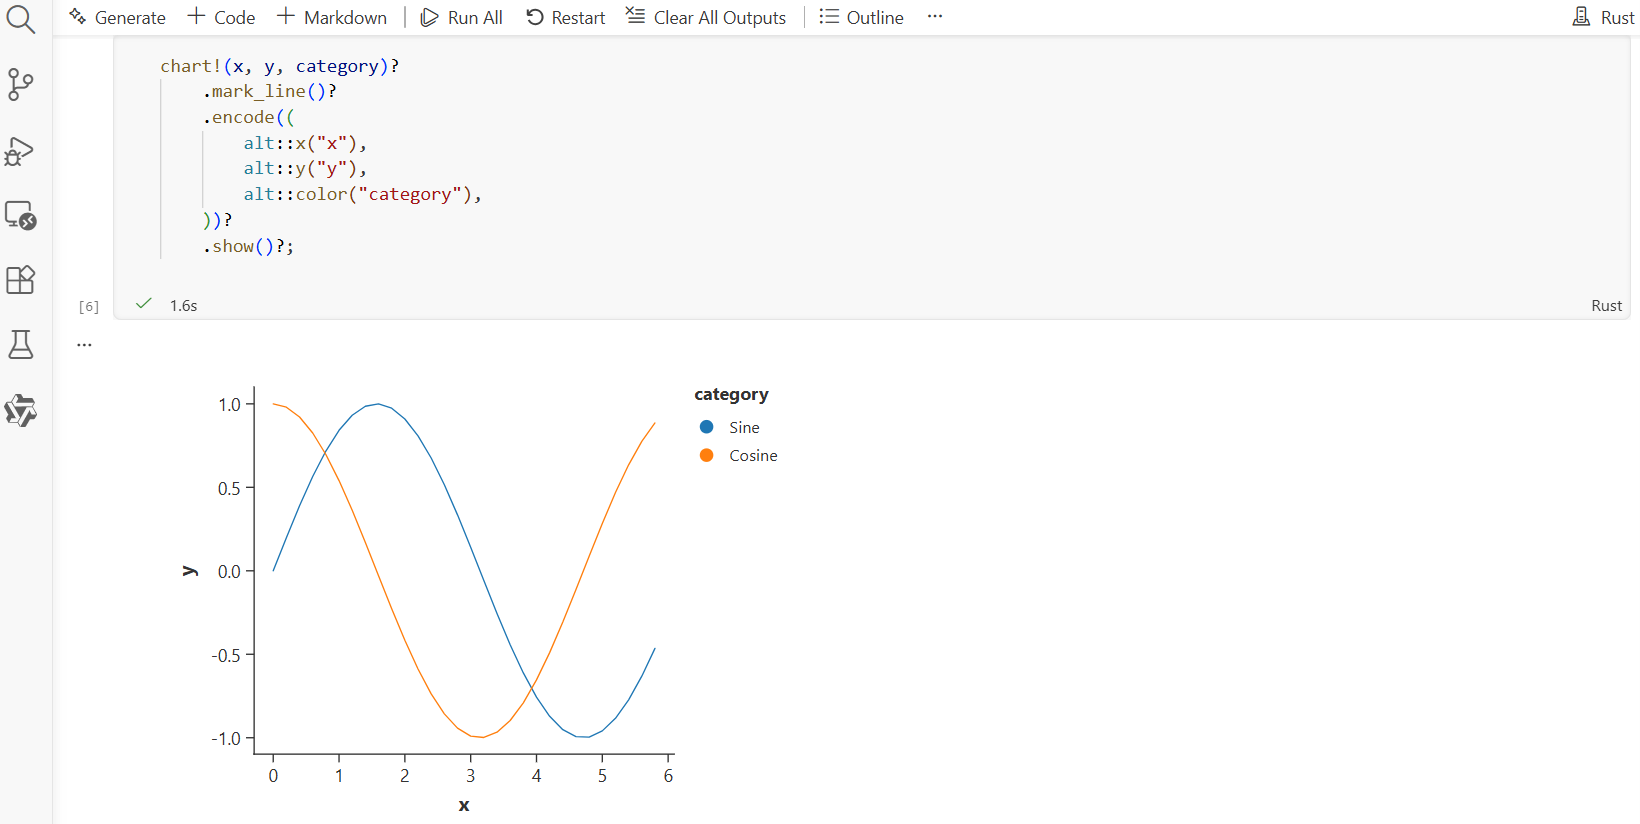
Charton integrates with evcxr_jupyter for interactive data exploration. Replacing .save() with .show() renders SVGs directly within notebook cells:
True Layer Synchronization
Stop fighting with fragile, hard-coded patches. Charton treats scaling as a Single Source of Truth, making it possible to combine heterogeneous data sources into one plot while maintaining total mathematical consistency across every mark and axis.
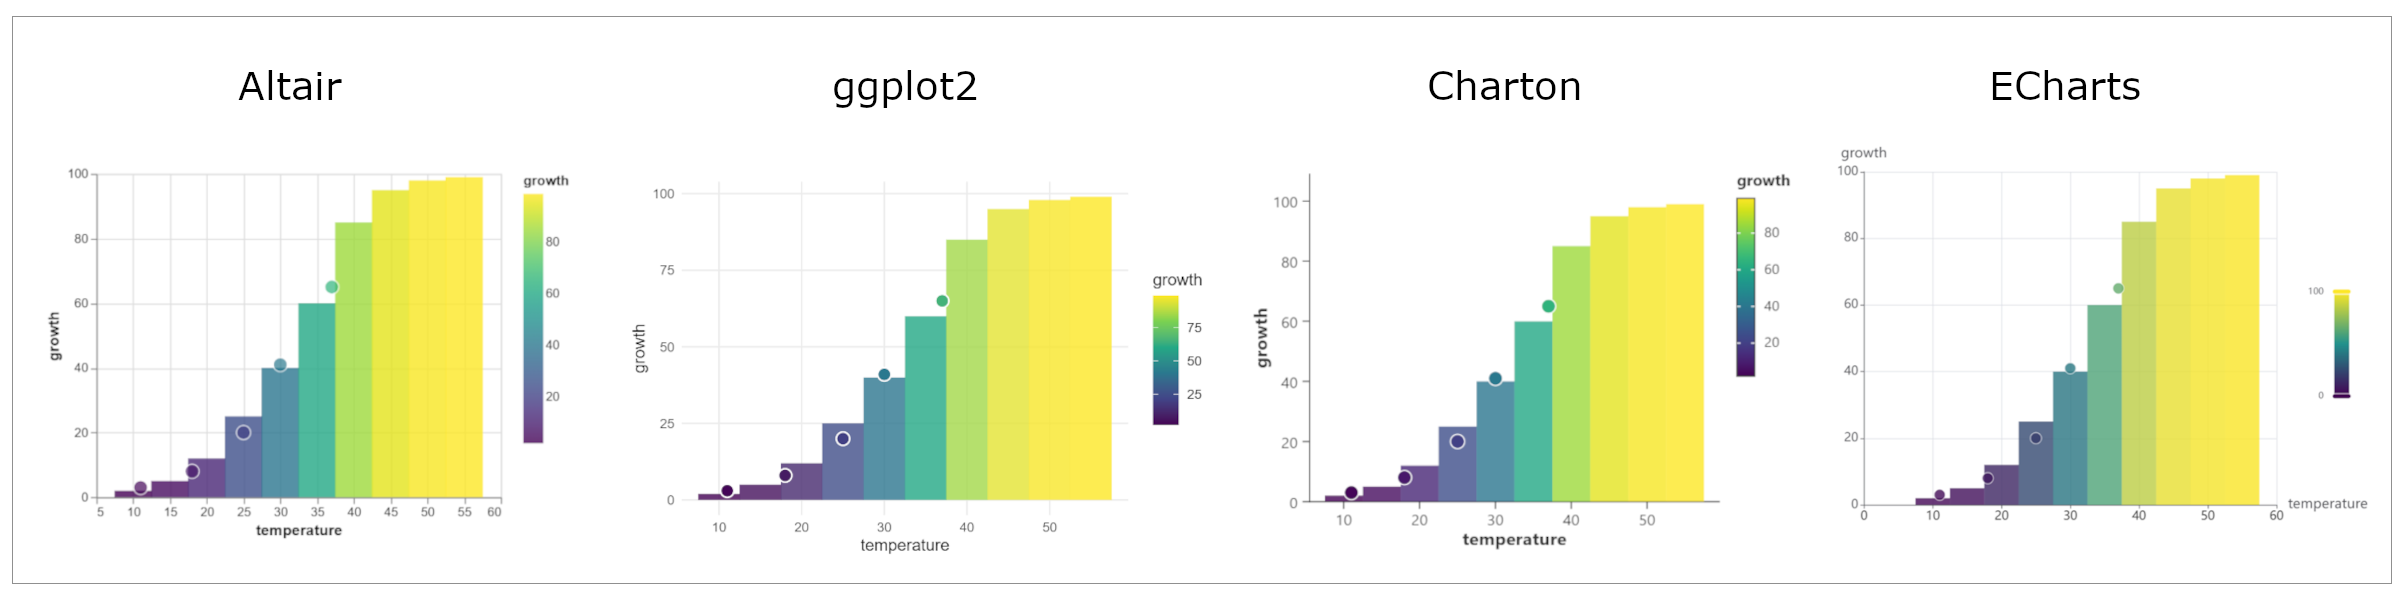 This figure demonstrates semantic synchronization in Charton. Point samples and bar backgrounds from different data sources are anchored to a unified scale, ensuring absolute color and spatial consistency.
Publish Quality
Designed for precision, Charton provides pixel-perfect control over complex marks. Whether it is a multi-layered ErrorBar for biomedical research or a high-density scatter plot for finance, Charton delivers the aesthetic rigor required by top-tier journals.
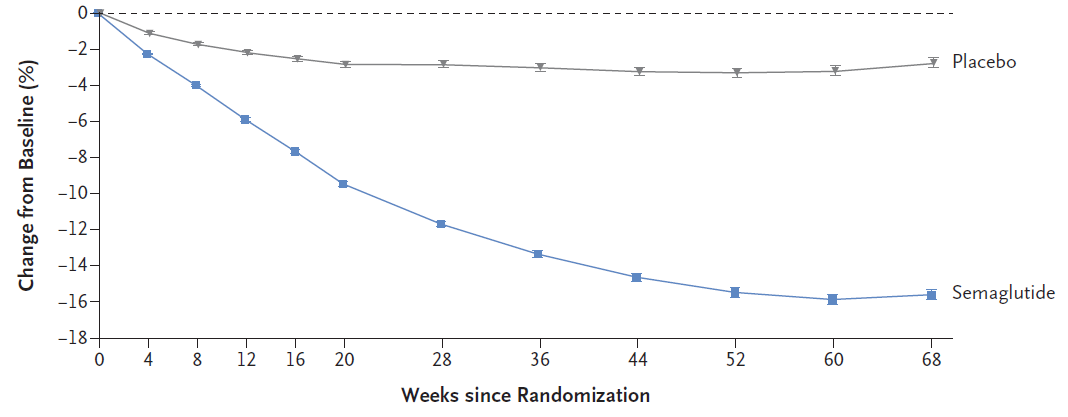 NEJM |
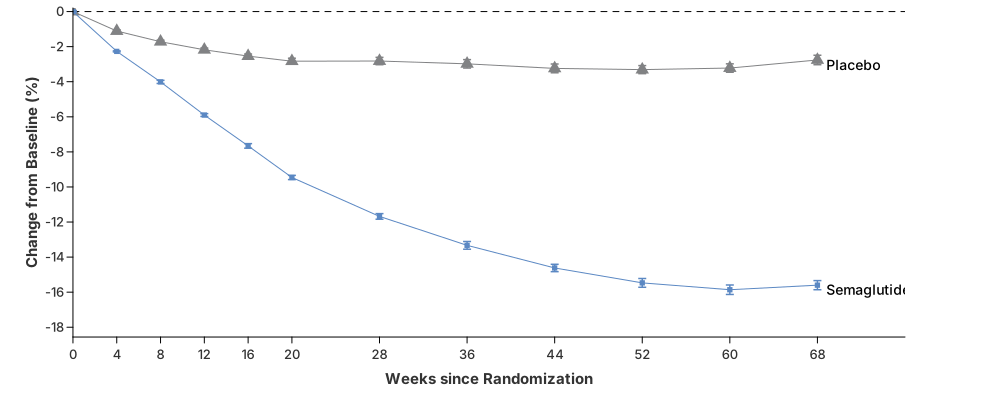 Charton |
A reproduction of Figure 1A from the 2021 NEJM landmark study on once-weekly semaglutide for weight management, implemented using Charton.
Documentation
Please go to the Charton Docs for full documentation.
Ecosystem
Charton ships a first-party Nushell plugin that turns pipeline tables into charts, inline or as SVG/PNG.
Other Rust plotting libraries worth knowing about:
kuva: A scientific plotting library in Rust. 64 plot types, SVG output, optional PNG/PDF backends, and a CLI binary that renders plots directly from the shell.
charts-rs: An ECharts-inspired Rust charting library with multiple chart types, built-in themes, SVG animations, and multi-format export—tailored for dashboards and web-style visualizations rather than scientific plotting.
License
Charton is licensed under the Apache License 2.0.
AI Declaration
- AI used: Yes
- Role: Implementation acceleration, test generation, documentation
- Human responsibility: Grammar of Graphics architecture design, code review, maintenance, and all project decisions