
maitree7/Fraud_Detection_SQL
maitree7/Fraud_Detection_SQL has 106 GitHub stars and 35 forks. GitHot measured 0 stars in 24 hours and +1 in 7 days. Last checked 2026-11-11 20:16 UTC. Last push 2024-07-04.
So werden diese Zahlen gemessen
Fraud Detection on credit card transations
Gemessener Sternzuwachs
- in 24h
- 0
- in 7 days
- +1
- in 15 days
- Aktualisierung verzögert
- in 1 month
- Aktualisierung verzögert
Nettoänderungen in überlappenden Zeiträumen, keine Tagessummen. Fehlende Messwerte bleiben leer. Sterne zeigen Interesse, nicht Qualität.
README.md
OriginalFraud_Detection_SQL

Credit Card Fraudster by Richard Patterson | Creative Commons Licensed
Background
Fraud is everywhere these days—whether you are a small taco shop or a large international business. While there are emerging technologies that employ machine learning and artificial intelligence to detect fraud, many instances of fraud detection still require strong data analytics to find abnormal charges.
Application of new SQL skills to analyze historical credit card transactions and consumption patterns in order to identify possible fraudulent transactions.
Accomplish three main tasks:
Data Modeling: Define a database model to store the credit card transactions data and create a new PostgreSQL database using your model.
Data Engineering: Create a database schema on PostgreSQL and populate your database from the CSV files provided.
Data Analysis: Analyze the data to identify possible fraudulent transactions.
Files
Query Files
CSV Files
Data Modeling
Create an entity relationship diagram (ERD) by inspecting the provided CSV files.
Note: For the credit_card table, the card column should be a VARCHAR(20) datatype rather than an INT.
Tool used to develop ERD Quick Database Diagrams to create your model.
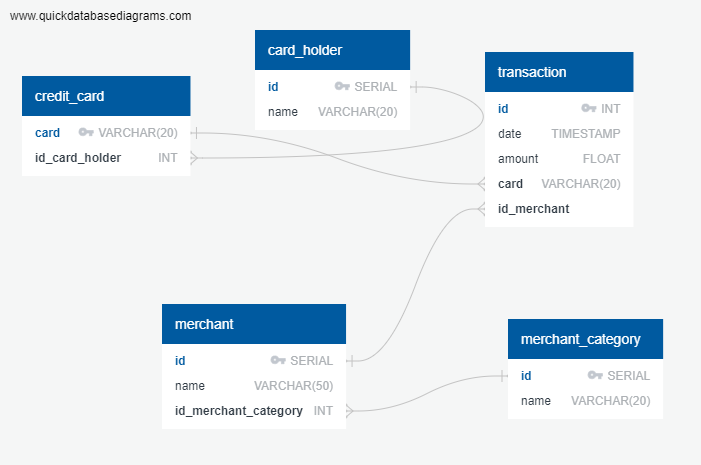
Data Engineering
Using your database model as a blueprint, create a database schema for each of your tables and relationships. Specify data types, primary keys, foreign keys, and any other constraints you defined.
After creating the database schema, import the data from the corresponding CSV files.
Data Analysis
Now that your data is prepared within the database, it's finally time to identify fraudulent transactions using SQL and Pandas DataFrames.
Top 100 highest transactions during early hours i.e. 7:00 to 9:00 AM
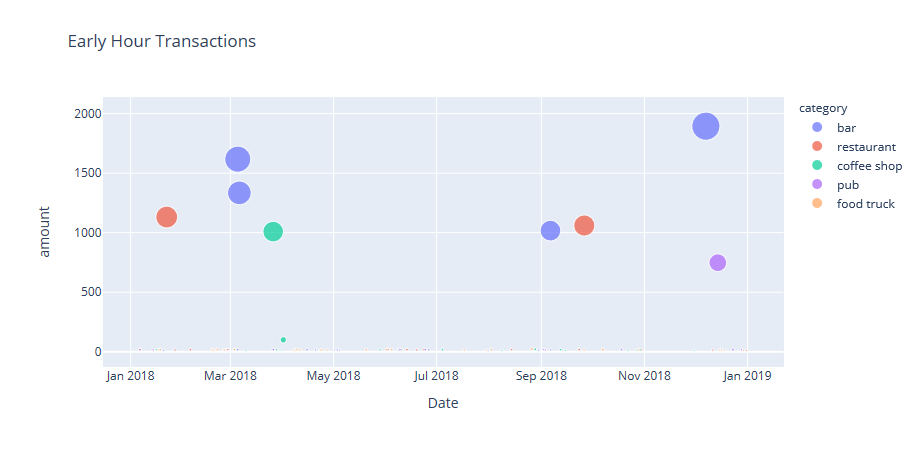
Some fraudsters hack a credit card by making several small payments (generally less than $2.00), which are typically ignored by cardholders. Count the transactions that are less than $2.00 per cardholder. Is there any evidence to suggest that a credit card has been hacked? Explain your rationale.
What are the top five merchants prone to being hacked using small transactions?
Once you have a query that can be reused, create a view for each of the previous queries.
Created a report for fraudulent transactions of some top customers of the firm using Pandas, Plotly Express, hvPlot, and SQLAlchemy to create the visualizations.
- Fraudulent transactions in the history of two of the most important customers of the firm on the basis of their cardholders' IDs are 18 and 2.
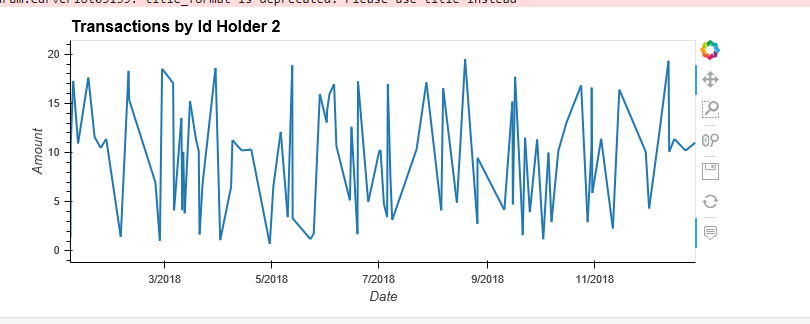
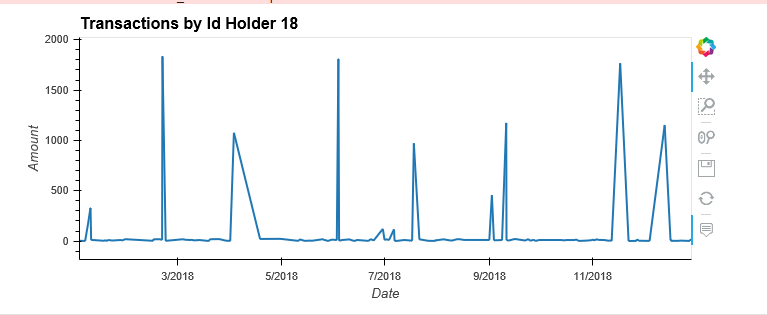
Observation :
The consumption pattern for both the id holder is very different. Id Holder 2 makes too many small transactions. Id Holder 18 has transactions ranging till $1839. Id Holder 2 is more suspectable to fraudulent transactionsThe CEO of the firm's biggest customer suspects that someone has used her corporate credit card without authorization in the first quarter of 2018 to pay for several expensive restaurant bills. You are asked to find any anomalous transactions during that period.
- Using Plotly Express, created a series of six box plots, one for each month, in order to identify how many outliers there are per month for cardholder ID 25.
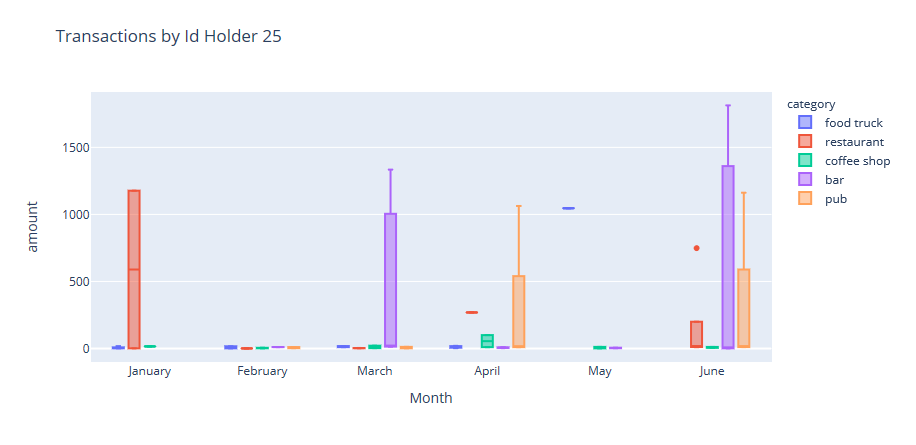
- Observations :
There seems to be fraudulent transactions pertaining to Restaurant & Food Truck category where Food Truck is ranging from $1.46 to $1046
Challenge
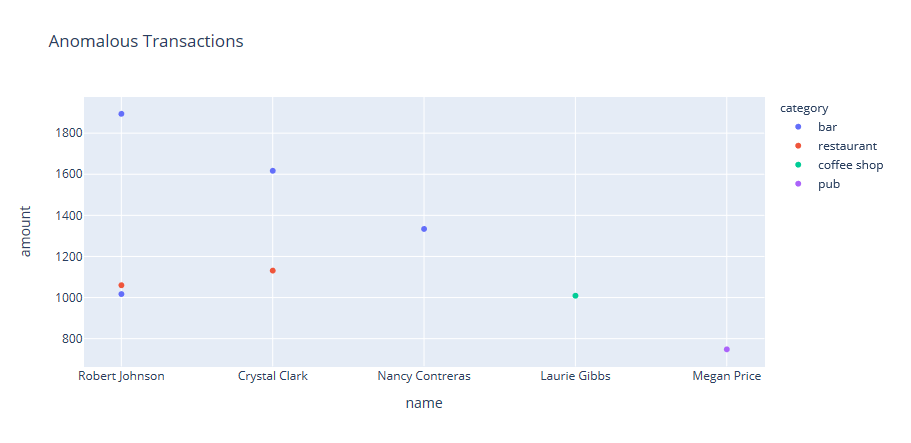
Another approach to identify fraudulent transactions is to look for outliers in the data. Standard deviation or quartiles are often used to detect outliers.
Identifying Outliers based on Standard Deviation
Identifying Outliers based on Interquartile Range
Ähnliche Projekte entdecken
Asabeneh/30-Days-Of-Python
Die Programmier-Challenge 30 Days of Python ist eine Schritt-für-Schritt-Anleitung, um die Programmiersprache Python in 30 Tagen zu lernen. Diese Challenge kann mehr als 100 Tage dauern. Gehe in deinem eigenen Tempo vor. Diese Videos können ebenfalls helfen: https://www.youtube.com/channel/UC7PNRuno1rzYPb1xLa4yktw
78,618 Sternegrafana/grafana
Offene und kombinierbare Plattform für Observability und Datenvisualisierung. Visualisiert Metriken, Logs und Traces aus mehreren Quellen wie Prometheus, Loki, Elasticsearch, InfluxDB, Postgres und vielen weiteren.
77,859 Sterneredis/redis
Für Entwickler, die echtzeitfähige, datengesteuerte Anwendungen erstellen, ist Redis der bevorzugte, schnellste und funktionsreichste Cache, Datenstrukturserver und die entsprechende Abfrageengine für Dokumente und Vektoren.
77,472 Sterneapache/superset
Apache Superset ist eine Plattform für Datenvisualisierung und Datenexploration.
75,495 Sterne